Work and Jobs in Marco Island, Florida (FL) Detailed Stats
Occupations, Industries, Unemployment, Workers, Commute
Settings
X


Recent posts about work in Marco Island, Florida on our local forum with over 2,400,000 registered users:
 | Second home/retirement (5 replies) |
| Losing small Town Charm in News (51 replies) |
| Young Family Looking to move to Naples from Carlsbad CA (61 replies) |
| Looking to Make Move to the Marco Island / Naples Ft Myers Area with a Family- Need Some Help! (23 replies) |
| 30-50 year old professionals Marco Island? (6 replies) |
| Arizona to Naples or Sarasota? (12 replies) |
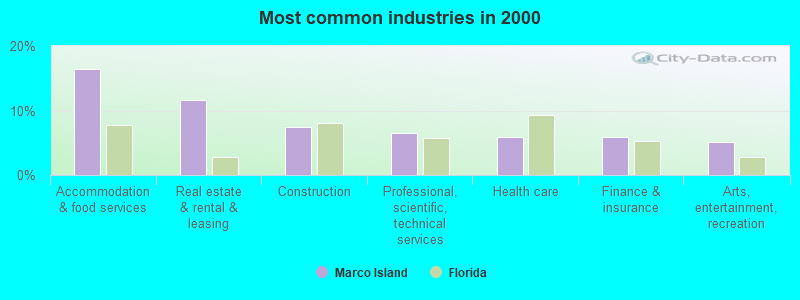
The most common industries in Marco Island are: Accommodation & food services (16.4% of civilian employees), Real estate & rental & leasing (11.7% of civilian employees), Construction (7.4% of civilian employees). 64.2% of workers are employees of private companies, which is 7.8% less than the rate of 69.2% across the entire state of Florida.
Most common industries
Most common industries | |||
|---|---|---|---|
Industry | All | Males | Females |
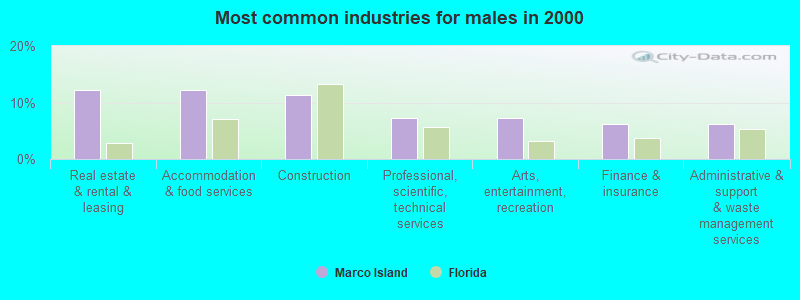
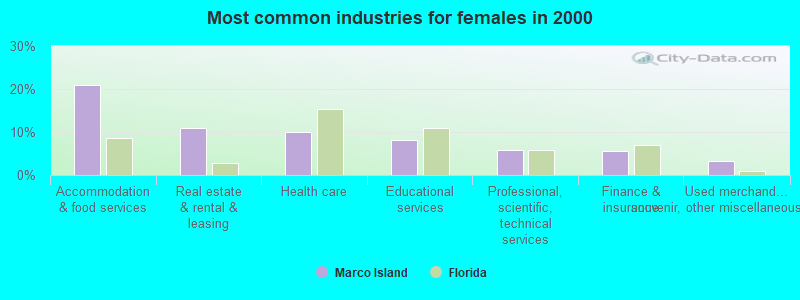
| Accommodation and food services | 16.4% (902) | 12.2% (355) | 21.0% (547) |
| Real estate and rental and leasing | 11.7% (643) | 12.3% (356) | 11.0% (287) |
| Construction | 7.4% (410) | 11.4% (331) | 3.0% (79) |
| Professional, scientific, and technical services | 6.6% (362) | 7.2% (210) | 5.8% (152) |
| Health care | 5.9% (326) | 2.3% (67) | 9.9% (259) |
| Finance and insurance | 5.9% (325) | 6.1% (178) | 5.6% (147) |
| Arts, entertainment, and recreation | 5.2% (286) | 7.2% (209) | 3.0% (77) |
| Educational services | 4.4% (242) | 1.0% (30) | 8.1% (212) |
| Administrative and support and waste management services | 4.2% (229) | 6.1% (178) | 2.0% (51) |
| Clothing and accessories, including shoe, stores | 2.3% (128) | 1.8% (51) | 3.0% (77) |
| Personal and laundry services | 2.2% (119) | 1.3% (38) | 3.1% (81) |
| Other transportation, and support activities, and couriers | 2.0% (108) | 3.0% (87) | 0.8% (21) |
| Public administration | 1.9% (107) | 3.4% (98) | 0.3% (9) |
| Used merchandise, gift, novelty, and souvenir, and other miscellaneous stores | 1.9% (106) | 0.8% (22) | 3.2% (84) |
| Religious, grantmaking, civic, professional, and similar organizations | 1.6% (86) | 1.9% (56) | 1.1% (30) |
| Food and beverage stores | 1.4% (76) | 1.8% (53) | 0.9% (23) |
| Furniture and home furnishings, and household appliance stores | 1.3% (73) | 1.3% (38) | 1.3% (35) |
| Motor vehicle and parts dealers | 1.2% (65) | 2.2% (65) | 0.0% (0) |
| Social assistance | 1.1% (62) | 0.2% (6) | 2.1% (56) |
| Air transportation | 1.1% (59) | 1.5% (43) | 0.6% (16) |
| Pharmacies and drug stores | 1.0% (54) | 0.3% (9) | 1.7% (45) |
| Broadcasting and telecommunications | 0.9% (52) | 1.1% (31) | 0.8% (21) |
| Publishing, and motion picture and sound recording industries | 0.9% (48) | 0.2% (6) | 1.6% (42) |
| Jewelry, luggage, and leather goods stores | 0.9% (48) | 0.3% (10) | 1.5% (38) |
| Truck transportation | 0.7% (40) | 0.7% (19) | 0.8% (21) |
| Utilities | 0.7% (38) | 1.3% (38) | 0.0% (0) |
| Metal and metal products | 0.6% (35) | 1.2% (35) | 0.0% (0) |
| Miscellaneous nondurable goods merchant wholesalers | 0.5% (27) | 0.6% (18) | 0.3% (9) |
| Apparel | 0.5% (27) | 0.0% (0) | 1.0% (27) |
| Machinery | 0.5% (27) | 0.9% (27) | 0.0% (0) |
| Machinery, equipment, and supplies merchant wholesalers | 0.5% (27) | 0.7% (19) | 0.3% (8) |
| Health and personal care, except drug, stores | 0.5% (26) | 0.0% (0) | 1.0% (26) |
| Furniture and home furnishing merchant wholesalers | 0.5% (25) | 0.9% (25) | 0.0% (0) |
| Hardware, plumbing and heating equipment, and supplies merchant wholesalers | 0.5% (25) | 0.4% (11) | 0.5% (14) |
| Repair and maintenance | 0.4% (24) | 0.2% (7) | 0.7% (17) |
| Other direct selling establishments | 0.4% (22) | 0.6% (16) | 0.2% (6) |
| Building material and garden equipment and supplies dealers | 0.4% (21) | 0.2% (7) | 0.5% (14) |
| Electrical and electronic goods merchant wholesalers | 0.3% (17) | 0.6% (17) | 0.0% (0) |
| Department and other general merchandise stores | 0.3% (17) | 0.0% (0) | 0.7% (17) |
| Paper | 0.3% (16) | 0.6% (16) | 0.0% (0) |
| Furniture and related product manufacturing | 0.3% (15) | 0.3% (10) | 0.2% (5) |
| Computer and electronic products | 0.3% (14) | 0.3% (10) | 0.2% (4) |
| U. S. Postal service | 0.2% (13) | 0.2% (5) | 0.3% (8) |
| Professional and commercial equipment and supplies merchant wholesalers | 0.2% (12) | 0.4% (12) | 0.0% (0) |
| Lumber and other construction materials merchant wholesalers | 0.2% (12) | 0.2% (5) | 0.3% (7) |
| Printing and related support activities | 0.2% (12) | 0.0% (0) | 0.5% (12) |
| Radio, TV, and computer stores | 0.2% (11) | 0.4% (11) | 0.0% (0) |
| Sporting goods, camera, and hobby and toy stores | 0.2% (9) | 0.3% (9) | 0.0% (0) |
| Mining, quarrying, and oil and gas extraction | 0.1% (8) | 0.3% (8) | 0.0% (0) |
| Agriculture, forestry, fishing and hunting | 0.1% (8) | 0.3% (8) | 0.0% (0) |
| Gasoline stations | 0.1% (8) | 0.3% (8) | 0.0% (0) |
| Miscellaneous durable goods merchant wholesalers | 0.1% (8) | 0.3% (8) | 0.0% (0) |
| Data processing, libraries, and other information services | 0.1% (8) | 0.0% (0) | 0.3% (8) |
| Miscellaneous manufacturing | 0.1% (7) | 0.2% (7) | 0.0% (0) |
| Transportation equipment | 0.1% (7) | 0.2% (7) | 0.0% (0) |
| Nonmetallic mineral products | 0.1% (7) | 0.2% (7) | 0.0% (0) |
| Wood products | 0.1% (7) | 0.2% (7) | 0.0% (0) |
| Private households | 0.1% (7) | 0.0% (0) | 0.3% (7) |
| Groceries and related products merchant wholesalers | 0.1% (6) | 0.0% (0) | 0.2% (6) |
Unemployment in Marco Island
- Unemployment by race in 2000
- Unemployment rate for White non-Hispanic residents
- 0.9%Males
- 1.1%Females
- Unemployment rate for two or more race residents
- 50.0%Females
Time leaving home to go to work

<5am:
| Marco Island: | 0.6% (34) |
| Florida: | 2.8% (195,491) |
5:30am:
| Marco Island: | 2.0% (106) |
| Florida: | 2.4% (162,873) |
6am:
| Marco Island: | 0.7% (35) |
| Florida: | 3.6% (247,678) |
6:30am:
| Marco Island: | 4.5% (242) |
| Florida: | 8.2% (569,201) |
7am:
| Marco Island: | 4.5% (238) |
| Florida: | 10.4% (720,998) |
7:30am:
| Marco Island: | 11.7% (624) |
| Florida: | 15.4% (1,063,673) |
8am:
| Marco Island: | 15.5% (828) |
| Florida: | 15.1% (1,046,414) |
8:30am:
| Marco Island: | 16.1% (860) |
| Florida: | 11.8% (812,057) |
9am:
| Marco Island: | 6.9% (368) |
| Florida: | 5.6% (388,700) |
10am:
| Marco Island: | 12.8% (682) |
| Florida: | 6.1% (419,450) |
11am:
| Marco Island: | 5.3% (285) |
| Florida: | 2.4% (167,860) |
12pm:
| Marco Island: | 0.4% (19) |
| Florida: | 1.1% (77,065) |
4pm:
| Marco Island: | 6.2% (331) |
| Florida: | 6.0% (413,569) |
>4pm:
| Marco Island: | 4.2% (224) |
| Florida: | 6.0% (418,050) |
Travel time to work
Daytime population change due to commuting: +1,313 (+8.8%)
Workers who live and work in this city: 3,515 (65.8%)
Workers who live and work in this city: 3,515 (65.8%)


Less than 5 minutes:
| Marco Island: | 8.3% (445) |
| Florida: | 2.3% (155,487) |
5 to 9 minutes:
| Marco Island: | 31.2% (1,664) |
| Florida: | 8.6% (595,769) |
10 to 14 minutes:
| Marco Island: | 17.9% (956) |
| Florida: | 13.3% (922,343) |
15 to 19 minutes:
| Marco Island: | 7.2% (382) |
| Florida: | 15.7% (1,085,636) |
20 to 24 minutes:
| Marco Island: | 6.3% (338) |
| Florida: | 15.1% (1,040,084) |
25 to 29 minutes:
| Marco Island: | 1.3% (70) |
| Florida: | 5.9% (404,902) |
30 to 34 minutes:
| Marco Island: | 6.1% (326) |
| Florida: | 15.6% (1,078,082) |
35 to 39 minutes:
| Marco Island: | 0.8% (42) |
| Florida: | 2.6% (182,138) |
40 to 44 minutes:
| Marco Island: | 2.6% (139) |
| Florida: | 3.4% (237,660) |
45 to 59 minutes:
| Marco Island: | 4.2% (225) |
| Florida: | 7.7% (534,237) |
60 to 89 minutes:
| Marco Island: | 3.1% (163) |
| Florida: | 4.4% (303,002) |
90 or more minutes:
| Marco Island: | 2.4% (126) |
| Florida: | 2.4% (163,739) |
Means of transportation to work

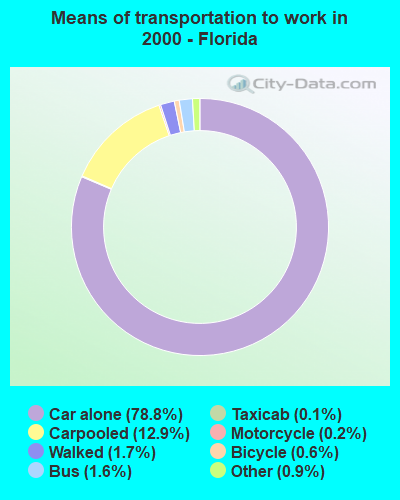
Drove car alone:
| Marco Island: | 75.0% (4,006) |
| Florida: | 78.8% (5,445,527) |
Carpooled:
| Marco Island: | 11.2% (599) |
| Florida: | 12.9% (893,766) |
Taxicab:
| Marco Island: | 0.2% (13) |
| Florida: | 0.1% (8,708) |
Bicycle:
| Marco Island: | 0.9% (46) |
| Florida: | 0.6% (39,294) |
Walked:
| Marco Island: | 2.6% (140) |
| Florida: | 1.7% (118,386) |
Other means:
| Marco Island: | 1.3% (72) |
| Florida: | 0.9% (62,064) |
Private vehicle occupancy

Drove alone:
| Marco Island: | 87.0% (4,006) |
| Florida: | 85.9% (5,445,527) |
In 2 person carpool:
| Marco Island: | 12.3% (565) |
| Florida: | 11.0% (698,577) |
In 3 person carpool:
| Marco Island: | 0.3% (15) |
| Florida: | 1.9% (117,465) |
In 5-6 person carpool:
| Marco Island: | 0.4% (19) |
| Florida: | 0.3% (22,177) |
Class of workers

Employee of private company:
| Marco Island: | 64.2% (3,537) |
| Florida: | 69.2% (4,840,105) |
Self-employed in own incorporated business:
| Marco Island: | 12.0% (659) |
| Florida: | 4.9% (343,812) |
Private not-for-profit wage and salary workers:
| Marco Island: | 5.9% (327) |
| Florida: | 5.7% (395,397) |
Local government workers:
| Marco Island: | 5.4% (296) |
| Florida: | 7.7% (542,086) |
State government workers:
| Marco Island: | 0.8% (43) |
| Florida: | 3.7% (261,182) |
Federal government workers:
| Marco Island: | 0.4% (21) |
| Florida: | 2.2% (157,343) |
Self-employed workers in own not incorporated business:
| Marco Island: | 11.2% (616) |
| Florida: | 6.2% (435,619) |
Unpaid family workers:
| Marco Island: | 0.3% (14) |
| Florida: | 0.3% (19,503) |

Employee of private company - Males:
| Marco Island: | 59.5% (1,727) |
| Florida: | 70.4% (2,619,497) |
Self-employed in own incorporated business - Males:
| Marco Island: | 16.9% (490) |
| Florida: | 6.7% (249,173) |
Private not-for-profit wage and salary workers - Males:
| Marco Island: | 4.8% (140) |
| Florida: | 3.5% (131,238) |
Local government workers - Males:
| Marco Island: | 4.9% (142) |
| Florida: | 6.2% (229,948) |
State government workers - Males:
| Marco Island: | 0.7% (19) |
| Florida: | 3.0% (112,661) |
Federal government workers - Males:
| Marco Island: | 0.4% (13) |
| Florida: | 2.5% (92,242) |
Self-employed workers in own not incorporated business - Males:
| Marco Island: | 12.8% (373) |
| Florida: | 7.4% (276,378) |

Employee of private company - Females:
| Marco Island: | 69.4% (1,810) |
| Florida: | 67.8% (2,220,608) |
Self-employed in own incorporated business - Females:
| Marco Island: | 6.5% (169) |
| Florida: | 2.9% (94,639) |
Private not-for-profit wage and salary workers - Females:
| Marco Island: | 7.2% (187) |
| Florida: | 8.1% (264,159) |
Local government workers - Females:
| Marco Island: | 5.9% (154) |
| Florida: | 9.5% (312,138) |
State government workers - Females:
| Marco Island: | 0.9% (24) |
| Florida: | 4.5% (148,521) |
Federal government workers - Females:
| Marco Island: | 0.3% (8) |
| Florida: | 2.0% (65,101) |
Self-employed workers in own not incorporated business - Females:
| Marco Island: | 9.3% (243) |
| Florida: | 4.9% (159,241) |
Unpaid family workers - Females:
| Marco Island: | 0.5% (14) |
| Florida: | 0.3% (11,368) |