Work and Jobs in Mather, California (CA) Detailed Stats
Occupations, Industries, Unemployment, Workers, Commute
Settings
X


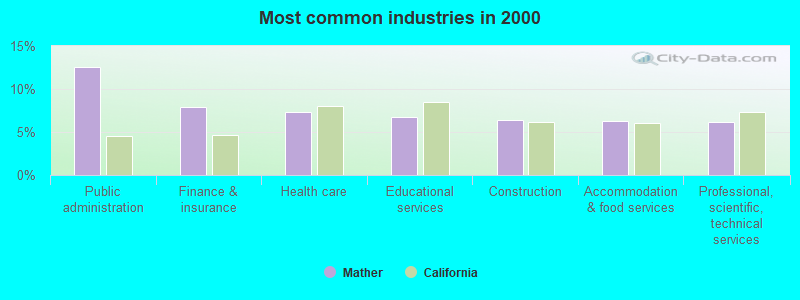
The most common industries in Mather are: Public administration (12.6% of civilian employees), Finance & insurance (7.9% of civilian employees), Health care (7.3% of civilian employees). 63.4% of workers are employees of private companies, which is 7.2% less than the rate of 68.0% across the entire state of California.
Most common industries
Most common industries | |||
|---|---|---|---|
Industry | All | Males | Females |
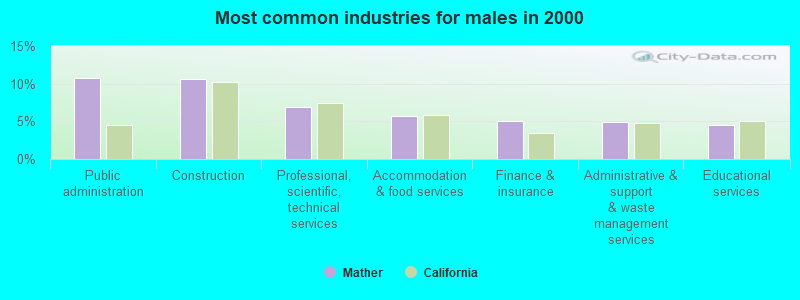
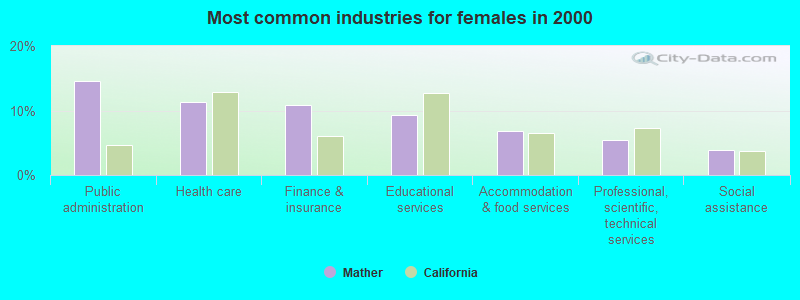
| Public administration | 12.6% (5,825) | 10.7% (2,543) | 14.6% (3,282) |
| Finance and insurance | 7.9% (3,637) | 5.0% (1,195) | 10.9% (2,442) |
| Health care | 7.3% (3,399) | 3.6% (858) | 11.3% (2,541) |
| Educational services | 6.8% (3,148) | 4.5% (1,059) | 9.3% (2,089) |
| Construction | 6.3% (2,939) | 10.6% (2,529) | 1.8% (410) |
| Accommodation and food services | 6.2% (2,888) | 5.7% (1,363) | 6.8% (1,525) |
| Professional, scientific, and technical services | 6.2% (2,867) | 6.9% (1,652) | 5.4% (1,215) |
| Administrative and support and waste management services | 4.3% (1,986) | 4.9% (1,163) | 3.7% (823) |
| Computer and electronic products | 2.7% (1,273) | 3.5% (842) | 1.9% (431) |
| Broadcasting and telecommunications | 2.4% (1,115) | 2.2% (518) | 2.7% (597) |
| Social assistance | 2.2% (1,026) | 0.7% (166) | 3.8% (860) |
| Real estate and rental and leasing | 2.2% (1,023) | 2.4% (565) | 2.0% (458) |
| Arts, entertainment, and recreation | 1.7% (804) | 1.8% (438) | 1.6% (366) |
| Religious, grantmaking, civic, professional, and similar organizations | 1.7% (787) | 1.1% (264) | 2.3% (523) |
| Repair and maintenance | 1.7% (780) | 2.9% (691) | 0.4% (89) |
| Department and other general merchandise stores | 1.7% (776) | 1.2% (282) | 2.2% (494) |
| Food and beverage stores | 1.6% (739) | 1.7% (396) | 1.5% (343) |
| Motor vehicle and parts dealers | 1.4% (626) | 2.3% (556) | 0.3% (70) |
| Other transportation, and support activities, and couriers | 1.1% (503) | 1.3% (309) | 0.9% (194) |
| Personal and laundry services | 1.1% (498) | 0.6% (140) | 1.6% (358) |
| Radio, TV, and computer stores | 1.1% (490) | 1.3% (301) | 0.8% (189) |
| Miscellaneous manufacturing | 1.0% (466) | 1.1% (250) | 1.0% (216) |
| Truck transportation | 1.0% (454) | 1.8% (419) | 0.2% (35) |
| Data processing, libraries, and other information services | 0.9% (432) | 0.9% (205) | 1.0% (227) |
| Utilities | 0.9% (430) | 1.3% (313) | 0.5% (117) |
| Building material and garden equipment and supplies dealers | 0.9% (418) | 1.2% (280) | 0.6% (138) |
| Other direct selling establishments | 0.9% (416) | 1.0% (227) | 0.8% (189) |
| Publishing, and motion picture and sound recording industries | 0.8% (369) | 0.9% (224) | 0.6% (145) |
| U. S. Postal service | 0.7% (304) | 0.9% (210) | 0.4% (94) |
| Printing and related support activities | 0.6% (296) | 0.9% (209) | 0.4% (87) |
| Furniture and home furnishings, and household appliance stores | 0.6% (289) | 0.8% (198) | 0.4% (91) |
| Transportation equipment | 0.6% (282) | 1.0% (240) | 0.2% (42) |
| Used merchandise, gift, novelty, and souvenir, and other miscellaneous stores | 0.6% (280) | 0.3% (71) | 0.9% (209) |
| Pharmacies and drug stores | 0.5% (242) | 0.2% (50) | 0.9% (192) |
| Machinery | 0.5% (213) | 0.8% (179) | 0.2% (34) |
| Food | 0.4% (207) | 0.7% (163) | 0.2% (44) |
| Metal and metal products | 0.4% (206) | 0.8% (189) | 0.1% (17) |
| Electrical and electronic goods merchant wholesalers | 0.4% (191) | 0.5% (124) | 0.3% (67) |
| Professional and commercial equipment and supplies merchant wholesalers | 0.4% (189) | 0.6% (131) | 0.3% (58) |
| Private households | 0.4% (185) | 0.1% (30) | 0.7% (155) |
| Clothing and accessories, including shoe, stores | 0.4% (179) | 0.2% (58) | 0.5% (121) |
| Groceries and related products merchant wholesalers | 0.4% (173) | 0.7% (155) | 0.1% (18) |
| Miscellaneous nondurable goods merchant wholesalers | 0.3% (160) | 0.4% (93) | 0.3% (67) |
| Air transportation | 0.3% (158) | 0.5% (123) | 0.2% (35) |
| Sporting goods, camera, and hobby and toy stores | 0.3% (148) | 0.4% (102) | 0.2% (46) |
| Furniture and related product manufacturing | 0.3% (148) | 0.5% (113) | 0.2% (35) |
| Motor vehicles, parts and supplies merchant wholesalers | 0.3% (138) | 0.4% (106) | 0.1% (32) |
| Wood products | 0.3% (123) | 0.4% (107) | 0.1% (16) |
| Lumber and other construction materials merchant wholesalers | 0.3% (123) | 0.5% (111) | 0.1% (12) |
| Electrical equipment, appliances, and components | 0.3% (117) | 0.4% (101) | 0.1% (16) |
| Gasoline stations | 0.2% (112) | 0.3% (82) | 0.1% (30) |
| Agriculture, forestry, fishing and hunting | 0.2% (112) | 0.4% (85) | 0.1% (27) |
| Office supplies and stationery stores | 0.2% (108) | 0.2% (57) | 0.2% (51) |
| Drugs, sundries, and chemical and allied products merchant wholesalers | 0.2% (106) | 0.3% (66) | 0.2% (40) |
| Electronic shopping and mail-order houses | 0.2% (101) | 0.3% (77) | 0.1% (24) |
| Nonmetallic mineral products | 0.2% (99) | 0.3% (80) | 0.1% (19) |
| Health and personal care, except drug, stores | 0.2% (95) | 0.0% (0) | 0.4% (95) |
| Warehousing and storage | 0.2% (94) | 0.2% (54) | 0.2% (40) |
| Plastics and rubber products | 0.2% (92) | 0.3% (74) | 0.1% (18) |
| Miscellaneous durable goods merchant wholesalers | 0.2% (91) | 0.3% (65) | 0.1% (26) |
| Chemicals | 0.2% (82) | 0.2% (51) | 0.1% (31) |
| Book stores and news dealers | 0.2% (82) | 0.2% (40) | 0.2% (42) |
| Beverage and tobacco products | 0.2% (80) | 0.3% (80) | 0.0% (0) |
| Furniture and home furnishing merchant wholesalers | 0.1% (69) | 0.2% (49) | 0.1% (20) |
| Hardware, plumbing and heating equipment, and supplies merchant wholesalers | 0.1% (55) | 0.2% (44) | 0.0% (11) |
| Retail florists | 0.1% (50) | 0.1% (12) | 0.2% (38) |
| Recyclable material merchant wholesalers | 0.1% (49) | 0.2% (40) | 0.0% (9) |
| Textile mills and textile products | 0.1% (47) | 0.1% (14) | 0.1% (33) |
| Music stores | 0.1% (47) | 0.1% (18) | 0.1% (29) |
| Machinery, equipment, and supplies merchant wholesalers | 0.1% (41) | 0.2% (41) | 0.0% (0) |
| Petroleum and petroleum products merchant wholesalers | 0.1% (39) | 0.1% (31) | 0.0% (8) |
| Jewelry, luggage, and leather goods stores | 0.1% (39) | 0.1% (29) | 0.0% (10) |
| Paper | 0.1% (38) | 0.1% (27) | 0.0% (11) |
Unemployment in Mather
- Unemployment by race in 2000
- Unemployment rate for White non-Hispanic residents
- 5.5%Males
- 4.4%Females
- Unemployment rate for Black residents
- 14.5%Males
- 6.7%Females
- Unemployment rate for American Indian and Alaska Native residents
- 19.2%Males
- 11.4%Females
- Unemployment rate for Asian residents
- 6.3%Males
- 3.0%Females
- Unemployment rate for other race residents
- 5.2%Males
- 4.9%Females
- Unemployment rate for two or more race residents
- 8.6%Males
- 8.6%Females
- Unemployment rate for Hispanic or Latino residents
- 5.4%Males
- 8.2%Females
Time leaving home to go to work

<5am:
| Mather: | 3.0% (1,355) |
| California: | 4.2% (606,086) |
5:30am:
| Mather: | 2.3% (1,072) |
| California: | 3.6% (523,209) |
6am:
| Mather: | 5.3% (2,410) |
| California: | 4.8% (692,256) |
6:30am:
| Mather: | 8.7% (3,990) |
| California: | 8.4% (1,216,867) |
7am:
| Mather: | 11.2% (5,145) |
| California: | 9.4% (1,362,830) |
7:30am:
| Mather: | 15.6% (7,130) |
| California: | 13.8% (2,006,950) |
8am:
| Mather: | 15.1% (6,893) |
| California: | 13.7% (1,986,831) |
8:30am:
| Mather: | 10.0% (4,586) |
| California: | 10.9% (1,577,815) |
9am:
| Mather: | 4.9% (2,239) |
| California: | 5.4% (778,152) |
10am:
| Mather: | 5.3% (2,404) |
| California: | 6.7% (972,355) |
11am:
| Mather: | 2.4% (1,116) |
| California: | 2.9% (414,479) |
12pm:
| Mather: | 1.2% (537) |
| California: | 1.3% (189,005) |
4pm:
| Mather: | 5.7% (2,617) |
| California: | 6.0% (865,284) |
>4pm:
| Mather: | 6.0% (2,728) |
| California: | 5.3% (776,167) |
Travel time to work


Less than 5 minutes:
| Mather: | 2.2% (988) |
| California: | 2.2% (324,703) |
5 to 9 minutes:
| Mather: | 10.0% (4,564) |
| California: | 8.8% (1,280,443) |
10 to 14 minutes:
| Mather: | 14.3% (6,537) |
| California: | 13.3% (1,930,263) |
15 to 19 minutes:
| Mather: | 17.7% (8,103) |
| California: | 14.9% (2,157,970) |
20 to 24 minutes:
| Mather: | 18.0% (8,237) |
| California: | 13.8% (2,004,060) |
25 to 29 minutes:
| Mather: | 7.7% (3,537) |
| California: | 5.4% (782,241) |
30 to 34 minutes:
| Mather: | 14.7% (6,734) |
| California: | 13.9% (2,025,657) |
35 to 39 minutes:
| Mather: | 1.9% (863) |
| California: | 2.5% (366,487) |
40 to 44 minutes:
| Mather: | 2.0% (900) |
| California: | 3.6% (528,043) |
45 to 59 minutes:
| Mather: | 3.7% (1,710) |
| California: | 7.9% (1,151,598) |
60 to 89 minutes:
| Mather: | 2.7% (1,242) |
| California: | 6.4% (933,123) |
90 or more minutes:
| Mather: | 1.8% (807) |
| California: | 3.3% (483,698) |
Means of transportation to work


Drove car alone:
| Mather: | 75.4% (34,473) |
| California: | 71.8% (10,432,462) |
Carpooled:
| Mather: | 13.3% (6,104) |
| California: | 14.5% (2,113,313) |
Bus or trolley bus:
| Mather: | 2.2% (1,025) |
| California: | 3.8% (549,425) |
Streetcar or trolley car:
| Mather: | 0.6% (272) |
| California: | 0.1% (21,158) |
Subway or elevated:
| Mather: | 0.5% (227) |
| California: | 0.7% (107,711) |
Railroad:
| Mather: | 0.9% (390) |
| California: | 0.3% (41,022) |
Motorcycle:
| Mather: | 0.2% (104) |
| California: | 0.2% (36,262) |
Bicycle:
| Mather: | 1.1% (486) |
| California: | 0.8% (120,567) |
Walked:
| Mather: | 1.8% (834) |
| California: | 2.9% (414,581) |
Other means:
| Mather: | 0.7% (307) |
| California: | 0.8% (115,064) |
Private vehicle occupancy

Drove alone:
| Mather: | 85.0% (34,473) |
| California: | 83.2% (10,432,462) |
In 2 person carpool:
| Mather: | 11.8% (4,794) |
| California: | 12.5% (1,564,905) |
In 3 person carpool:
| Mather: | 2.3% (923) |
| California: | 2.6% (330,732) |
In 4 person carpool:
| Mather: | 0.6% (236) |
| California: | 1.0% (119,364) |
In 5-6 person carpool:
| Mather: | 0.2% (82) |
| California: | 0.5% (57,036) |
In 7+ person carpool:
| Mather: | 0.2% (69) |
| California: | 0.3% (41,276) |
Class of workers

Employee of private company:
| Mather: | 63.4% (29,374) |
| California: | 68.0% (10,009,465) |
Self-employed in own incorporated business:
| Mather: | 1.4% (626) |
| California: | 2.7% (402,392) |
Private not-for-profit wage and salary workers:
| Mather: | 6.2% (2,868) |
| California: | 5.7% (845,536) |
Local government workers:
| Mather: | 7.6% (3,523) |
| California: | 8.3% (1,218,764) |
State government workers:
| Mather: | 12.2% (5,653) |
| California: | 4.0% (594,953) |
Federal government workers:
| Mather: | 2.5% (1,170) |
| California: | 2.3% (344,354) |
Self-employed workers in own not incorporated business:
| Mather: | 6.5% (3,008) |
| California: | 8.5% (1,249,530) |
Unpaid family workers:
| Mather: | 0.2% (81) |
| California: | 0.4% (53,934) |

Employee of private company - Males:
| Mather: | 68.1% (16,211) |
| California: | 71.1% (5,716,697) |
Self-employed in own incorporated business - Males:
| Mather: | 1.8% (431) |
| California: | 3.6% (290,657) |
Private not-for-profit wage and salary workers - Males:
| Mather: | 3.8% (900) |
| California: | 3.8% (303,997) |
Local government workers - Males:
| Mather: | 6.1% (1,452) |
| California: | 6.2% (495,927) |
State government workers - Males:
| Mather: | 10.0% (2,376) |
| California: | 3.2% (255,434) |
Federal government workers - Males:
| Mather: | 2.7% (632) |
| California: | 2.5% (198,555) |
Self-employed workers in own not incorporated business - Males:
| Mather: | 7.4% (1,769) |
| California: | 9.5% (760,853) |
Unpaid family workers - Males:
| Mather: | 0.1% (26) |
| California: | 0.3% (23,230) |

Employee of private company - Females:
| Mather: | 58.5% (13,163) |
| California: | 64.3% (4,292,768) |
Self-employed in own incorporated business - Females:
| Mather: | 0.9% (195) |
| California: | 1.7% (111,735) |
Private not-for-profit wage and salary workers - Females:
| Mather: | 8.7% (1,968) |
| California: | 8.1% (541,539) |
Local government workers - Females:
| Mather: | 9.2% (2,071) |
| California: | 10.8% (722,837) |
State government workers - Females:
| Mather: | 14.6% (3,277) |
| California: | 5.1% (339,519) |
Federal government workers - Females:
| Mather: | 2.4% (538) |
| California: | 2.2% (145,799) |
Self-employed workers in own not incorporated business - Females:
| Mather: | 5.5% (1,239) |
| California: | 7.3% (488,677) |
Unpaid family workers - Females:
| Mather: | 0.2% (55) |
| California: | 0.5% (30,704) |