Work and Jobs in Nampa, Idaho (ID) Detailed Stats
Occupations, Industries, Unemployment, Workers, Commute
Settings
X


Recent posts about work in Nampa, Idaho on our local forum with over 2,400,000 registered users:
 | Nampa and Boise are two of best run cities in the US (0 replies) |
| Talk to me about jobs and rentals... (16 replies) |
| Boise area has among the fastest-rising home prices in the U.S. Wages aren’t keeping up. (62 replies) |
| Down payment question (43 replies) |
| Could Nampa ever see a health food market open up? (20 replies) |
| Jobs in Boise/Nampa Area (5 replies) |
Latest news about work in Nampa, ID collected exclusively by city-data.com from local newspapers, TV, and radio stations
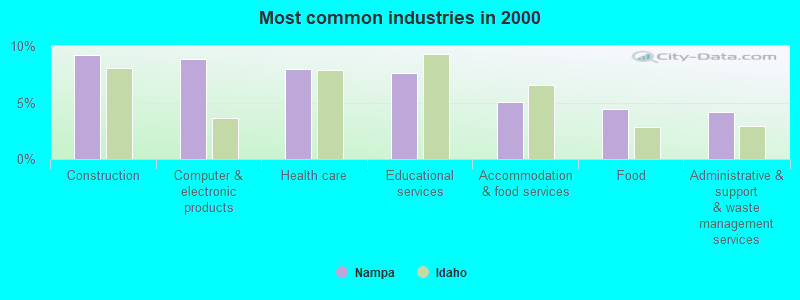
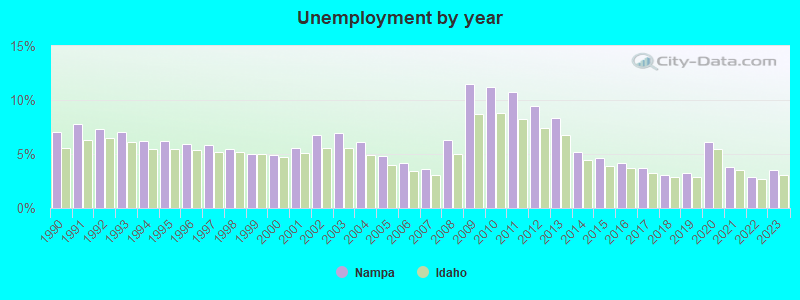
The unemployment rate in 2023 in Nampa, ID was 3.5%, which was 11.4% greater than the unemployment rate of 3.1% across the entire state of Idaho. Compared to the unemployment rate of 8.3% in 2013, this represents a decrease of 137.1%. The most common industries in Nampa are: Construction (9.2% of civilian employees), Computer & electronic products (8.8% of civilian employees), Health care (7.9% of civilian employees). 59.0% of workers work in Canyon County and 9.0% of all workers work at home. 71.1% of workers are employees of private companies, which is 8.1% greater than the rate of 65.4% across the entire state of Idaho.
Whole page based on the data from 2000 / 2022 when the population of Nampa, Idaho was 51,867 / 110,932
Whole page based on the data from 2000 / 2022 when the population of Nampa, Idaho was 51,867 / 110,932
Most common industries
Most common industries | |||
|---|---|---|---|
Industry | All | Males | Females |
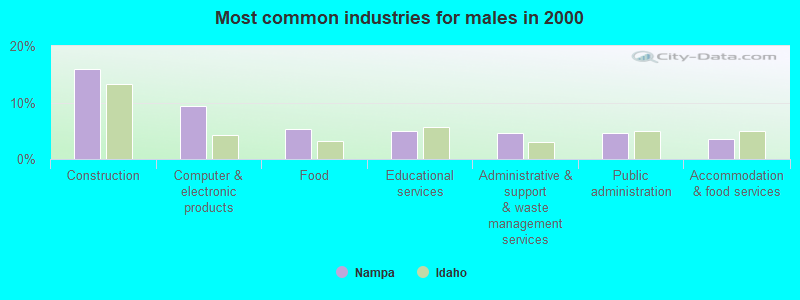
| Construction | 9.2% (2,166) | 15.9% (2,013) | 1.4% (153) |
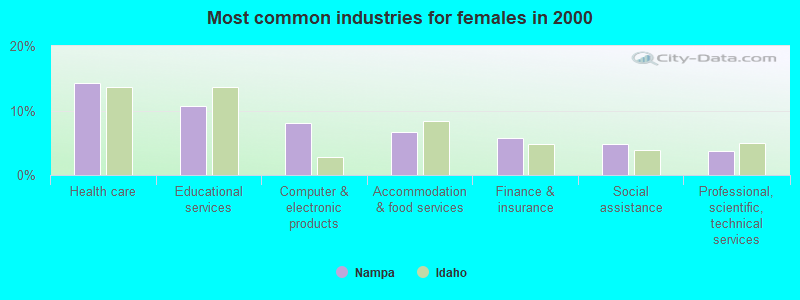
| Computer and electronic products | 8.8% (2,064) | 9.5% (1,199) | 8.0% (865) |
| Health care | 7.9% (1,860) | 2.6% (326) | 14.3% (1,534) |
| Educational services | 7.6% (1,781) | 5.0% (634) | 10.7% (1,147) |
| Accommodation and food services | 5.0% (1,179) | 3.6% (458) | 6.7% (721) |
| Food | 4.4% (1,038) | 5.2% (663) | 3.5% (375) |
| Administrative and support and waste management services | 4.1% (969) | 4.7% (593) | 3.5% (376) |
| Public administration | 4.1% (964) | 4.7% (592) | 3.5% (372) |
| Finance and insurance | 3.6% (835) | 1.7% (220) | 5.7% (615) |
| Professional, scientific, and technical services | 3.1% (726) | 2.6% (327) | 3.7% (399) |
| Food and beverage stores | 2.9% (687) | 2.3% (292) | 3.7% (395) |
| Social assistance | 2.5% (575) | 0.4% (51) | 4.9% (524) |
| Wood products | 2.0% (468) | 3.0% (382) | 0.8% (86) |
| Repair and maintenance | 2.0% (466) | 3.3% (417) | 0.5% (49) |
| Agriculture, forestry, fishing and hunting | 1.8% (421) | 2.4% (310) | 1.0% (111) |
| Motor vehicle and parts dealers | 1.8% (418) | 2.7% (338) | 0.7% (80) |
| Department and other general merchandise stores | 1.7% (387) | 0.9% (116) | 2.5% (271) |
| Broadcasting and telecommunications | 1.4% (334) | 1.0% (130) | 1.9% (204) |
| Real estate and rental and leasing | 1.4% (330) | 1.2% (151) | 1.7% (179) |
| Building material and garden equipment and supplies dealers | 1.4% (326) | 1.8% (228) | 0.9% (98) |
| Truck transportation | 1.4% (325) | 2.2% (281) | 0.4% (44) |
| Other transportation, and support activities, and couriers | 1.3% (310) | 1.3% (161) | 1.4% (149) |
| Religious, grantmaking, civic, professional, and similar organizations | 1.2% (291) | 1.3% (161) | 1.2% (130) |
| Personal and laundry services | 1.2% (272) | 0.3% (41) | 2.1% (231) |
| Arts, entertainment, and recreation | 1.1% (260) | 0.9% (112) | 1.4% (148) |
| Groceries and related products merchant wholesalers | 0.9% (207) | 1.2% (156) | 0.5% (51) |
| Transportation equipment | 0.9% (206) | 1.3% (168) | 0.4% (38) |
| Metal and metal products | 0.8% (197) | 1.3% (163) | 0.3% (34) |
| Furniture and home furnishings, and household appliance stores | 0.8% (178) | 1.0% (133) | 0.4% (45) |
| Utilities | 0.7% (163) | 1.0% (124) | 0.4% (39) |
| Other direct selling establishments | 0.7% (161) | 0.7% (85) | 0.7% (76) |
| Furniture and related product manufacturing | 0.6% (147) | 0.8% (100) | 0.4% (47) |
| Nonmetallic mineral products | 0.6% (141) | 0.9% (120) | 0.2% (21) |
| Used merchandise, gift, novelty, and souvenir, and other miscellaneous stores | 0.6% (141) | 0.5% (60) | 0.8% (81) |
| Machinery | 0.6% (139) | 0.9% (118) | 0.2% (21) |
| Publishing, and motion picture and sound recording industries | 0.6% (135) | 0.6% (73) | 0.6% (62) |
| Miscellaneous manufacturing | 0.6% (133) | 0.6% (74) | 0.5% (59) |
| U. S. Postal service | 0.5% (119) | 0.4% (56) | 0.6% (63) |
| Rail transportation | 0.4% (102) | 0.8% (102) | 0.0% (0) |
| Private households | 0.4% (101) | 0.2% (29) | 0.7% (72) |
| Clothing and accessories, including shoe, stores | 0.4% (99) | 0.1% (8) | 0.8% (91) |
| Warehousing and storage | 0.4% (94) | 0.4% (50) | 0.4% (44) |
| Printing and related support activities | 0.4% (91) | 0.3% (44) | 0.4% (47) |
| Lumber and other construction materials merchant wholesalers | 0.4% (89) | 0.5% (61) | 0.3% (28) |
| Radio, TV, and computer stores | 0.4% (88) | 0.6% (79) | 0.1% (9) |
| Air transportation | 0.4% (83) | 0.3% (32) | 0.5% (51) |
| Machinery, equipment, and supplies merchant wholesalers | 0.3% (78) | 0.5% (61) | 0.2% (17) |
| Gasoline stations | 0.3% (77) | 0.3% (32) | 0.4% (45) |
| Pharmacies and drug stores | 0.3% (76) | 0.1% (8) | 0.6% (68) |
| Data processing, libraries, and other information services | 0.3% (73) | 0.3% (44) | 0.3% (29) |
| Farm supplies merchant wholesalers | 0.3% (59) | 0.1% (16) | 0.4% (43) |
| Chemicals | 0.2% (50) | 0.3% (42) | 0.1% (8) |
| Motor vehicles, parts and supplies merchant wholesalers | 0.2% (48) | 0.4% (48) | 0.0% (0) |
| Plastics and rubber products | 0.2% (48) | 0.3% (41) | 0.1% (7) |
| Miscellaneous nondurable goods merchant wholesalers | 0.2% (46) | 0.1% (16) | 0.3% (30) |
| Hardware, plumbing and heating equipment, and supplies merchant wholesalers | 0.2% (45) | 0.2% (26) | 0.2% (19) |
| Professional and commercial equipment and supplies merchant wholesalers | 0.2% (45) | 0.3% (32) | 0.1% (13) |
| Sporting goods, camera, and hobby and toy stores | 0.2% (43) | 0.2% (26) | 0.2% (17) |
| Health and personal care, except drug, stores | 0.2% (43) | 0.0% (0) | 0.4% (43) |
| Paper | 0.2% (42) | 0.1% (19) | 0.2% (23) |
| Electrical and electronic goods merchant wholesalers | 0.2% (42) | 0.2% (22) | 0.2% (20) |
| Recyclable material merchant wholesalers | 0.2% (40) | 0.3% (40) | 0.0% (0) |
| Office supplies and stationery stores | 0.2% (36) | 0.1% (16) | 0.2% (20) |
| Alcoholic beverages merchant wholesalers | 0.1% (33) | 0.2% (28) | 0.0% (5) |
| Metals and minerals, except petroleum, merchant wholesalers | 0.1% (27) | 0.2% (27) | 0.0% (0) |
| Book stores and news dealers | 0.1% (25) | 0.1% (7) | 0.2% (18) |
| Jewelry, luggage, and leather goods stores | 0.1% (21) | 0.1% (14) | 0.1% (7) |
| Furniture and home furnishing merchant wholesalers | 0.1% (15) | 0.1% (15) | 0.0% (0) |
| Paper and paper products merchant wholesalers | 0.1% (15) | 0.1% (15) | 0.0% (0) |
| Textile mills and textile products | 0.1% (13) | 0.1% (13) | 0.0% (0) |
Unemployment in Nampa
- Unemployment by race in 2022
- Unemployment rate for White non-Hispanic residents
- 2.3%Males
- 1.3%Females
- Unemployment rate for Black residents
- 8.7%Females
- Unemployment rate for American Indian and Alaska Native residents
- 0.8%Males
- Unemployment rate for Asian residents
- 25.8%Males
- Unemployment rate for other race residents
- 7.4%Males
- 1.5%Females
- Unemployment rate for two or more race residents
- 2.3%Males
- 0.3%Females
- Unemployment rate for Hispanic or Latino residents
- 3.9%Males
- 2.3%Females
- Unemployment by race in 2000
- Unemployment rate for White non-Hispanic residents
- 5.4%Males
- 6.1%Females
- Unemployment rate for American Indian and Alaska Native residents
- 33.6%Males
- 14.7%Females
- Unemployment rate for Asian residents
- 15.7%Males
- 8.5%Females
- Unemployment rate for other race residents
- 11.8%Males
- 12.3%Females
- Unemployment rate for two or more race residents
- 6.8%Males
- 8.8%Females
- Unemployment rate for Hispanic or Latino residents
- 11.6%Males
- 11.2%Females
Unemployment in 2023:
| Nampa: | 3.5% |
| Idaho: | 3.1% |
Unemployment in 2022:
| Nampa: | 2.9% |
| Idaho: | 2.7% |
Unemployment in 2021:
| Nampa: | 3.8% |
| Idaho: | 3.5% |
Unemployment in 2020:
| Nampa: | 6.1% |
| Idaho: | 5.5% |
Unemployment in 2019:
| Nampa: | 3.2% |
| Idaho: | 2.9% |
Unemployment in 2018:
| Nampa: | 3.1% |
| Idaho: | 2.9% |
Unemployment in 2017:
| Nampa: | 3.7% |
| Idaho: | 3.2% |
Unemployment in 2016:
| Nampa: | 4.2% |
| Idaho: | 3.7% |
Unemployment in 2015:
| Nampa: | 4.6% |
| Idaho: | 3.9% |
Unemployment in 2014:
| Nampa: | 5.2% |
| Idaho: | 4.4% |
Unemployment in 2013:
| Nampa: | 8.3% |
| Idaho: | 6.8% |
Unemployment in 2012:
| Nampa: | 9.4% |
| Idaho: | 7.4% |
Unemployment in 2011:
| Nampa: | 10.7% |
| Idaho: | 8.2% |
Unemployment in 2010:
| Nampa: | 11.2% |
| Idaho: | 8.8% |
Unemployment in 2009:
| Nampa: | 11.5% |
| Idaho: | 8.7% |
Unemployment in 2008:
| Nampa: | 6.3% |
| Idaho: | 5.0% |
Unemployment in 2007:
| Nampa: | 3.6% |
| Idaho: | 3.1% |
Unemployment in 2006:
| Nampa: | 4.2% |
| Idaho: | 3.4% |
Unemployment in 2005:
| Nampa: | 4.8% |
| Idaho: | 4.0% |
Unemployment in 2004:
| Nampa: | 6.1% |
| Idaho: | 4.9% |
Unemployment in 2003:
| Nampa: | 6.9% |
| Idaho: | 5.6% |
Unemployment in 2002:
| Nampa: | 6.8% |
| Idaho: | 5.6% |
Unemployment in 2001:
| Nampa: | 5.6% |
| Idaho: | 5.1% |
Unemployment in 2000:
| Nampa: | 4.9% |
| Idaho: | 4.7% |
Unemployment in 1999:
| Nampa: | 5.0% |
| Idaho: | 5.0% |
Unemployment in 1998:
| Nampa: | 5.5% |
| Idaho: | 5.2% |
Unemployment in 1997:
| Nampa: | 5.8% |
| Idaho: | 5.2% |
Unemployment in 1996:
| Nampa: | 5.9% |
| Idaho: | 5.4% |
Unemployment in 1995:
| Nampa: | 6.2% |
| Idaho: | 5.5% |
Unemployment in 1994:
| Nampa: | 6.2% |
| Idaho: | 5.5% |
Unemployment in 1993:
| Nampa: | 7.0% |
| Idaho: | 6.1% |
Unemployment in 1992:
| Nampa: | 7.3% |
| Idaho: | 6.5% |
Unemployment in 1991:
| Nampa: | 7.8% |
| Idaho: | 6.3% |
Unemployment in 1990:
| Nampa: | 7.0% |
| Idaho: | 5.6% |
Time leaving home to go to work
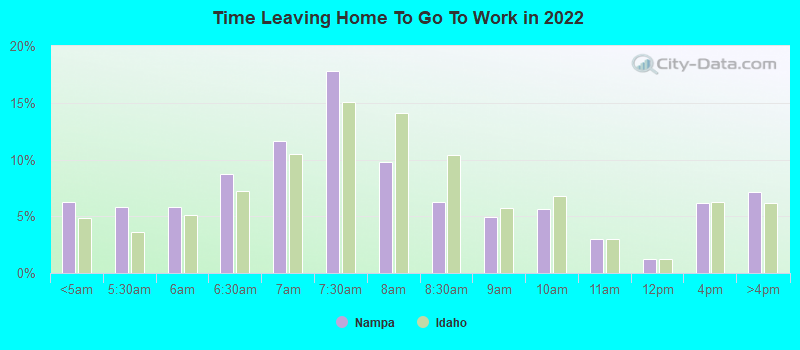
12:00 a.m. to 4:59 a.m.:
| Nampa: | 6.3% (3,161) |
| Idaho: | 4.9% (38,486) |
5:00 a.m. to 5:29 a.m.:
| Nampa: | 5.8% (2,934) |
| Idaho: | 3.6% (28,482) |
5:30 a.m. to 5:59 a.m.:
| Nampa: | 5.8% (2,920) |
| Idaho: | 5.2% (40,793) |
6:00 a.m. to 6:29 a.m.:
| Nampa: | 8.7% (4,389) |
| Idaho: | 7.2% (56,913) |
6:30 a.m. to 6:59 a.m.:
| Nampa: | 11.6% (5,860) |
| Idaho: | 10.5% (82,939) |
7:00 a.m. to 7:29 a.m.:
| Nampa: | 17.8% (8,981) |
| Idaho: | 15.1% (119,470) |
7:30 a.m. to 7:59 a.m.:
| Nampa: | 9.7% (4,919) |
| Idaho: | 14.1% (111,311) |
8:00 a.m. to 8:29 a.m.:
| Nampa: | 6.2% (3,149) |
| Idaho: | 10.4% (82,555) |
8:30 a.m. to 8:59 a.m.:
| Nampa: | 5.0% (2,501) |
| Idaho: | 5.7% (45,319) |
9:00 a.m. to 9:59 a.m.:
| Nampa: | 5.7% (2,865) |
| Idaho: | 6.7% (53,417) |
10:00 a.m. to 10:59 a.m.:
| Nampa: | 3.0% (1,513) |
| Idaho: | 3.0% (24,048) |
11:00 a.m. to 11:59 a.m.:
| Nampa: | 1.2% (611) |
| Idaho: | 1.3% (10,034) |
12:00 p.m. to 3:59 p.m.:
| Nampa: | 6.2% (3,114) |
| Idaho: | 6.2% (49,251) |
4:00 p.m. to 11:59 p.m.:
| Nampa: | 7.1% (3,600) |
| Idaho: | 6.2% (48,708) |

<5am:
| Nampa: | 2.9% (677) |
| Idaho: | 3.0% (17,746) |
5:30am:
| Nampa: | 3.7% (849) |
| Idaho: | 2.6% (15,758) |
6am:
| Nampa: | 4.3% (995) |
| Idaho: | 3.9% (23,486) |
6:30am:
| Nampa: | 6.9% (1,605) |
| Idaho: | 6.7% (40,014) |
7am:
| Nampa: | 12.6% (2,922) |
| Idaho: | 9.9% (58,652) |
7:30am:
| Nampa: | 14.6% (3,387) |
| Idaho: | 13.7% (81,453) |
8am:
| Nampa: | 14.4% (3,342) |
| Idaho: | 17.8% (106,105) |
8:30am:
| Nampa: | 8.3% (1,920) |
| Idaho: | 10.2% (60,766) |
9am:
| Nampa: | 5.6% (1,288) |
| Idaho: | 5.1% (30,303) |
10am:
| Nampa: | 4.4% (1,011) |
| Idaho: | 5.1% (30,263) |
11am:
| Nampa: | 2.7% (630) |
| Idaho: | 2.4% (14,138) |
12pm:
| Nampa: | 0.9% (209) |
| Idaho: | 1.3% (7,838) |
4pm:
| Nampa: | 5.8% (1,345) |
| Idaho: | 6.4% (38,225) |
>4pm:
| Nampa: | 9.0% (2,084) |
| Idaho: | 7.0% (41,894) |

12:00 a.m. to 4:59 a.m. - Males:
| Nampa: | 5.7% (1,617) |
| Idaho: | 6.4% (27,941) |
5:00 a.m. to 5:29 a.m. - Males:
| Nampa: | 8.4% (2,372) |
| Idaho: | 4.4% (19,142) |
5:30 a.m. to 5:59 a.m. - Males:
| Nampa: | 8.0% (2,273) |
| Idaho: | 6.7% (29,205) |
6:00 a.m. to 6:29 a.m. - Males:
| Nampa: | 11.5% (3,242) |
| Idaho: | 9.0% (39,233) |
6:30 a.m. to 6:59 a.m. - Males:
| Nampa: | 11.8% (3,341) |
| Idaho: | 10.9% (47,476) |
7:00 a.m. to 7:29 a.m. - Males:
| Nampa: | 14.8% (4,171) |
| Idaho: | 15.4% (67,430) |
7:30 a.m. to 7:59 a.m. - Males:
| Nampa: | 8.1% (2,290) |
| Idaho: | 12.0% (52,388) |
8:00 a.m. to 8:29 a.m. - Males:
| Nampa: | 6.4% (1,808) |
| Idaho: | 10.2% (44,680) |
8:30 a.m. to 8:59 a.m. - Males:
| Nampa: | 2.5% (708) |
| Idaho: | 4.3% (18,602) |
9:00 a.m. to 9:59 a.m. - Males:
| Nampa: | 5.3% (1,501) |
| Idaho: | 5.7% (25,145) |
10:00 a.m. to 10:59 a.m. - Males:
| Nampa: | 2.9% (817) |
| Idaho: | 2.3% (10,142) |
11:00 a.m. to 11:59 a.m. - Males:
| Nampa: | 0.5% (134) |
| Idaho: | 0.8% (3,676) |
12:00 p.m. to 3:59 p.m. - Males:
| Nampa: | 5.9% (1,672) |
| Idaho: | 6.1% (26,742) |
4:00 p.m. to 11:59 p.m. - Males:
| Nampa: | 8.2% (2,324) |
| Idaho: | 5.9% (25,707) |

12:00 a.m. to 4:59 a.m. - Females:
| Nampa: | 6.9% (1,544) |
| Idaho: | 3.0% (10,545) |
5:00 a.m. to 5:29 a.m. - Females:
| Nampa: | 2.5% (562) |
| Idaho: | 2.6% (9,340) |
5:30 a.m. to 5:59 a.m. - Females:
| Nampa: | 2.9% (647) |
| Idaho: | 3.3% (11,588) |
6:00 a.m. to 6:29 a.m. - Females:
| Nampa: | 5.2% (1,147) |
| Idaho: | 5.0% (17,680) |
6:30 a.m. to 6:59 a.m. - Females:
| Nampa: | 11.3% (2,519) |
| Idaho: | 10.0% (35,463) |
7:00 a.m. to 7:29 a.m. - Females:
| Nampa: | 21.6% (4,810) |
| Idaho: | 14.7% (52,040) |
7:30 a.m. to 7:59 a.m. - Females:
| Nampa: | 11.8% (2,629) |
| Idaho: | 16.6% (58,923) |
8:00 a.m. to 8:29 a.m. - Females:
| Nampa: | 6.0% (1,341) |
| Idaho: | 10.7% (37,875) |
8:30 a.m. to 8:59 a.m. - Females:
| Nampa: | 8.1% (1,793) |
| Idaho: | 7.5% (26,717) |
9:00 a.m. to 9:59 a.m. - Females:
| Nampa: | 6.1% (1,364) |
| Idaho: | 8.0% (28,272) |
10:00 a.m. to 10:59 a.m. - Females:
| Nampa: | 3.1% (696) |
| Idaho: | 3.9% (13,906) |
11:00 a.m. to 11:59 a.m. - Females:
| Nampa: | 2.1% (477) |
| Idaho: | 1.8% (6,358) |
12:00 p.m. to 3:59 p.m. - Females:
| Nampa: | 6.5% (1,442) |
| Idaho: | 6.4% (22,509) |
4:00 p.m. to 11:59 p.m. - Females:
| Nampa: | 5.7% (1,276) |
| Idaho: | 6.5% (23,001) |
Travel time to work
Percentage of workers working in this county: 59.0%
Number of people working at home: 4,938 (9.0% of all workers)
Daytime population change due to commuting: +2,980 (+5.7%)
Workers who live and work in this city: 11,003 (47.5%)
Number of people working at home: 4,938 (9.0% of all workers)
Daytime population change due to commuting: +2,980 (+5.7%)
Workers who live and work in this city: 11,003 (47.5%)

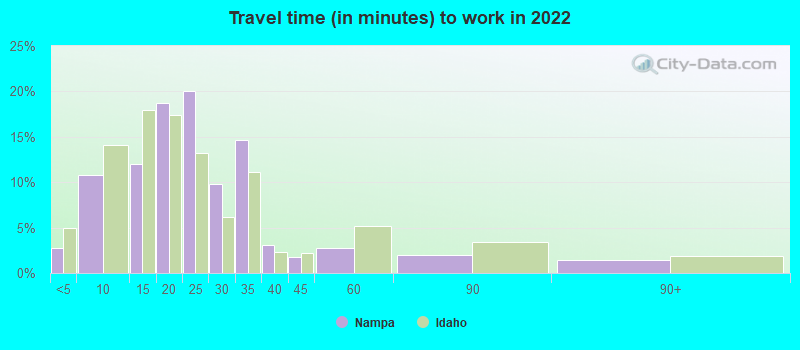

Less than 5 minutes:
| Nampa: | 2.8% (1,349) |
| Idaho: | 5.0% (38,660) |
5 to 9 minutes:
| Nampa: | 10.8% (5,211) |
| Idaho: | 14.1% (109,464) |
10 to 14 minutes:
| Nampa: | 12.0% (5,802) |
| Idaho: | 18.0% (139,208) |
15 to 19 minutes:
| Nampa: | 18.8% (9,031) |
| Idaho: | 17.4% (134,712) |
20 to 24 minutes:
| Nampa: | 20.1% (9,674) |
| Idaho: | 13.2% (102,311) |
25 to 29 minutes:
| Nampa: | 9.8% (4,729) |
| Idaho: | 6.1% (47,344) |
30 to 34 minutes:
| Nampa: | 14.7% (7,062) |
| Idaho: | 11.2% (86,445) |
35 to 39 minutes:
| Nampa: | 3.0% (1,466) |
| Idaho: | 2.3% (17,950) |
40 to 44 minutes:
| Nampa: | 1.8% (857) |
| Idaho: | 2.2% (16,968) |
45 to 59 minutes:
| Nampa: | 2.8% (1,348) |
| Idaho: | 5.2% (40,109) |
60 to 89 minutes:
| Nampa: | 2.0% (944) |
| Idaho: | 3.4% (26,161) |
90 or more minutes:
| Nampa: | 1.4% (686) |
| Idaho: | 1.9% (14,591) |


Less than 5 minutes:
| Nampa: | 3.5% (808) |
| Idaho: | 5.6% (33,498) |
5 to 9 minutes:
| Nampa: | 13.7% (3,174) |
| Idaho: | 16.5% (97,904) |
10 to 14 minutes:
| Nampa: | 17.4% (4,019) |
| Idaho: | 19.2% (114,280) |
15 to 19 minutes:
| Nampa: | 13.1% (3,043) |
| Idaho: | 16.6% (98,780) |
20 to 24 minutes:
| Nampa: | 13.3% (3,071) |
| Idaho: | 12.7% (75,542) |
25 to 29 minutes:
| Nampa: | 7.4% (1,705) |
| Idaho: | 4.2% (25,171) |
30 to 34 minutes:
| Nampa: | 15.8% (3,667) |
| Idaho: | 8.8% (52,220) |
35 to 39 minutes:
| Nampa: | 2.4% (548) |
| Idaho: | 1.3% (7,971) |
40 to 44 minutes:
| Nampa: | 3.0% (687) |
| Idaho: | 1.8% (10,637) |
45 to 59 minutes:
| Nampa: | 4.6% (1,065) |
| Idaho: | 4.0% (23,525) |
60 to 89 minutes:
| Nampa: | 1.0% (228) |
| Idaho: | 2.7% (16,010) |
90 or more minutes:
| Nampa: | 1.1% (249) |
| Idaho: | 1.9% (11,103) |

Less than 5 minutes - Males:
| Nampa: | 3.2% (827) |
| Idaho: | 5.1% (21,549) |
5 to 9 minutes - Males:
| Nampa: | 11.5% (2,966) |
| Idaho: | 12.4% (52,683) |
10 to 14 minutes - Males:
| Nampa: | 9.8% (2,529) |
| Idaho: | 16.1% (68,663) |
15 to 19 minutes - Males:
| Nampa: | 20.3% (5,227) |
| Idaho: | 17.8% (75,582) |
20 to 24 minutes - Males:
| Nampa: | 19.8% (5,083) |
| Idaho: | 12.9% (54,832) |
25 to 29 minutes - Males:
| Nampa: | 9.2% (2,369) |
| Idaho: | 5.9% (24,923) |
30 to 34 minutes - Males:
| Nampa: | 13.4% (3,435) |
| Idaho: | 12.3% (52,425) |
35 to 39 minutes - Males:
| Nampa: | 3.1% (789) |
| Idaho: | 2.5% (10,522) |
40 to 44 minutes - Males:
| Nampa: | 1.8% (460) |
| Idaho: | 2.1% (9,026) |
45 to 59 minutes - Males:
| Nampa: | 4.0% (1,038) |
| Idaho: | 6.2% (26,423) |
60 to 89 minutes - Males:
| Nampa: | 2.4% (605) |
| Idaho: | 4.5% (19,346) |
90 or more minutes - Males:
| Nampa: | 1.4% (358) |
| Idaho: | 2.2% (9,414) |

Less than 5 minutes - Females:
| Nampa: | 2.3% (522) |
| Idaho: | 4.9% (17,111) |
5 to 9 minutes - Females:
| Nampa: | 10.0% (2,245) |
| Idaho: | 16.3% (56,781) |
10 to 14 minutes - Females:
| Nampa: | 14.6% (3,273) |
| Idaho: | 20.2% (70,545) |
15 to 19 minutes - Females:
| Nampa: | 16.9% (3,804) |
| Idaho: | 17.0% (59,130) |
20 to 24 minutes - Females:
| Nampa: | 20.4% (4,591) |
| Idaho: | 13.6% (47,479) |
25 to 29 minutes - Females:
| Nampa: | 10.5% (2,360) |
| Idaho: | 6.4% (22,421) |
30 to 34 minutes - Females:
| Nampa: | 16.1% (3,627) |
| Idaho: | 9.8% (34,020) |
35 to 39 minutes - Females:
| Nampa: | 3.0% (677) |
| Idaho: | 2.1% (7,428) |
40 to 44 minutes - Females:
| Nampa: | 1.8% (397) |
| Idaho: | 2.3% (7,942) |
45 to 59 minutes - Females:
| Nampa: | 1.4% (310) |
| Idaho: | 3.9% (13,686) |
60 to 89 minutes - Females:
| Nampa: | 1.5% (339) |
| Idaho: | 2.0% (6,815) |
90 or more minutes - Females:
| Nampa: | 1.5% (328) |
| Idaho: | 1.5% (5,177) |
Means of transportation to work
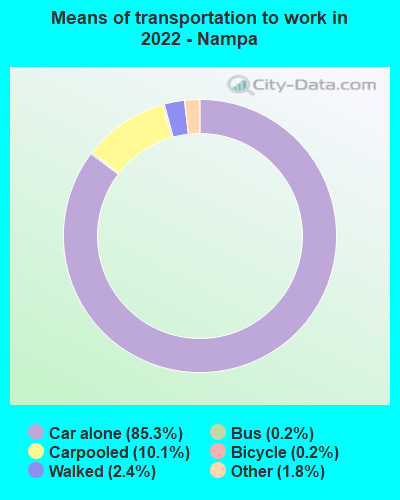

Drove car alone:
| Nampa: | 85.3% (38,335) |
| Idaho: | 83.1% (288,170) |
Carpooled:
| Nampa: | 10.1% (4,562) |
| Idaho: | 10.3% (38,208) |
Bus:
| Nampa: | 0.2% (94) |
| Idaho: | 0.6% (1,985) |
Bicycle:
| Nampa: | 0.2% (100) |
| Idaho: | 0.9% (2,127) |
Walked:
| Nampa: | 2.4% (1,065) |
| Idaho: | 3.4% (13,096) |
Other means:
| Nampa: | 1.8% (790) |
| Idaho: | 1.6% (4,296) |

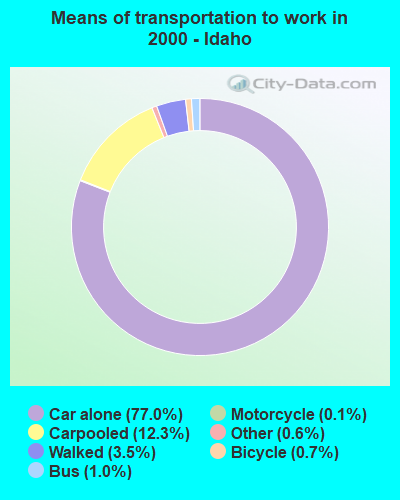
Drove car alone:
| Nampa: | 76.3% (17,671) |
| Idaho: | 77.0% (457,986) |
Carpooled:
| Nampa: | 15.1% (3,496) |
| Idaho: | 12.3% (73,273) |
Bus or trolley bus:
| Nampa: | 0.2% (50) |
| Idaho: | 1.0% (5,908) |
Streetcar or trolley car:
| Nampa: | 0.1% (14) |
| Idaho: | 0.0% (83) |
Railroad:
| Nampa: | 0.0% (7) |
| Idaho: | 0.0% (14) |
Taxicab:
| Nampa: | 0.1% (12) |
| Idaho: | 0.0% (195) |
Motorcycle:
| Nampa: | 0.3% (76) |
| Idaho: | 0.1% (632) |
Bicycle:
| Nampa: | 0.8% (182) |
| Idaho: | 0.7% (3,942) |
Walked:
| Nampa: | 2.5% (588) |
| Idaho: | 3.5% (20,747) |
Other means:
| Nampa: | 0.7% (168) |
| Idaho: | 0.6% (3,786) |

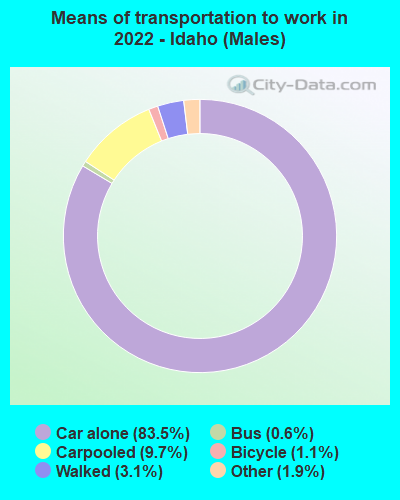
Drove car alone - Males:
| Nampa: | 83.9% (19,566) |
| Idaho: | 83.5% (288,170) |
Carpooled - Males:
| Nampa: | 10.4% (2,418) |
| Idaho: | 9.7% (38,208) |
Bus - Males:
| Nampa: | 0.1% (12) |
| Idaho: | 0.6% (1,985) |
Bicycle - Males:
| Nampa: | 0.3% (81) |
| Idaho: | 1.1% (2,127) |
Walked - Males:
| Nampa: | 2.4% (556) |
| Idaho: | 3.1% (13,096) |
Other means - Males:
| Nampa: | 3.0% (701) |
| Idaho: | 1.9% (4,296) |


Drove car alone - Females:
| Nampa: | 86.9% (18,775) |
| Idaho: | 82.7% (288,170) |
Carpooled - Females:
| Nampa: | 9.9% (2,143) |
| Idaho: | 11.0% (38,208) |
Bus - Females:
| Nampa: | 0.4% (82) |
| Idaho: | 0.6% (1,985) |
Bicycle - Females:
| Nampa: | 0.1% (19) |
| Idaho: | 0.6% (2,127) |
Walked - Females:
| Nampa: | 2.4% (509) |
| Idaho: | 3.8% (13,096) |
Other means - Females:
| Nampa: | 0.4% (88) |
| Idaho: | 1.2% (4,296) |
Private vehicle occupancy

Drove alone:
| Nampa: | 86.9% (40,179) |
| Idaho: | 89.2% (659,710) |
In 2 person carpool:
| Nampa: | 8.9% (4,134) |
| Idaho: | 7.6% (56,069) |
In 3 person carpool:
| Nampa: | 2.6% (1,184) |
| Idaho: | 1.9% (13,960) |
In 4 person carpool:
| Nampa: | 0.6% (300) |
| Idaho: | 0.7% (4,987) |
In 5-6 person carpool:
| Nampa: | 0.6% (277) |
| Idaho: | 0.5% (3,685) |
In 7+ person carpool:
| Nampa: | 0.0% (21) |
| Idaho: | 0.2% (1,158) |

Drove alone:
| Nampa: | 83.5% (17,671) |
| Idaho: | 86.2% (457,986) |
In 2 person carpool:
| Nampa: | 12.6% (2,675) |
| Idaho: | 10.9% (57,673) |
In 3 person carpool:
| Nampa: | 2.1% (444) |
| Idaho: | 1.9% (10,359) |
In 4 person carpool:
| Nampa: | 0.8% (176) |
| Idaho: | 0.6% (3,259) |
In 5-6 person carpool:
| Nampa: | 0.6% (122) |
| Idaho: | 0.2% (1,320) |
In 7+ person carpool:
| Nampa: | 0.4% (79) |
| Idaho: | 0.1% (662) |
Class of workers
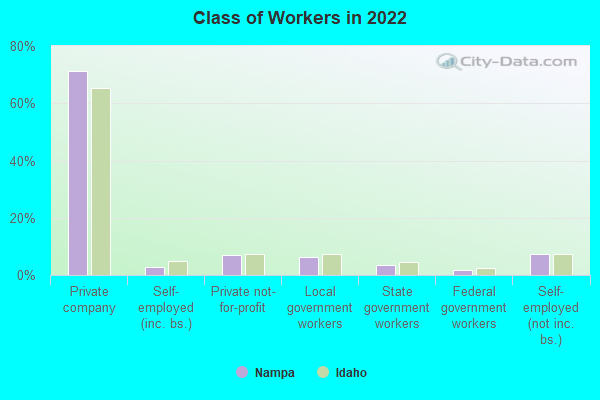
Employee of private company:
| Nampa: | 71.1% (41,325) |
| Idaho: | 65.4% (602,553) |
Self-employed in own incorporated business:
| Nampa: | 2.9% (1,659) |
| Idaho: | 5.1% (46,572) |
Private not-for-profit wage and salary workers:
| Nampa: | 6.9% (3,996) |
| Idaho: | 7.4% (68,554) |
Local government workers:
| Nampa: | 6.3% (3,635) |
| Idaho: | 7.2% (66,734) |
State government workers:
| Nampa: | 3.5% (2,039) |
| Idaho: | 4.7% (43,034) |
Federal government workers:
| Nampa: | 1.8% (1,073) |
| Idaho: | 2.5% (22,697) |
Self-employed workers in own not incorporated business:
| Nampa: | 7.5% (4,361) |
| Idaho: | 7.5% (69,152) |

Employee of private company:
| Nampa: | 72.3% (16,933) |
| Idaho: | 64.3% (385,183) |
Self-employed in own incorporated business:
| Nampa: | 2.3% (545) |
| Idaho: | 3.8% (22,846) |
Private not-for-profit wage and salary workers:
| Nampa: | 5.9% (1,390) |
| Idaho: | 5.8% (34,500) |
Local government workers:
| Nampa: | 5.6% (1,303) |
| Idaho: | 6.5% (39,078) |
State government workers:
| Nampa: | 5.1% (1,189) |
| Idaho: | 6.7% (40,017) |
Federal government workers:
| Nampa: | 1.8% (418) |
| Idaho: | 3.2% (18,994) |
Self-employed workers in own not incorporated business:
| Nampa: | 6.7% (1,563) |
| Idaho: | 9.3% (56,018) |
Unpaid family workers:
| Nampa: | 0.4% (84) |
| Idaho: | 0.5% (2,817) |

Employee of private company - Males:
| Nampa: | 75.0% (23,348) |
| Idaho: | 69.5% (346,347) |
Self-employed in own incorporated business - Males:
| Nampa: | 4.4% (1,369) |
| Idaho: | 6.1% (30,431) |
Private not-for-profit wage and salary workers - Males:
| Nampa: | 4.0% (1,244) |
| Idaho: | 5.1% (25,377) |
Local government workers - Males:
| Nampa: | 4.2% (1,316) |
| Idaho: | 5.2% (25,672) |
State government workers - Males:
| Nampa: | 2.4% (759) |
| Idaho: | 3.5% (17,440) |
Federal government workers - Males:
| Nampa: | 1.8% (562) |
| Idaho: | 2.8% (13,794) |
Self-employed workers in own not incorporated business - Males:
| Nampa: | 8.2% (2,538) |
| Idaho: | 7.7% (38,562) |

Employee of private company - Females:
| Nampa: | 66.7% (17,977) |
| Idaho: | 60.6% (256,206) |
Self-employed in own incorporated business - Females:
| Nampa: | 1.1% (290) |
| Idaho: | 3.8% (16,141) |
Private not-for-profit wage and salary workers - Females:
| Nampa: | 10.2% (2,752) |
| Idaho: | 10.2% (43,177) |
Local government workers - Females:
| Nampa: | 8.6% (2,319) |
| Idaho: | 9.7% (41,062) |
State government workers - Females:
| Nampa: | 4.7% (1,280) |
| Idaho: | 6.1% (25,594) |
Federal government workers - Females:
| Nampa: | 1.9% (511) |
| Idaho: | 2.1% (8,903) |
Self-employed workers in own not incorporated business - Females:
| Nampa: | 6.8% (1,823) |
| Idaho: | 7.2% (30,590) |