Work and Jobs in Neilton, Washington (WA) Detailed Stats
Occupations, Industries, Unemployment, Workers, Commute
Settings
X


Recent posts about work in Neilton, Washington on our local forum with over 2,400,000 registered users:
 | Looking For A Small Town in the Olympic Forrest Region (6 replies) |
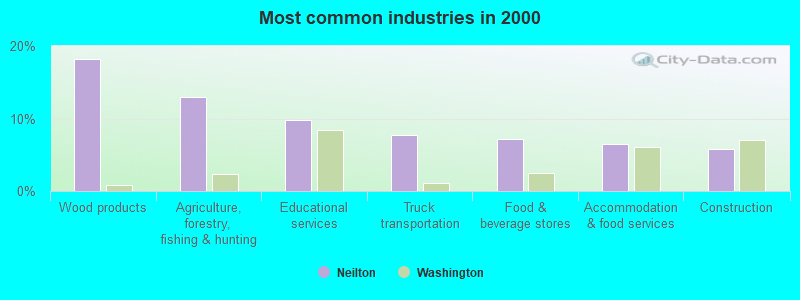
The most common industries in Neilton are: Wood products (18.2% of civilian employees), Agriculture, forestry, fishing & hunting (13.0% of civilian employees), Educational services (9.7% of civilian employees). 89.2% of workers work in Grays Harbor County. 74.8% of workers are employees of private companies, which is 11.7% greater than the rate of 66.0% across the entire state of Washington.
Whole page based on the data from 2000 / 2022 when the population of Neilton, Washington was 345 / 283
Whole page based on the data from 2000 / 2022 when the population of Neilton, Washington was 345 / 283
Most common industries
Most common industries | |||
|---|---|---|---|
Industry | All | Males | Females |
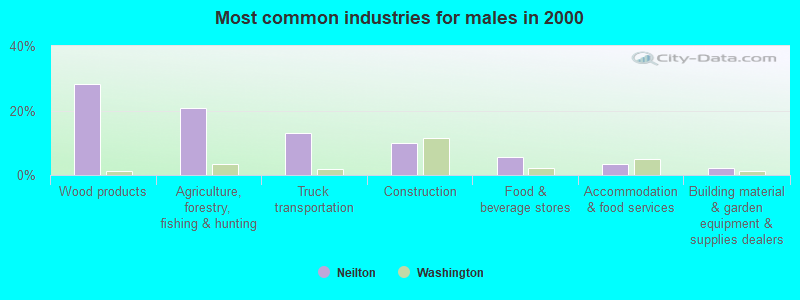
| Wood products | 18.2% (28) | 28.3% (26) | 3.2% (2) |
| Agriculture, forestry, fishing and hunting | 13.0% (20) | 20.7% (19) | 1.6% (1) |
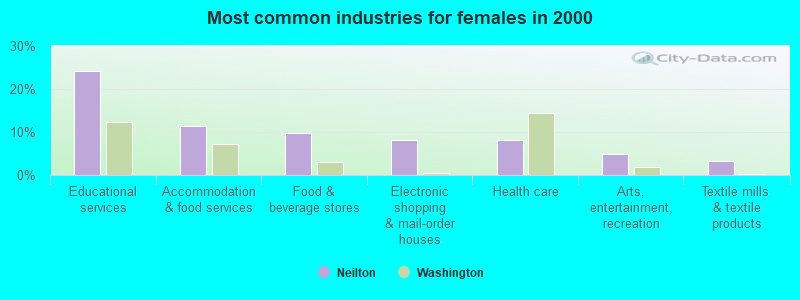
| Educational services | 9.7% (15) | 0.0% (0) | 24.2% (15) |
| Truck transportation | 7.8% (12) | 13.0% (12) | 0.0% (0) |
| Food and beverage stores | 7.1% (11) | 5.4% (5) | 9.7% (6) |
| Accommodation and food services | 6.5% (10) | 3.3% (3) | 11.3% (7) |
| Construction | 5.8% (9) | 9.8% (9) | 0.0% (0) |
| Arts, entertainment, and recreation | 3.2% (5) | 2.2% (2) | 4.8% (3) |
| Health care | 3.2% (5) | 0.0% (0) | 8.1% (5) |
| Electronic shopping and mail-order houses | 3.2% (5) | 0.0% (0) | 8.1% (5) |
| Textile mills and textile products | 2.6% (4) | 2.2% (2) | 3.2% (2) |
| Building material and garden equipment and supplies dealers | 2.6% (4) | 2.2% (2) | 3.2% (2) |
| Public administration | 2.6% (4) | 2.2% (2) | 3.2% (2) |
| Department and other general merchandise stores | 1.3% (2) | 2.2% (2) | 0.0% (0) |
| Used merchandise, gift, novelty, and souvenir, and other miscellaneous stores | 1.3% (2) | 0.0% (0) | 3.2% (2) |
| Professional, scientific, and technical services | 1.3% (2) | 0.0% (0) | 3.2% (2) |
| Administrative and support and waste management services | 1.3% (2) | 0.0% (0) | 3.2% (2) |
| Recyclable material merchant wholesalers | 1.3% (2) | 2.2% (2) | 0.0% (0) |
| Social assistance | 1.3% (2) | 0.0% (0) | 3.2% (2) |
| Repair and maintenance | 1.3% (2) | 2.2% (2) | 0.0% (0) |
| Religious, grantmaking, civic, professional, and similar organizations | 1.3% (2) | 0.0% (0) | 3.2% (2) |
| Private households | 1.3% (2) | 2.2% (2) | 0.0% (0) |
| Petroleum and petroleum products merchant wholesalers | 1.3% (2) | 2.2% (2) | 0.0% (0) |
| Metal and metal products | 1.3% (2) | 0.0% (0) | 3.2% (2) |
Unemployment in Neilton
- Unemployment by race in 2000
- Unemployment rate for White non-Hispanic residents
- 10.2%Males
- 6.2%Females
Time leaving home to go to work

12:00 a.m. to 4:59 a.m.:
| Neilton: | 17.7% (17) |
| Washington: | 7.0% (213,920) |
5:30 a.m. to 5:59 a.m.:
| Neilton: | 22.9% (21) |
| Washington: | 6.1% (185,330) |
6:30 a.m. to 6:59 a.m.:
| Neilton: | 15.9% (15) |
| Washington: | 9.1% (277,560) |
7:00 a.m. to 7:29 a.m.:
| Neilton: | 14.9% (14) |
| Washington: | 12.7% (387,691) |
7:30 a.m. to 7:59 a.m.:
| Neilton: | 4.5% (4) |
| Washington: | 11.0% (335,322) |
12:00 p.m. to 3:59 p.m.:
| Neilton: | 29.4% (28) |
| Washington: | 6.7% (205,284) |

<5am:
| Neilton: | 3.9% (6) |
| Washington: | 4.2% (115,997) |
5:30am:
| Neilton: | 5.2% (8) |
| Washington: | 3.7% (102,868) |
6am:
| Neilton: | 5.8% (9) |
| Washington: | 5.3% (147,812) |
6:30am:
| Neilton: | 17.5% (27) |
| Washington: | 8.9% (248,462) |
7am:
| Neilton: | 9.1% (14) |
| Washington: | 10.3% (288,005) |
7:30am:
| Neilton: | 16.9% (26) |
| Washington: | 13.5% (375,030) |
8am:
| Neilton: | 10.4% (16) |
| Washington: | 13.4% (372,576) |
8:30am:
| Neilton: | 1.3% (2) |
| Washington: | 9.0% (252,058) |
9am:
| Neilton: | 6.5% (10) |
| Washington: | 5.1% (141,936) |
10am:
| Neilton: | 1.9% (3) |
| Washington: | 5.8% (161,204) |
11am:
| Neilton: | 3.9% (6) |
| Washington: | 2.5% (70,123) |
12pm:
| Neilton: | 1.3% (2) |
| Washington: | 1.3% (35,612) |
4pm:
| Neilton: | 13.6% (21) |
| Washington: | 6.8% (190,565) |

5:30 a.m. to 5:59 a.m. - Males:
| Neilton: | 44.8% (28) |
| Washington: | 7.1% (120,772) |
6:30 a.m. to 6:59 a.m. - Males:
| Neilton: | 14.1% (9) |
| Washington: | 9.3% (158,128) |
12:00 p.m. to 3:59 p.m. - Males:
| Neilton: | 37.4% (23) |
| Washington: | 6.8% (115,643) |

12:00 a.m. to 4:59 a.m. - Females:
| Neilton: | 56.7% (18) |
| Washington: | 4.1% (55,404) |
6:30 a.m. to 6:59 a.m. - Females:
| Neilton: | 12.8% (4) |
| Washington: | 8.8% (119,432) |
7:00 a.m. to 7:29 a.m. - Females:
| Neilton: | 44.6% (14) |
| Washington: | 13.9% (188,971) |
7:30 a.m. to 7:59 a.m. - Females:
| Neilton: | 11.0% (4) |
| Washington: | 12.7% (172,422) |
Travel time to work
Percentage of workers working in this county: 89.2%


Less than 5 minutes:
| Neilton: | 4.5% (7) |
| Washington: | 3.3% (91,132) |
5 to 9 minutes:
| Neilton: | 13.6% (21) |
| Washington: | 10.3% (286,517) |
10 to 14 minutes:
| Neilton: | 11.0% (17) |
| Washington: | 14.1% (391,606) |
15 to 19 minutes:
| Neilton: | 11.7% (18) |
| Washington: | 15.0% (418,990) |
20 to 24 minutes:
| Neilton: | 13.0% (20) |
| Washington: | 14.2% (394,209) |
30 to 34 minutes:
| Neilton: | 8.4% (13) |
| Washington: | 12.5% (348,311) |
35 to 39 minutes:
| Neilton: | 3.9% (6) |
| Washington: | 2.6% (73,592) |
40 to 44 minutes:
| Neilton: | 1.9% (3) |
| Washington: | 3.4% (95,182) |
45 to 59 minutes:
| Neilton: | 9.7% (15) |
| Washington: | 7.0% (195,343) |
60 to 89 minutes:
| Neilton: | 14.3% (22) |
| Washington: | 4.7% (131,691) |
90 or more minutes:
| Neilton: | 5.2% (8) |
| Washington: | 2.7% (75,486) |
Means of transportation to work


Drove car alone:
| Neilton: | 70.1% (108) |
| Washington: | 73.3% (2,040,833) |
Carpooled:
| Neilton: | 16.2% (25) |
| Washington: | 12.8% (357,742) |
Bus or trolley bus:
| Neilton: | 4.5% (7) |
| Washington: | 4.5% (124,450) |
Walked:
| Neilton: | 3.2% (5) |
| Washington: | 3.2% (89,739) |
Other means:
| Neilton: | 3.2% (5) |
| Washington: | 0.7% (19,499) |
Private vehicle occupancy

Drove alone:
| Neilton: | 95.4% (88) |
| Washington: | 87.8% (2,415,775) |
In 2 person carpool:
| Neilton: | 4.4% (4) |
| Washington: | 9.2% (252,715) |

Drove alone:
| Neilton: | 81.2% (108) |
| Washington: | 85.1% (2,040,833) |
In 2 person carpool:
| Neilton: | 13.5% (18) |
| Washington: | 11.8% (282,638) |
In 3 person carpool:
| Neilton: | 4.5% (6) |
| Washington: | 1.9% (44,791) |
In 4 person carpool:
| Neilton: | 0.8% (1) |
| Washington: | 0.6% (14,195) |
Class of workers

Employee of private company:
| Neilton: | 74.8% (78) |
| Washington: | 66.0% (2,552,907) |
Local government workers:
| Neilton: | 10.7% (11) |
| Washington: | 7.3% (281,034) |
State government workers:
| Neilton: | 8.7% (9) |
| Washington: | 5.2% (201,670) |
Self-employed workers in own not incorporated business:
| Neilton: | 5.8% (6) |
| Washington: | 5.5% (212,937) |

Employee of private company:
| Neilton: | 64.3% (99) |
| Washington: | 66.0% (1,843,000) |
Self-employed in own incorporated business:
| Neilton: | 9.7% (15) |
| Washington: | 3.2% (90,102) |
Private not-for-profit wage and salary workers:
| Neilton: | 3.9% (6) |
| Washington: | 6.9% (191,927) |
Local government workers:
| Neilton: | 2.6% (4) |
| Washington: | 6.4% (178,161) |
State government workers:
| Neilton: | 7.1% (11) |
| Washington: | 6.9% (192,408) |
Federal government workers:
| Neilton: | 3.2% (5) |
| Washington: | 3.2% (89,153) |
Self-employed workers in own not incorporated business:
| Neilton: | 9.1% (14) |
| Washington: | 7.2% (199,827) |

Employee of private company - Males:
| Neilton: | 91.7% (67) |
| Washington: | 71.1% (1,491,511) |
Self-employed workers in own not incorporated business - Males:
| Neilton: | 8.3% (6) |
| Washington: | 5.4% (113,810) |

Employee of private company - Females:
| Neilton: | 35.5% (11) |
| Washington: | 60.0% (1,061,396) |
Local government workers - Females:
| Neilton: | 35.5% (11) |
| Washington: | 9.4% (167,001) |
State government workers - Females:
| Neilton: | 29.0% (9) |
| Washington: | 6.6% (116,701) |