Work and Jobs in New Castle, New York (NY) Detailed Stats
Occupations, Industries, Unemployment, Workers, Commute
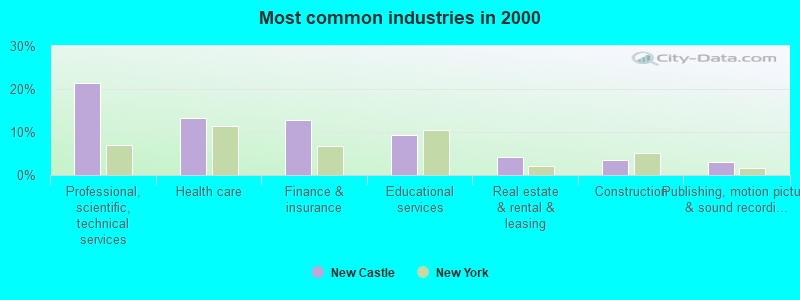
The most common industries in New Castle are: Professional, scientific, technical services (21.4% of civilian employees), Health care (13.2% of civilian employees), Finance & insurance (12.7% of civilian employees). 55.8% of workers are employees of private companies, which is 14.1% less than the rate of 63.7% across the entire state of New York.
Most common industries
Most common industries | |||
|---|---|---|---|
Industry | All | Males | Females |
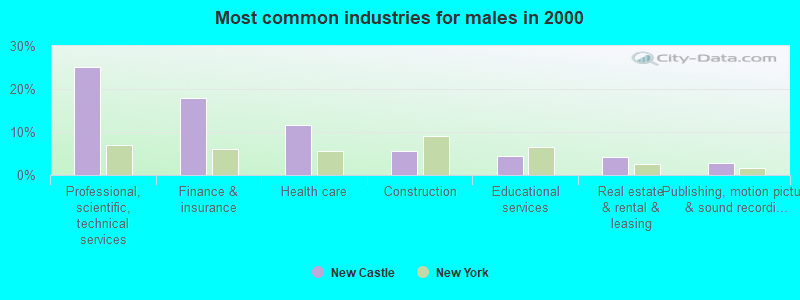
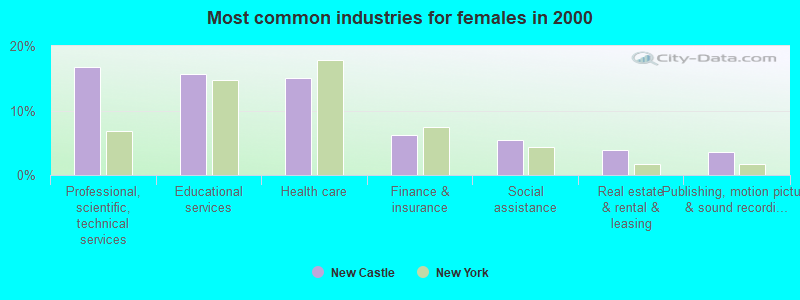
| Professional, scientific, and technical services | 21.4% (1,804) | 25.1% (1,180) | 16.7% (624) |
| Health care | 13.2% (1,112) | 11.7% (551) | 15.0% (561) |
| Finance and insurance | 12.7% (1,070) | 17.9% (839) | 6.2% (231) |
| Educational services | 9.4% (793) | 4.4% (208) | 15.7% (585) |
| Real estate and rental and leasing | 4.1% (345) | 4.3% (200) | 3.9% (145) |
| Construction | 3.5% (298) | 5.6% (262) | 1.0% (36) |
| Publishing, and motion picture and sound recording industries | 3.1% (263) | 2.7% (129) | 3.6% (134) |
| Social assistance | 2.5% (210) | 0.2% (10) | 5.4% (200) |
| Arts, entertainment, and recreation | 2.2% (188) | 1.7% (78) | 2.9% (110) |
| Computer and electronic products | 2.0% (171) | 2.1% (98) | 2.0% (73) |
| Broadcasting and telecommunications | 1.9% (159) | 2.2% (101) | 1.6% (58) |
| Religious, grantmaking, civic, professional, and similar organizations | 1.6% (136) | 1.2% (57) | 2.1% (79) |
| Accommodation and food services | 1.5% (130) | 1.0% (46) | 2.3% (84) |
| Public administration | 1.5% (124) | 1.5% (70) | 1.4% (54) |
| Administrative and support and waste management services | 1.3% (108) | 1.1% (50) | 1.6% (58) |
| Private households | 1.1% (91) | 0.0% (0) | 2.4% (91) |
| Chemicals | 0.8% (71) | 1.1% (50) | 0.6% (21) |
| Data processing, libraries, and other information services | 0.8% (71) | 0.6% (29) | 1.1% (42) |
| Radio, TV, and computer stores | 0.7% (62) | 0.9% (41) | 0.6% (21) |
| Clothing and accessories, including shoe, stores | 0.7% (62) | 0.4% (21) | 1.1% (41) |
| Miscellaneous durable goods merchant wholesalers | 0.7% (59) | 1.1% (50) | 0.2% (9) |
| Other transportation, and support activities, and couriers | 0.7% (56) | 0.9% (41) | 0.4% (15) |
| Printing and related support activities | 0.6% (53) | 0.6% (26) | 0.7% (27) |
| Groceries and related products merchant wholesalers | 0.6% (53) | 0.7% (35) | 0.5% (18) |
| Machinery | 0.6% (48) | 0.5% (23) | 0.7% (25) |
| Personal and laundry services | 0.6% (48) | 0.3% (14) | 0.9% (34) |
| Apparel | 0.5% (40) | 0.5% (25) | 0.4% (15) |
| Other direct selling establishments | 0.5% (40) | 0.5% (24) | 0.4% (16) |
| Motor vehicle and parts dealers | 0.4% (36) | 0.4% (19) | 0.5% (17) |
| Food | 0.4% (35) | 0.2% (8) | 0.7% (27) |
| Repair and maintenance | 0.4% (34) | 0.6% (26) | 0.2% (8) |
| Jewelry, luggage, and leather goods stores | 0.4% (33) | 0.3% (15) | 0.5% (18) |
| Miscellaneous manufacturing | 0.4% (31) | 0.1% (7) | 0.6% (24) |
| Furniture and home furnishings, and household appliance stores | 0.4% (31) | 0.3% (14) | 0.5% (17) |
| Health and personal care, except drug, stores | 0.4% (31) | 0.3% (12) | 0.5% (19) |
| Truck transportation | 0.4% (30) | 0.4% (21) | 0.2% (9) |
| Used merchandise, gift, novelty, and souvenir, and other miscellaneous stores | 0.3% (28) | 0.3% (15) | 0.3% (13) |
| Electronic shopping and mail-order houses | 0.3% (27) | 0.4% (20) | 0.2% (7) |
| Food and beverage stores | 0.3% (27) | 0.4% (21) | 0.2% (6) |
| Miscellaneous nondurable goods merchant wholesalers | 0.3% (27) | 0.5% (22) | 0.1% (5) |
| Nonmetallic mineral products | 0.3% (25) | 0.5% (25) | 0.0% (0) |
| Professional and commercial equipment and supplies merchant wholesalers | 0.3% (24) | 0.4% (18) | 0.2% (6) |
| Electrical and electronic goods merchant wholesalers | 0.3% (24) | 0.5% (24) | 0.0% (0) |
| Book stores and news dealers | 0.3% (22) | 0.4% (17) | 0.1% (5) |
| Building material and garden equipment and supplies dealers | 0.3% (22) | 0.5% (22) | 0.0% (0) |
| Electrical equipment, appliances, and components | 0.2% (18) | 0.0% (0) | 0.5% (18) |
| Petroleum and petroleum products merchant wholesalers | 0.2% (17) | 0.0% (0) | 0.5% (17) |
| Department and other general merchandise stores | 0.2% (17) | 0.0% (0) | 0.5% (17) |
| Textile mills and textile products | 0.2% (17) | 0.4% (17) | 0.0% (0) |
| Sporting goods, camera, and hobby and toy stores | 0.2% (15) | 0.0% (0) | 0.4% (15) |
| Lumber and other construction materials merchant wholesalers | 0.2% (15) | 0.1% (6) | 0.2% (9) |
| Beverage and tobacco products | 0.2% (15) | 0.2% (8) | 0.2% (7) |
| Apparel, fabrics, and notions merchant wholesalers | 0.2% (13) | 0.2% (8) | 0.1% (5) |
| Sewing, needlework, and piece goods stores | 0.1% (12) | 0.0% (0) | 0.3% (12) |
| Office supplies and stationery stores | 0.1% (12) | 0.0% (0) | 0.3% (12) |
| Plastics and rubber products | 0.1% (12) | 0.0% (0) | 0.3% (12) |
| Paper | 0.1% (12) | 0.3% (12) | 0.0% (0) |
| Alcoholic beverages merchant wholesalers | 0.1% (12) | 0.1% (7) | 0.1% (5) |
| Pharmacies and drug stores | 0.1% (11) | 0.2% (11) | 0.0% (0) |
| Machinery, equipment, and supplies merchant wholesalers | 0.1% (10) | 0.2% (10) | 0.0% (0) |
| Air transportation | 0.1% (9) | 0.0% (0) | 0.2% (9) |
| Hardware, plumbing and heating equipment, and supplies merchant wholesalers | 0.1% (8) | 0.2% (8) | 0.0% (0) |
| Management of companies and enterprises | 0.1% (7) | 0.1% (7) | 0.0% (0) |
| Furniture and home furnishing merchant wholesalers | 0.1% (6) | 0.1% (6) | 0.0% (0) |
| Furniture and related product manufacturing | 0.1% (6) | 0.1% (6) | 0.0% (0) |
| Motor vehicles, parts and supplies merchant wholesalers | 0.1% (6) | 0.1% (6) | 0.0% (0) |
| Music stores | 0.1% (5) | 0.1% (5) | 0.0% (0) |
| Drugs, sundries, and chemical and allied products merchant wholesalers | 0.1% (5) | 0.1% (5) | 0.0% (0) |
| Metal and metal products | 0.1% (5) | 0.1% (5) | 0.0% (0) |
Unemployment in New Castle
- Unemployment by race in 2000
- Unemployment rate for White non-Hispanic residents
- 1.0%Males
- 2.3%Females
- Unemployment rate for Asian residents
- 2.3%Males
- 7.9%Females
- Unemployment rate for two or more race residents
- 6.0%Males
- Unemployment rate for Hispanic or Latino residents
- 9.5%Males
- 9.8%Females
Time leaving home to go to work

<5am:
| New Castle: | 0.6% (51) |
| New York: | 2.4% (194,562) |
5:30am:
| New Castle: | 1.2% (97) |
| New York: | 2.1% (174,328) |
6am:
| New Castle: | 1.2% (98) |
| New York: | 3.1% (253,826) |
6:30am:
| New Castle: | 5.3% (437) |
| New York: | 7.0% (573,349) |
7am:
| New Castle: | 9.2% (763) |
| New York: | 8.6% (706,982) |
7:30am:
| New Castle: | 17.9% (1,490) |
| New York: | 14.0% (1,147,579) |
8am:
| New Castle: | 15.4% (1,281) |
| New York: | 14.8% (1,213,706) |
8:30am:
| New Castle: | 15.8% (1,313) |
| New York: | 13.9% (1,144,298) |
9am:
| New Castle: | 8.4% (694) |
| New York: | 7.5% (614,475) |
10am:
| New Castle: | 10.2% (850) |
| New York: | 7.2% (593,377) |
11am:
| New Castle: | 3.2% (264) |
| New York: | 2.7% (224,011) |
12pm:
| New Castle: | 0.7% (58) |
| New York: | 1.3% (105,049) |
4pm:
| New Castle: | 2.6% (220) |
| New York: | 6.3% (517,309) |
>4pm:
| New Castle: | 1.1% (91) |
| New York: | 6.1% (501,196) |
Travel time to work


Less than 5 minutes:
| New Castle: | 2.2% (181) |
| New York: | 2.7% (219,036) |
5 to 9 minutes:
| New Castle: | 5.9% (489) |
| New York: | 8.3% (680,270) |
10 to 14 minutes:
| New Castle: | 8.2% (681) |
| New York: | 11.6% (956,590) |
15 to 19 minutes:
| New Castle: | 8.0% (667) |
| New York: | 12.4% (1,020,084) |
20 to 24 minutes:
| New Castle: | 9.7% (803) |
| New York: | 12.3% (1,013,757) |
25 to 29 minutes:
| New Castle: | 4.3% (356) |
| New York: | 4.9% (399,384) |
30 to 34 minutes:
| New Castle: | 9.0% (745) |
| New York: | 12.9% (1,058,688) |
35 to 39 minutes:
| New Castle: | 3.4% (285) |
| New York: | 2.5% (203,722) |
40 to 44 minutes:
| New Castle: | 2.7% (223) |
| New York: | 4.1% (340,311) |
45 to 59 minutes:
| New Castle: | 7.4% (613) |
| New York: | 9.8% (806,556) |
60 to 89 minutes:
| New Castle: | 21.4% (1,774) |
| New York: | 10.3% (848,185) |
90 or more minutes:
| New Castle: | 10.7% (890) |
| New York: | 5.1% (417,464) |
Means of transportation to work


Drove car alone:
| New Castle: | 61.2% (5,086) |
| New York: | 56.3% (4,620,178) |
Carpooled:
| New Castle: | 5.2% (435) |
| New York: | 9.2% (756,918) |
Bus or trolley bus:
| New Castle: | 0.1% (9) |
| New York: | 5.8% (475,389) |
Subway or elevated:
| New Castle: | 0.7% (59) |
| New York: | 14.8% (1,217,009) |
Railroad:
| New Castle: | 24.4% (2,025) |
| New York: | 2.8% (228,215) |
Ferryboat:
| New Castle: | 0.1% (8) |
| New York: | 0.1% (11,626) |
Bicycle:
| New Castle: | 0.1% (5) |
| New York: | 0.3% (25,036) |
Walked:
| New Castle: | 0.5% (41) |
| New York: | 6.2% (511,721) |
Other means:
| New Castle: | 0.5% (39) |
| New York: | 0.5% (40,375) |
Private vehicle occupancy

Drove alone:
| New Castle: | 92.1% (5,086) |
| New York: | 85.9% (4,620,178) |
In 2 person carpool:
| New Castle: | 7.2% (395) |
| New York: | 11.0% (590,255) |
In 3 person carpool:
| New Castle: | 0.6% (31) |
| New York: | 1.8% (96,470) |
In 7+ person carpool:
| New Castle: | 0.2% (9) |
| New York: | 0.3% (17,437) |
Class of workers
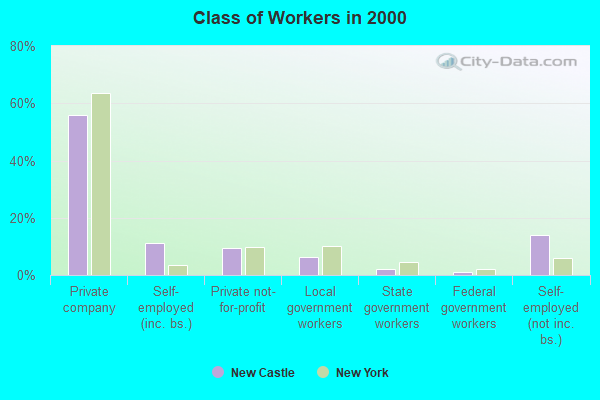
Employee of private company:
| New Castle: | 55.8% (4,705) |
| New York: | 63.7% (5,340,134) |
Self-employed in own incorporated business:
| New Castle: | 11.1% (936) |
| New York: | 3.4% (283,619) |
Private not-for-profit wage and salary workers:
| New Castle: | 9.6% (807) |
| New York: | 9.7% (810,356) |
Local government workers:
| New Castle: | 6.2% (521) |
| New York: | 10.2% (858,120) |
State government workers:
| New Castle: | 1.9% (164) |
| New York: | 4.6% (383,673) |
Federal government workers:
| New Castle: | 0.9% (80) |
| New York: | 2.2% (185,100) |
Self-employed workers in own not incorporated business:
| New Castle: | 14.0% (1,180) |
| New York: | 6.0% (501,068) |
Unpaid family workers:
| New Castle: | 0.4% (33) |
| New York: | 0.2% (20,918) |

Employee of private company - Males:
| New Castle: | 56.7% (2,660) |
| New York: | 66.2% (2,902,064) |
Self-employed in own incorporated business - Males:
| New Castle: | 16.2% (759) |
| New York: | 4.9% (215,651) |
Private not-for-profit wage and salary workers - Males:
| New Castle: | 7.3% (341) |
| New York: | 6.3% (277,787) |
Local government workers - Males:
| New Castle: | 2.6% (121) |
| New York: | 8.7% (380,426) |
State government workers - Males:
| New Castle: | 1.0% (47) |
| New York: | 4.1% (181,784) |
Federal government workers - Males:
| New Castle: | 1.3% (59) |
| New York: | 2.3% (102,647) |
Self-employed workers in own not incorporated business - Males:
| New Castle: | 14.6% (684) |
| New York: | 7.1% (312,497) |
Unpaid family workers - Males:
| New Castle: | 0.5% (24) |
| New York: | 0.2% (9,470) |

Employee of private company - Females:
| New Castle: | 54.8% (2,045) |
| New York: | 60.9% (2,438,070) |
Self-employed in own incorporated business - Females:
| New Castle: | 4.7% (177) |
| New York: | 1.7% (67,968) |
Private not-for-profit wage and salary workers - Females:
| New Castle: | 12.5% (466) |
| New York: | 13.3% (532,569) |
Local government workers - Females:
| New Castle: | 10.7% (400) |
| New York: | 11.9% (477,694) |
State government workers - Females:
| New Castle: | 3.1% (117) |
| New York: | 5.0% (201,889) |
Federal government workers - Females:
| New Castle: | 0.6% (21) |
| New York: | 2.1% (82,453) |
Self-employed workers in own not incorporated business - Females:
| New Castle: | 13.3% (496) |
| New York: | 4.7% (188,571) |
Unpaid family workers - Females:
| New Castle: | 0.2% (9) |
| New York: | 0.3% (11,448) |