Work and Jobs in Newhall, California (CA) Detailed Stats
Occupations, Industries, Unemployment, Workers, Commute
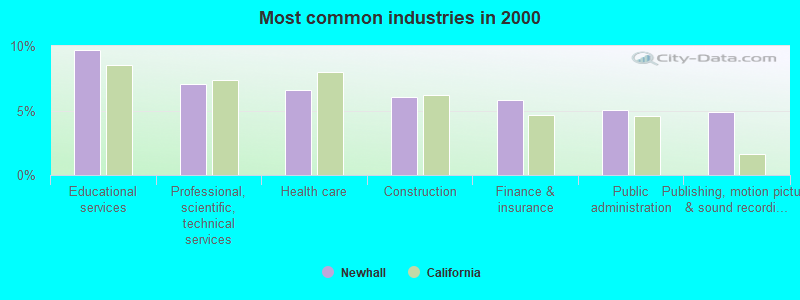
The most common industries in Newhall are: Educational services (9.7% of civilian employees), Professional, scientific, technical services (7.1% of civilian employees), Health care (6.6% of civilian employees). 68.0% of workers are employees of private companies, which is about the same as the rate of 68.0% across the entire state of California.
Most common industries
Most common industries | |||
|---|---|---|---|
Industry | All | Males | Females |
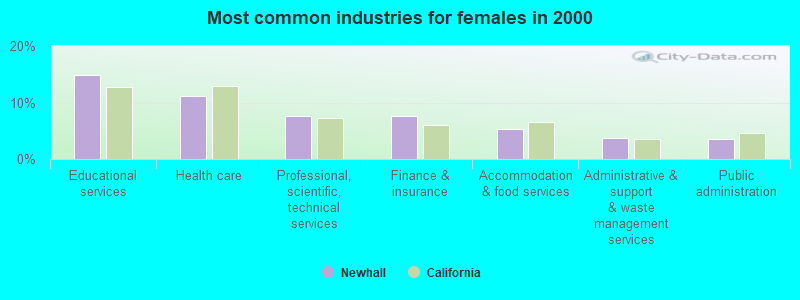
| Educational services | 9.7% (8,819) | 5.5% (2,745) | 14.8% (6,074) |
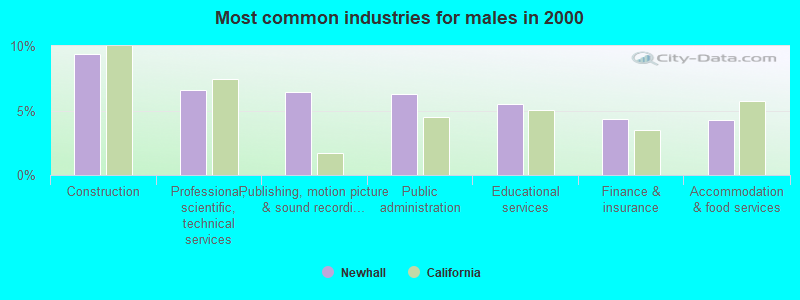
| Professional, scientific, and technical services | 7.1% (6,453) | 6.6% (3,319) | 7.6% (3,134) |
| Health care | 6.6% (6,024) | 3.0% (1,478) | 11.1% (4,546) |
| Construction | 6.1% (5,526) | 9.4% (4,715) | 2.0% (811) |
| Finance and insurance | 5.8% (5,300) | 4.4% (2,193) | 7.6% (3,107) |
| Public administration | 5.0% (4,592) | 6.3% (3,151) | 3.5% (1,441) |
| Publishing, and motion picture and sound recording industries | 4.9% (4,442) | 6.4% (3,216) | 3.0% (1,226) |
| Accommodation and food services | 4.8% (4,333) | 4.3% (2,137) | 5.3% (2,196) |
| Administrative and support and waste management services | 4.0% (3,686) | 4.3% (2,137) | 3.8% (1,549) |
| Arts, entertainment, and recreation | 3.3% (2,981) | 3.4% (1,684) | 3.2% (1,297) |
| Transportation equipment | 2.9% (2,610) | 3.9% (1,952) | 1.6% (658) |
| Real estate and rental and leasing | 2.3% (2,060) | 2.2% (1,084) | 2.4% (976) |
| Broadcasting and telecommunications | 2.1% (1,940) | 2.4% (1,207) | 1.8% (733) |
| Food and beverage stores | 2.0% (1,865) | 2.2% (1,105) | 1.8% (760) |
| Miscellaneous manufacturing | 1.7% (1,584) | 2.0% (985) | 1.5% (599) |
| Social assistance | 1.7% (1,573) | 0.4% (200) | 3.3% (1,373) |
| Computer and electronic products | 1.7% (1,536) | 1.8% (918) | 1.5% (618) |
| Motor vehicle and parts dealers | 1.5% (1,405) | 2.1% (1,034) | 0.9% (371) |
| Other transportation, and support activities, and couriers | 1.5% (1,332) | 1.9% (947) | 0.9% (385) |
| Repair and maintenance | 1.4% (1,308) | 2.3% (1,155) | 0.4% (153) |
| Religious, grantmaking, civic, professional, and similar organizations | 1.4% (1,259) | 1.3% (659) | 1.5% (600) |
| Personal and laundry services | 1.3% (1,211) | 0.5% (252) | 2.3% (959) |
| Metal and metal products | 1.2% (1,130) | 1.5% (747) | 0.9% (383) |
| Department and other general merchandise stores | 1.2% (1,126) | 0.9% (426) | 1.7% (700) |
| Utilities | 1.1% (981) | 1.6% (813) | 0.4% (168) |
| Machinery | 0.8% (766) | 1.2% (620) | 0.4% (146) |
| Chemicals | 0.7% (663) | 0.8% (404) | 0.6% (259) |
| Radio, TV, and computer stores | 0.7% (656) | 0.9% (431) | 0.5% (225) |
| Printing and related support activities | 0.7% (652) | 1.0% (493) | 0.4% (159) |
| U. S. Postal service | 0.7% (644) | 0.8% (425) | 0.5% (219) |
| Used merchandise, gift, novelty, and souvenir, and other miscellaneous stores | 0.7% (627) | 0.5% (262) | 0.9% (365) |
| Building material and garden equipment and supplies dealers | 0.7% (620) | 0.9% (431) | 0.5% (189) |
| Data processing, libraries, and other information services | 0.6% (579) | 0.7% (332) | 0.6% (247) |
| Groceries and related products merchant wholesalers | 0.6% (560) | 0.8% (409) | 0.4% (151) |
| Clothing and accessories, including shoe, stores | 0.6% (543) | 0.2% (115) | 1.0% (428) |
| Food | 0.6% (513) | 0.8% (402) | 0.3% (111) |
| Private households | 0.5% (500) | 0.1% (32) | 1.1% (468) |
| Furniture and home furnishings, and household appliance stores | 0.5% (453) | 0.5% (253) | 0.5% (200) |
| Air transportation | 0.5% (442) | 0.6% (298) | 0.4% (144) |
| Pharmacies and drug stores | 0.4% (399) | 0.3% (160) | 0.6% (239) |
| Truck transportation | 0.4% (396) | 0.7% (363) | 0.1% (33) |
| Professional and commercial equipment and supplies merchant wholesalers | 0.4% (374) | 0.4% (185) | 0.5% (189) |
| Electrical and electronic goods merchant wholesalers | 0.4% (372) | 0.5% (229) | 0.3% (143) |
| Other direct selling establishments | 0.4% (337) | 0.4% (212) | 0.3% (125) |
| Sporting goods, camera, and hobby and toy stores | 0.4% (333) | 0.4% (198) | 0.3% (135) |
| Apparel | 0.3% (305) | 0.2% (120) | 0.5% (185) |
| Miscellaneous nondurable goods merchant wholesalers | 0.3% (296) | 0.4% (189) | 0.3% (107) |
| Beverage and tobacco products | 0.3% (293) | 0.5% (232) | 0.1% (61) |
| Machinery, equipment, and supplies merchant wholesalers | 0.3% (287) | 0.4% (191) | 0.2% (96) |
| Health and personal care, except drug, stores | 0.3% (286) | 0.1% (55) | 0.6% (231) |
| Electrical equipment, appliances, and components | 0.3% (282) | 0.4% (207) | 0.2% (75) |
| Furniture and related product manufacturing | 0.3% (279) | 0.5% (233) | 0.1% (46) |
| Drugs, sundries, and chemical and allied products merchant wholesalers | 0.3% (272) | 0.2% (117) | 0.4% (155) |
| Electronic shopping and mail-order houses | 0.3% (256) | 0.3% (173) | 0.2% (83) |
| Miscellaneous durable goods merchant wholesalers | 0.3% (243) | 0.3% (172) | 0.2% (71) |
| Gasoline stations | 0.3% (230) | 0.3% (151) | 0.2% (79) |
| Plastics and rubber products | 0.3% (229) | 0.3% (162) | 0.2% (67) |
| Mining, quarrying, and oil and gas extraction | 0.2% (192) | 0.2% (125) | 0.2% (67) |
| Nonmetallic mineral products | 0.2% (189) | 0.3% (135) | 0.1% (54) |
| Motor vehicles, parts and supplies merchant wholesalers | 0.2% (176) | 0.3% (169) | 0.0% (7) |
| Office supplies and stationery stores | 0.2% (175) | 0.2% (79) | 0.2% (96) |
| Textile mills and textile products | 0.2% (147) | 0.1% (73) | 0.2% (74) |
| Hardware, plumbing and heating equipment, and supplies merchant wholesalers | 0.2% (144) | 0.2% (98) | 0.1% (46) |
| Agriculture, forestry, fishing and hunting | 0.2% (141) | 0.2% (78) | 0.2% (63) |
| Music stores | 0.1% (105) | 0.1% (45) | 0.1% (60) |
| Paper | 0.1% (105) | 0.2% (77) | 0.1% (28) |
| Book stores and news dealers | 0.1% (104) | 0.1% (32) | 0.2% (72) |
| Warehousing and storage | 0.1% (94) | 0.1% (65) | 0.1% (29) |
| Petroleum and coal products | 0.1% (65) | 0.1% (55) | 0.0% (10) |
| Furniture and home furnishing merchant wholesalers | 0.1% (61) | 0.1% (55) | 0.0% (6) |
| Rail transportation | 0.1% (56) | 0.1% (52) | 0.0% (4) |
Unemployment in Newhall
- Unemployment by race in 2000
- Unemployment rate for White non-Hispanic residents
- 4.1%Males
- 4.5%Females
- Unemployment rate for Black residents
- 7.3%Males
- 4.4%Females
- Unemployment rate for American Indian and Alaska Native residents
- 8.2%Males
- 13.2%Females
- Unemployment rate for Asian residents
- 4.3%Males
- 4.5%Females
- Unemployment rate for other race residents
- 6.0%Males
- 6.4%Females
- Unemployment rate for two or more race residents
- 5.8%Males
- 9.4%Females
- Unemployment rate for Hispanic or Latino residents
- 5.4%Males
- 5.9%Females
Time leaving home to go to work

<5am:
| Newhall: | 3.5% (3,102) |
| California: | 4.2% (606,086) |
5:30am:
| Newhall: | 4.3% (3,852) |
| California: | 3.6% (523,209) |
6am:
| Newhall: | 6.2% (5,531) |
| California: | 4.8% (692,256) |
6:30am:
| Newhall: | 10.7% (9,604) |
| California: | 8.4% (1,216,867) |
7am:
| Newhall: | 11.0% (9,798) |
| California: | 9.4% (1,362,830) |
7:30am:
| Newhall: | 14.7% (13,193) |
| California: | 13.8% (2,006,950) |
8am:
| Newhall: | 12.0% (10,706) |
| California: | 13.7% (1,986,831) |
8:30am:
| Newhall: | 9.9% (8,836) |
| California: | 10.9% (1,577,815) |
9am:
| Newhall: | 4.6% (4,147) |
| California: | 5.4% (778,152) |
10am:
| Newhall: | 5.7% (5,089) |
| California: | 6.7% (972,355) |
11am:
| Newhall: | 2.3% (2,049) |
| California: | 2.9% (414,479) |
12pm:
| Newhall: | 1.2% (1,031) |
| California: | 1.3% (189,005) |
4pm:
| Newhall: | 5.5% (4,923) |
| California: | 6.0% (865,284) |
>4pm:
| Newhall: | 5.3% (4,722) |
| California: | 5.3% (776,167) |
Travel time to work


Less than 5 minutes:
| Newhall: | 1.8% (1,578) |
| California: | 2.2% (324,703) |
5 to 9 minutes:
| Newhall: | 7.6% (6,793) |
| California: | 8.8% (1,280,443) |
10 to 14 minutes:
| Newhall: | 11.6% (10,349) |
| California: | 13.3% (1,930,263) |
15 to 19 minutes:
| Newhall: | 10.9% (9,768) |
| California: | 14.9% (2,157,970) |
20 to 24 minutes:
| Newhall: | 8.5% (7,616) |
| California: | 13.8% (2,004,060) |
25 to 29 minutes:
| Newhall: | 4.7% (4,196) |
| California: | 5.4% (782,241) |
30 to 34 minutes:
| Newhall: | 11.8% (10,567) |
| California: | 13.9% (2,025,657) |
35 to 39 minutes:
| Newhall: | 3.8% (3,444) |
| California: | 2.5% (366,487) |
40 to 44 minutes:
| Newhall: | 6.3% (5,629) |
| California: | 3.6% (528,043) |
45 to 59 minutes:
| Newhall: | 14.1% (12,586) |
| California: | 7.9% (1,151,598) |
60 to 89 minutes:
| Newhall: | 11.6% (10,412) |
| California: | 6.4% (933,123) |
90 or more minutes:
| Newhall: | 4.1% (3,645) |
| California: | 3.3% (483,698) |
Means of transportation to work


Drove car alone:
| Newhall: | 78.1% (69,850) |
| California: | 71.8% (10,432,462) |
Carpooled:
| Newhall: | 13.7% (12,218) |
| California: | 14.5% (2,113,313) |
Bus or trolley bus:
| Newhall: | 1.9% (1,672) |
| California: | 3.8% (549,425) |
Subway or elevated:
| Newhall: | 0.1% (67) |
| California: | 0.7% (107,711) |
Railroad:
| Newhall: | 0.8% (749) |
| California: | 0.3% (41,022) |
Ferryboat:
| Newhall: | 0.0% (4) |
| California: | 0.0% (6,831) |
Motorcycle:
| Newhall: | 0.2% (196) |
| California: | 0.2% (36,262) |
Bicycle:
| Newhall: | 0.4% (316) |
| California: | 0.8% (120,567) |
Walked:
| Newhall: | 1.3% (1,199) |
| California: | 2.9% (414,581) |
Other means:
| Newhall: | 0.3% (312) |
| California: | 0.8% (115,064) |
Private vehicle occupancy

Drove alone:
| Newhall: | 85.1% (69,850) |
| California: | 83.2% (10,432,462) |
In 2 person carpool:
| Newhall: | 11.3% (9,299) |
| California: | 12.5% (1,564,905) |
In 3 person carpool:
| Newhall: | 1.9% (1,555) |
| California: | 2.6% (330,732) |
In 4 person carpool:
| Newhall: | 0.7% (604) |
| California: | 1.0% (119,364) |
In 5-6 person carpool:
| Newhall: | 0.5% (398) |
| California: | 0.5% (57,036) |
In 7+ person carpool:
| Newhall: | 0.4% (362) |
| California: | 0.3% (41,276) |
Class of workers

Employee of private company:
| Newhall: | 68.0% (62,024) |
| California: | 68.0% (10,009,465) |
Self-employed in own incorporated business:
| Newhall: | 2.8% (2,556) |
| California: | 2.7% (402,392) |
Private not-for-profit wage and salary workers:
| Newhall: | 6.2% (5,666) |
| California: | 5.7% (845,536) |
Local government workers:
| Newhall: | 10.4% (9,458) |
| California: | 8.3% (1,218,764) |
State government workers:
| Newhall: | 3.1% (2,785) |
| California: | 4.0% (594,953) |
Federal government workers:
| Newhall: | 1.6% (1,457) |
| California: | 2.3% (344,354) |
Self-employed workers in own not incorporated business:
| Newhall: | 7.6% (6,940) |
| California: | 8.5% (1,249,530) |
Unpaid family workers:
| Newhall: | 0.3% (293) |
| California: | 0.4% (53,934) |

Employee of private company - Males:
| Newhall: | 69.4% (34,769) |
| California: | 71.1% (5,716,697) |
Self-employed in own incorporated business - Males:
| Newhall: | 3.7% (1,851) |
| California: | 3.6% (290,657) |
Private not-for-profit wage and salary workers - Males:
| Newhall: | 4.3% (2,170) |
| California: | 3.8% (303,997) |
Local government workers - Males:
| Newhall: | 9.7% (4,860) |
| California: | 6.2% (495,927) |
State government workers - Males:
| Newhall: | 2.3% (1,153) |
| California: | 3.2% (255,434) |
Federal government workers - Males:
| Newhall: | 1.8% (925) |
| California: | 2.5% (198,555) |
Self-employed workers in own not incorporated business - Males:
| Newhall: | 8.5% (4,261) |
| California: | 9.5% (760,853) |
Unpaid family workers - Males:
| Newhall: | 0.2% (100) |
| California: | 0.3% (23,230) |

Employee of private company - Females:
| Newhall: | 66.3% (27,255) |
| California: | 64.3% (4,292,768) |
Self-employed in own incorporated business - Females:
| Newhall: | 1.7% (705) |
| California: | 1.7% (111,735) |
Private not-for-profit wage and salary workers - Females:
| Newhall: | 8.5% (3,496) |
| California: | 8.1% (541,539) |
Local government workers - Females:
| Newhall: | 11.2% (4,598) |
| California: | 10.8% (722,837) |
State government workers - Females:
| Newhall: | 4.0% (1,632) |
| California: | 5.1% (339,519) |
Federal government workers - Females:
| Newhall: | 1.3% (532) |
| California: | 2.2% (145,799) |
Self-employed workers in own not incorporated business - Females:
| Newhall: | 6.5% (2,679) |
| California: | 7.3% (488,677) |
Unpaid family workers - Females:
| Newhall: | 0.5% (193) |
| California: | 0.5% (30,704) |