Work and Jobs in Northampton, Massachusetts (MA) Detailed Stats
Occupations, Industries, Unemployment, Workers, Commute
Settings
X


Recent posts about work in Northampton, Massachusetts on our local forum with over 2,400,000 registered users:
 | Job Situation in Northampton area for older person (4 replies) |
| New Job in Springfield MA (Baystate) Housing Options (33 replies) |
| What are the Cons of living in the Northampton area? (43 replies) |
| Looking for feedback or ideas on our move to Northampton area (23 replies) |
| Rentals in Northampton (3 replies) |
| Oklahoma to (likely Western) Massachusetts - Beginning Research (274 replies) |
Latest news about work in Northampton, MA collected exclusively by city-data.com from local newspapers, TV, and radio stations
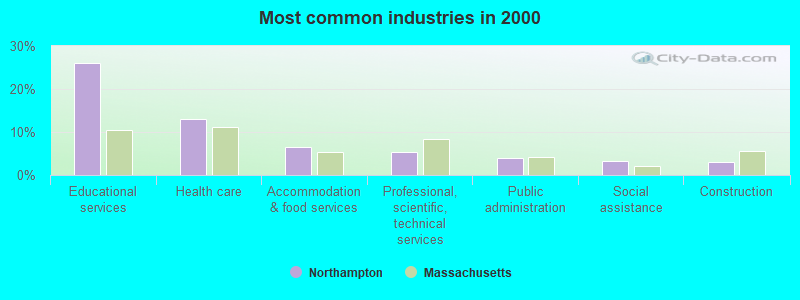
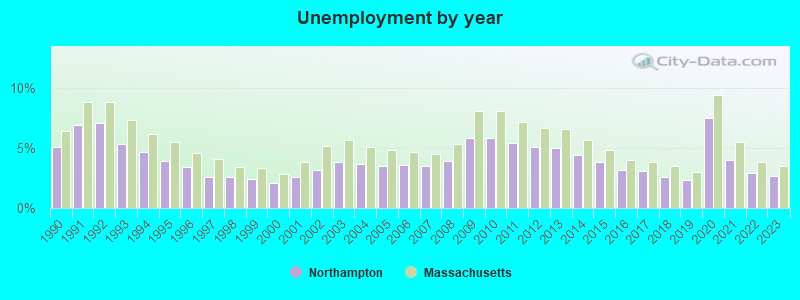
The unemployment rate in 2023 in Northampton, MA was 2.7%, which was 29.6% less than the unemployment rate of 3.5% across the entire state of Massachusetts. Compared to the unemployment rate of 5.0% in 2013, this represents a decrease of 85.2%. The most common industries in Northampton are: Educational services (26.2% of civilian employees), Health care (13.1% of civilian employees), Accommodation & food services (6.4% of civilian employees). 73.6% of workers work in Hampshire County and 19.8% of all workers work at home. 45.1% of workers are employees of private companies, which is 44.1% less than the rate of 65.0% across the entire state of Massachusetts.
Whole page based on the data from 2000 / 2022 when the population of Northampton, Massachusetts was 28,978 / 29,833
Whole page based on the data from 2000 / 2022 when the population of Northampton, Massachusetts was 28,978 / 29,833
Most common industries
Most common industries | |||
|---|---|---|---|
Industry | All | Males | Females |
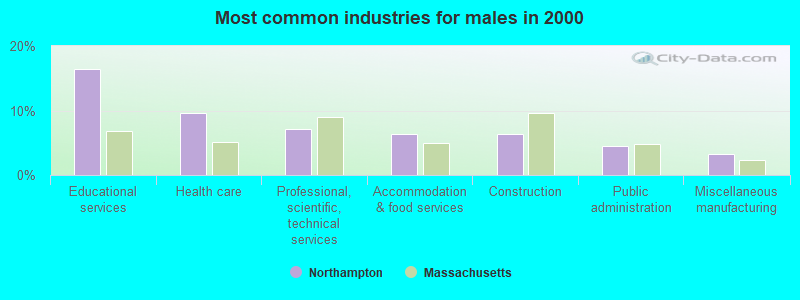
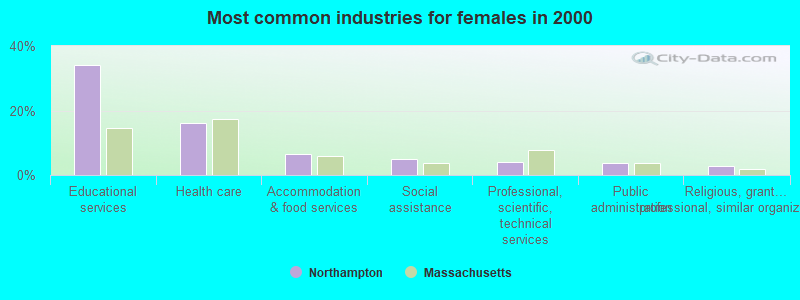
| Educational services | 26.2% (4,261) | 16.4% (1,191) | 34.1% (3,070) |
| Health care | 13.1% (2,136) | 9.6% (696) | 16.0% (1,440) |
| Accommodation and food services | 6.4% (1,043) | 6.4% (465) | 6.4% (578) |
| Professional, scientific, and technical services | 5.3% (870) | 7.1% (520) | 3.9% (350) |
| Public administration | 4.1% (661) | 4.5% (325) | 3.7% (336) |
| Social assistance | 3.4% (548) | 1.2% (89) | 5.1% (459) |
| Construction | 3.1% (501) | 6.3% (462) | 0.4% (39) |
| Administrative and support and waste management services | 2.6% (417) | 3.1% (228) | 2.1% (189) |
| Religious, grantmaking, civic, professional, and similar organizations | 2.3% (374) | 1.8% (133) | 2.7% (241) |
| Miscellaneous manufacturing | 2.2% (358) | 3.2% (233) | 1.4% (125) |
| Food and beverage stores | 2.1% (349) | 2.8% (205) | 1.6% (144) |
| Publishing, and motion picture and sound recording industries | 2.0% (331) | 2.0% (142) | 2.1% (189) |
| Finance and insurance | 2.0% (319) | 1.8% (132) | 2.1% (187) |
| Arts, entertainment, and recreation | 1.7% (279) | 2.1% (152) | 1.4% (127) |
| Real estate and rental and leasing | 1.6% (268) | 2.0% (149) | 1.3% (119) |
| Plastics and rubber products | 1.2% (191) | 1.8% (130) | 0.7% (61) |
| Metal and metal products | 1.1% (180) | 2.0% (146) | 0.4% (34) |
| Data processing, libraries, and other information services | 1.1% (178) | 0.6% (46) | 1.5% (132) |
| Department and other general merchandise stores | 1.0% (155) | 0.7% (50) | 1.2% (105) |
| Personal and laundry services | 0.9% (151) | 0.6% (42) | 1.2% (109) |
| Machinery | 0.8% (132) | 1.5% (111) | 0.2% (21) |
| Used merchandise, gift, novelty, and souvenir, and other miscellaneous stores | 0.8% (132) | 0.9% (63) | 0.8% (69) |
| Groceries and related products merchant wholesalers | 0.8% (131) | 1.7% (124) | 0.1% (7) |
| Broadcasting and telecommunications | 0.8% (130) | 1.3% (95) | 0.4% (35) |
| U. S. Postal service | 0.8% (123) | 0.9% (66) | 0.6% (57) |
| Repair and maintenance | 0.7% (118) | 1.4% (101) | 0.2% (17) |
| Other direct selling establishments | 0.6% (103) | 0.7% (48) | 0.6% (55) |
| Miscellaneous nondurable goods merchant wholesalers | 0.6% (98) | 0.8% (56) | 0.5% (42) |
| Computer and electronic products | 0.5% (88) | 0.9% (64) | 0.3% (24) |
| Motor vehicle and parts dealers | 0.5% (88) | 0.8% (58) | 0.3% (30) |
| Utilities | 0.5% (83) | 0.8% (60) | 0.3% (23) |
| Other transportation, and support activities, and couriers | 0.5% (77) | 0.6% (44) | 0.4% (33) |
| Radio, TV, and computer stores | 0.4% (71) | 0.8% (57) | 0.2% (14) |
| Building material and garden equipment and supplies dealers | 0.4% (70) | 0.5% (35) | 0.4% (35) |
| Sporting goods, camera, and hobby and toy stores | 0.4% (70) | 0.7% (50) | 0.2% (20) |
| Book stores and news dealers | 0.4% (65) | 0.8% (58) | 0.1% (7) |
| Chemicals | 0.4% (64) | 0.5% (35) | 0.3% (29) |
| Paper | 0.3% (57) | 0.5% (40) | 0.2% (17) |
| Private households | 0.3% (55) | 0.1% (5) | 0.6% (50) |
| Pharmacies and drug stores | 0.3% (53) | 0.2% (12) | 0.5% (41) |
| Clothing and accessories, including shoe, stores | 0.3% (52) | 0.1% (10) | 0.5% (42) |
| Nonmetallic mineral products | 0.3% (48) | 0.3% (25) | 0.3% (23) |
| Printing and related support activities | 0.3% (46) | 0.5% (33) | 0.1% (13) |
| Fuel dealers | 0.3% (42) | 0.3% (22) | 0.2% (20) |
| Truck transportation | 0.3% (42) | 0.5% (36) | 0.1% (6) |
| Retail florists | 0.2% (40) | 0.4% (26) | 0.2% (14) |
| Wood products | 0.2% (38) | 0.5% (33) | 0.1% (5) |
| Transportation equipment | 0.2% (36) | 0.5% (36) | 0.0% (0) |
| Drugs, sundries, and chemical and allied products merchant wholesalers | 0.2% (34) | 0.4% (28) | 0.1% (6) |
| Electronic shopping and mail-order houses | 0.2% (34) | 0.1% (7) | 0.3% (27) |
| Hardware, plumbing and heating equipment, and supplies merchant wholesalers | 0.2% (33) | 0.2% (17) | 0.2% (16) |
| Agriculture, forestry, fishing and hunting | 0.2% (31) | 0.2% (18) | 0.1% (13) |
| Music stores | 0.2% (31) | 0.4% (31) | 0.0% (0) |
| Rail transportation | 0.2% (29) | 0.4% (29) | 0.0% (0) |
| Furniture and home furnishings, and household appliance stores | 0.2% (28) | 0.3% (19) | 0.1% (9) |
| Gasoline stations | 0.2% (27) | 0.4% (27) | 0.0% (0) |
| Food | 0.2% (26) | 0.1% (5) | 0.2% (21) |
| Electrical equipment, appliances, and components | 0.1% (24) | 0.1% (7) | 0.2% (17) |
| Office supplies and stationery stores | 0.1% (24) | 0.1% (8) | 0.2% (16) |
| Health and personal care, except drug, stores | 0.1% (23) | 0.2% (14) | 0.1% (9) |
| Textile mills and textile products | 0.1% (22) | 0.1% (5) | 0.2% (17) |
| Sewing, needlework, and piece goods stores | 0.1% (22) | 0.1% (6) | 0.2% (16) |
| Alcoholic beverages merchant wholesalers | 0.1% (21) | 0.3% (21) | 0.0% (0) |
| Professional and commercial equipment and supplies merchant wholesalers | 0.1% (20) | 0.2% (11) | 0.1% (9) |
| Machinery, equipment, and supplies merchant wholesalers | 0.1% (19) | 0.3% (19) | 0.0% (0) |
| Petroleum and petroleum products merchant wholesalers | 0.1% (16) | 0.2% (16) | 0.0% (0) |
| Furniture and related product manufacturing | 0.1% (13) | 0.2% (13) | 0.0% (0) |
| Air transportation | 0.1% (10) | 0.1% (10) | 0.0% (0) |
| Paper and paper products merchant wholesalers | 0.1% (10) | 0.1% (10) | 0.0% (0) |
| Jewelry, luggage, and leather goods stores | 0.0% (8) | 0.1% (8) | 0.0% (0) |
Unemployment in Northampton
- Unemployment by race in 2022
- Unemployment rate for White non-Hispanic residents
- 2.9%Males
- 5.4%Females
- Unemployment rate for Black residents
- 14.4%Males
- 5.7%Females
- Unemployment rate for Asian residents
- 7.0%Females
- Unemployment rate for other race residents
- 0.3%Males
- 17.0%Females
- Unemployment rate for two or more race residents
- 3.5%Males
- 1.5%Females
- Unemployment rate for Hispanic or Latino residents
- 3.5%Males
- 4.5%Females
- Unemployment by race in 2000
- Unemployment rate for White non-Hispanic residents
- 5.0%Males
- 3.4%Females
- Unemployment rate for Black residents
- 6.6%Males
- 5.3%Females
- Unemployment rate for Asian residents
- 3.7%Males
- Unemployment rate for other race residents
- 15.4%Females
- Unemployment rate for two or more race residents
- 6.0%Females
- Unemployment rate for Hispanic or Latino residents
- 1.9%Males
- 10.8%Females
Unemployment in 2023:
| Northampton: | 2.7% |
| Massachusetts: | 3.5% |
Unemployment in 2022:
| Northampton: | 2.9% |
| Massachusetts: | 3.8% |
Unemployment in 2021:
| Northampton: | 4.0% |
| Massachusetts: | 5.5% |
Unemployment in 2020:
| Northampton: | 7.5% |
| Massachusetts: | 9.4% |
Unemployment in 2019:
| Northampton: | 2.3% |
| Massachusetts: | 3.0% |
Unemployment in 2018:
| Northampton: | 2.6% |
| Massachusetts: | 3.5% |
Unemployment in 2017:
| Northampton: | 3.1% |
| Massachusetts: | 3.8% |
Unemployment in 2016:
| Northampton: | 3.2% |
| Massachusetts: | 4.0% |
Unemployment in 2015:
| Northampton: | 3.8% |
| Massachusetts: | 4.8% |
Unemployment in 2014:
| Northampton: | 4.4% |
| Massachusetts: | 5.7% |
Unemployment in 2013:
| Northampton: | 5.0% |
| Massachusetts: | 6.6% |
Unemployment in 2012:
| Northampton: | 5.1% |
| Massachusetts: | 6.7% |
Unemployment in 2011:
| Northampton: | 5.4% |
| Massachusetts: | 7.2% |
Unemployment in 2010:
| Northampton: | 5.8% |
| Massachusetts: | 8.1% |
Unemployment in 2009:
| Northampton: | 5.8% |
| Massachusetts: | 8.1% |
Unemployment in 2008:
| Northampton: | 3.9% |
| Massachusetts: | 5.3% |
Unemployment in 2007:
| Northampton: | 3.5% |
| Massachusetts: | 4.5% |
Unemployment in 2006:
| Northampton: | 3.6% |
| Massachusetts: | 4.7% |
Unemployment in 2005:
| Northampton: | 3.5% |
| Massachusetts: | 4.8% |
Unemployment in 2004:
| Northampton: | 3.7% |
| Massachusetts: | 5.1% |
Unemployment in 2003:
| Northampton: | 3.8% |
| Massachusetts: | 5.7% |
Unemployment in 2002:
| Northampton: | 3.2% |
| Massachusetts: | 5.2% |
Unemployment in 2001:
| Northampton: | 2.6% |
| Massachusetts: | 3.8% |
Unemployment in 2000:
| Northampton: | 2.1% |
| Massachusetts: | 2.8% |
Unemployment in 1999:
| Northampton: | 2.4% |
| Massachusetts: | 3.3% |
Unemployment in 1998:
| Northampton: | 2.6% |
| Massachusetts: | 3.4% |
Unemployment in 1997:
| Northampton: | 2.6% |
| Massachusetts: | 4.1% |
Unemployment in 1996:
| Northampton: | 3.4% |
| Massachusetts: | 4.6% |
Unemployment in 1995:
| Northampton: | 3.9% |
| Massachusetts: | 5.5% |
Unemployment in 1994:
| Northampton: | 4.7% |
| Massachusetts: | 6.2% |
Unemployment in 1993:
| Northampton: | 5.3% |
| Massachusetts: | 7.3% |
Unemployment in 1992:
| Northampton: | 7.1% |
| Massachusetts: | 8.8% |
Unemployment in 1991:
| Northampton: | 6.9% |
| Massachusetts: | 8.8% |
Unemployment in 1990:
| Northampton: | 5.1% |
| Massachusetts: | 6.4% |
Time leaving home to go to work

12:00 a.m. to 4:59 a.m.:
| Northampton: | 1.6% (190) |
| Massachusetts: | 3.9% (116,755) |
5:00 a.m. to 5:29 a.m.:
| Northampton: | 0.9% (104) |
| Massachusetts: | 3.5% (103,153) |
5:30 a.m. to 5:59 a.m.:
| Northampton: | 3.6% (421) |
| Massachusetts: | 4.1% (120,321) |
6:00 a.m. to 6:29 a.m.:
| Northampton: | 3.0% (351) |
| Massachusetts: | 8.1% (240,674) |
6:30 a.m. to 6:59 a.m.:
| Northampton: | 8.9% (1,038) |
| Massachusetts: | 9.7% (288,690) |
7:00 a.m. to 7:29 a.m.:
| Northampton: | 9.7% (1,131) |
| Massachusetts: | 14.0% (415,385) |
7:30 a.m. to 7:59 a.m.:
| Northampton: | 14.4% (1,683) |
| Massachusetts: | 11.5% (342,657) |
8:00 a.m. to 8:29 a.m.:
| Northampton: | 15.1% (1,765) |
| Massachusetts: | 13.4% (397,867) |
8:30 a.m. to 8:59 a.m.:
| Northampton: | 10.0% (1,160) |
| Massachusetts: | 7.3% (217,782) |
9:00 a.m. to 9:59 a.m.:
| Northampton: | 10.3% (1,195) |
| Massachusetts: | 7.7% (227,745) |
10:00 a.m. to 10:59 a.m.:
| Northampton: | 5.1% (598) |
| Massachusetts: | 3.3% (96,477) |
11:00 a.m. to 11:59 a.m.:
| Northampton: | 1.5% (170) |
| Massachusetts: | 1.4% (41,737) |
12:00 p.m. to 3:59 p.m.:
| Northampton: | 10.8% (1,261) |
| Massachusetts: | 7.0% (208,178) |
4:00 p.m. to 11:59 p.m.:
| Northampton: | 4.9% (576) |
| Massachusetts: | 5.0% (149,389) |

<5am:
| Northampton: | 1.5% (235) |
| Massachusetts: | 2.3% (70,820) |
5:30am:
| Northampton: | 1.1% (177) |
| Massachusetts: | 2.2% (67,777) |
6am:
| Northampton: | 2.5% (397) |
| Massachusetts: | 3.6% (112,836) |
6:30am:
| Northampton: | 4.3% (681) |
| Massachusetts: | 7.8% (241,535) |
7am:
| Northampton: | 7.3% (1,176) |
| Massachusetts: | 10.1% (312,368) |
7:30am:
| Northampton: | 9.9% (1,582) |
| Massachusetts: | 14.5% (448,737) |
8am:
| Northampton: | 13.2% (2,121) |
| Massachusetts: | 14.9% (463,192) |
8:30am:
| Northampton: | 15.6% (2,503) |
| Massachusetts: | 13.3% (414,200) |
9am:
| Northampton: | 9.8% (1,574) |
| Massachusetts: | 6.7% (209,354) |
10am:
| Northampton: | 8.7% (1,400) |
| Massachusetts: | 5.8% (181,108) |
11am:
| Northampton: | 4.1% (651) |
| Massachusetts: | 2.2% (68,937) |
12pm:
| Northampton: | 1.6% (260) |
| Massachusetts: | 1.0% (31,956) |
4pm:
| Northampton: | 9.3% (1,485) |
| Massachusetts: | 6.7% (207,296) |
>4pm:
| Northampton: | 6.6% (1,060) |
| Massachusetts: | 5.6% (175,217) |

12:00 a.m. to 4:59 a.m. - Males:
| Northampton: | 3.8% (191) |
| Massachusetts: | 5.1% (77,876) |
5:00 a.m. to 5:29 a.m. - Males:
| Northampton: | 2.6% (132) |
| Massachusetts: | 5.0% (75,862) |
5:30 a.m. to 5:59 a.m. - Males:
| Northampton: | 7.0% (354) |
| Massachusetts: | 5.0% (76,333) |
6:00 a.m. to 6:29 a.m. - Males:
| Northampton: | 4.7% (239) |
| Massachusetts: | 9.7% (149,033) |
6:30 a.m. to 6:59 a.m. - Males:
| Northampton: | 10.0% (508) |
| Massachusetts: | 10.0% (153,618) |
7:00 a.m. to 7:29 a.m. - Males:
| Northampton: | 9.0% (457) |
| Massachusetts: | 13.6% (208,401) |
7:30 a.m. to 7:59 a.m. - Males:
| Northampton: | 16.4% (834) |
| Massachusetts: | 10.2% (155,897) |
8:00 a.m. to 8:29 a.m. - Males:
| Northampton: | 8.5% (430) |
| Massachusetts: | 12.4% (189,835) |
8:30 a.m. to 8:59 a.m. - Males:
| Northampton: | 7.3% (372) |
| Massachusetts: | 5.8% (88,386) |
9:00 a.m. to 9:59 a.m. - Males:
| Northampton: | 5.9% (302) |
| Massachusetts: | 6.9% (105,616) |
10:00 a.m. to 10:59 a.m. - Males:
| Northampton: | 4.6% (232) |
| Massachusetts: | 2.9% (43,920) |
11:00 a.m. to 11:59 a.m. - Males:
| Northampton: | 2.3% (119) |
| Massachusetts: | 1.2% (18,895) |
12:00 p.m. to 3:59 p.m. - Males:
| Northampton: | 10.5% (533) |
| Massachusetts: | 6.9% (105,991) |
4:00 p.m. to 11:59 p.m. - Males:
| Northampton: | 6.7% (338) |
| Massachusetts: | 5.3% (80,723) |

12:00 a.m. to 4:59 a.m. - Females:
| Northampton: | 1.2% (77) |
| Massachusetts: | 2.7% (38,879) |
5:30 a.m. to 5:59 a.m. - Females:
| Northampton: | 1.1% (71) |
| Massachusetts: | 3.1% (43,988) |
6:00 a.m. to 6:29 a.m. - Females:
| Northampton: | 1.7% (112) |
| Massachusetts: | 6.4% (91,641) |
6:30 a.m. to 6:59 a.m. - Females:
| Northampton: | 8.1% (537) |
| Massachusetts: | 9.4% (135,072) |
7:00 a.m. to 7:29 a.m. - Females:
| Northampton: | 10.4% (687) |
| Massachusetts: | 14.4% (206,984) |
7:30 a.m. to 7:59 a.m. - Females:
| Northampton: | 12.7% (838) |
| Massachusetts: | 13.0% (186,760) |
8:00 a.m. to 8:29 a.m. - Females:
| Northampton: | 20.9% (1,379) |
| Massachusetts: | 14.5% (208,032) |
8:30 a.m. to 8:59 a.m. - Females:
| Northampton: | 11.2% (738) |
| Massachusetts: | 9.0% (129,396) |
9:00 a.m. to 9:59 a.m. - Females:
| Northampton: | 13.5% (892) |
| Massachusetts: | 8.5% (122,129) |
10:00 a.m. to 10:59 a.m. - Females:
| Northampton: | 5.4% (355) |
| Massachusetts: | 3.7% (52,557) |
11:00 a.m. to 11:59 a.m. - Females:
| Northampton: | 0.9% (59) |
| Massachusetts: | 1.6% (22,842) |
12:00 p.m. to 3:59 p.m. - Females:
| Northampton: | 10.9% (723) |
| Massachusetts: | 7.1% (102,187) |
4:00 p.m. to 11:59 p.m. - Females:
| Northampton: | 3.5% (230) |
| Massachusetts: | 4.8% (68,666) |
Travel time to work
Percentage of workers working in this county: 73.6%
Number of people working at home: 2,803 (19.8% of all workers)
Daytime population change due to commuting: +4,029 (+13.9%)
Workers who live and work in this city: 8,270 (51.7%)
Number of people working at home: 2,803 (19.8% of all workers)
Daytime population change due to commuting: +4,029 (+13.9%)
Workers who live and work in this city: 8,270 (51.7%)

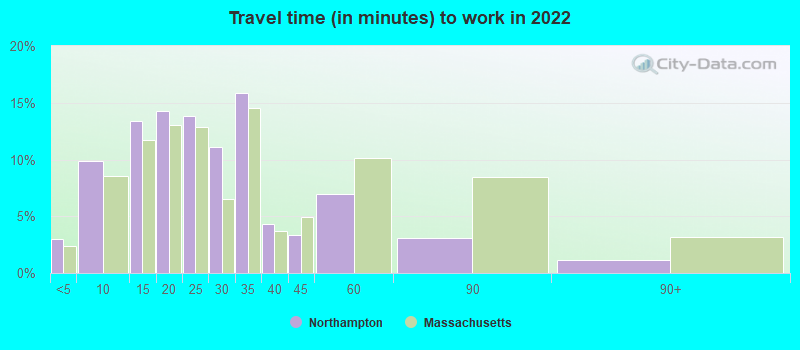

Less than 5 minutes:
| Northampton: | 3.0% (546) |
| Massachusetts: | 2.4% (72,022) |
5 to 9 minutes:
| Northampton: | 9.8% (1,814) |
| Massachusetts: | 8.5% (259,432) |
10 to 14 minutes:
| Northampton: | 13.4% (2,469) |
| Massachusetts: | 11.7% (357,609) |
15 to 19 minutes:
| Northampton: | 14.3% (2,642) |
| Massachusetts: | 13.1% (398,711) |
20 to 24 minutes:
| Northampton: | 13.9% (2,556) |
| Massachusetts: | 12.9% (393,113) |
25 to 29 minutes:
| Northampton: | 11.1% (2,054) |
| Massachusetts: | 6.5% (198,426) |
30 to 34 minutes:
| Northampton: | 15.9% (2,928) |
| Massachusetts: | 14.6% (443,620) |
35 to 39 minutes:
| Northampton: | 4.3% (802) |
| Massachusetts: | 3.7% (112,842) |
40 to 44 minutes:
| Northampton: | 3.3% (610) |
| Massachusetts: | 4.9% (150,286) |
45 to 59 minutes:
| Northampton: | 7.0% (1,284) |
| Massachusetts: | 10.1% (308,964) |
60 to 89 minutes:
| Northampton: | 3.1% (576) |
| Massachusetts: | 8.5% (257,818) |
90 or more minutes:
| Northampton: | 1.2% (218) |
| Massachusetts: | 3.1% (95,609) |


Less than 5 minutes:
| Northampton: | 5.1% (814) |
| Massachusetts: | 2.7% (85,006) |
5 to 9 minutes:
| Northampton: | 17.3% (2,774) |
| Massachusetts: | 9.9% (306,086) |
10 to 14 minutes:
| Northampton: | 18.3% (2,934) |
| Massachusetts: | 13.7% (426,161) |
15 to 19 minutes:
| Northampton: | 13.8% (2,217) |
| Massachusetts: | 13.7% (423,798) |
20 to 24 minutes:
| Northampton: | 12.0% (1,915) |
| Massachusetts: | 13.1% (406,831) |
25 to 29 minutes:
| Northampton: | 6.5% (1,043) |
| Massachusetts: | 5.5% (171,328) |
30 to 34 minutes:
| Northampton: | 11.0% (1,764) |
| Massachusetts: | 13.2% (409,733) |
35 to 39 minutes:
| Northampton: | 1.9% (310) |
| Massachusetts: | 3.1% (96,168) |
40 to 44 minutes:
| Northampton: | 2.3% (365) |
| Massachusetts: | 4.1% (128,484) |
45 to 59 minutes:
| Northampton: | 2.7% (425) |
| Massachusetts: | 8.9% (275,413) |
60 to 89 minutes:
| Northampton: | 2.7% (439) |
| Massachusetts: | 6.5% (201,587) |
90 or more minutes:
| Northampton: | 1.9% (302) |
| Massachusetts: | 2.4% (74,738) |

Less than 5 minutes - Males:
| Northampton: | 2.0% (148) |
| Massachusetts: | 2.3% (36,410) |
5 to 9 minutes - Males:
| Northampton: | 9.7% (712) |
| Massachusetts: | 7.2% (112,656) |
10 to 14 minutes - Males:
| Northampton: | 11.8% (870) |
| Massachusetts: | 11.3% (177,902) |
15 to 19 minutes - Males:
| Northampton: | 14.0% (1,034) |
| Massachusetts: | 12.3% (193,786) |
20 to 24 minutes - Males:
| Northampton: | 14.5% (1,066) |
| Massachusetts: | 12.8% (201,122) |
25 to 29 minutes - Males:
| Northampton: | 10.4% (770) |
| Massachusetts: | 6.2% (96,875) |
30 to 34 minutes - Males:
| Northampton: | 13.8% (1,018) |
| Massachusetts: | 15.0% (236,094) |
35 to 39 minutes - Males:
| Northampton: | 7.5% (551) |
| Massachusetts: | 3.6% (57,357) |
40 to 44 minutes - Males:
| Northampton: | 3.1% (230) |
| Massachusetts: | 5.0% (79,224) |
45 to 59 minutes - Males:
| Northampton: | 6.8% (504) |
| Massachusetts: | 10.7% (168,920) |
60 to 89 minutes - Males:
| Northampton: | 5.0% (367) |
| Massachusetts: | 9.6% (151,339) |
90 or more minutes - Males:
| Northampton: | 1.1% (85) |
| Massachusetts: | 3.9% (61,139) |

Less than 5 minutes - Females:
| Northampton: | 3.7% (415) |
| Massachusetts: | 2.4% (35,612) |
5 to 9 minutes - Females:
| Northampton: | 9.9% (1,112) |
| Massachusetts: | 9.9% (146,776) |
10 to 14 minutes - Females:
| Northampton: | 14.2% (1,594) |
| Massachusetts: | 12.2% (179,707) |
15 to 19 minutes - Females:
| Northampton: | 14.4% (1,614) |
| Massachusetts: | 13.9% (204,925) |
20 to 24 minutes - Females:
| Northampton: | 13.2% (1,480) |
| Massachusetts: | 13.0% (191,991) |
25 to 29 minutes - Females:
| Northampton: | 11.4% (1,275) |
| Massachusetts: | 6.9% (101,551) |
30 to 34 minutes - Females:
| Northampton: | 17.7% (1,988) |
| Massachusetts: | 14.1% (207,526) |
35 to 39 minutes - Females:
| Northampton: | 2.1% (239) |
| Massachusetts: | 3.8% (55,485) |
40 to 44 minutes - Females:
| Northampton: | 3.3% (373) |
| Massachusetts: | 4.8% (71,062) |
45 to 59 minutes - Females:
| Northampton: | 7.0% (787) |
| Massachusetts: | 9.5% (140,044) |
60 to 89 minutes - Females:
| Northampton: | 1.9% (209) |
| Massachusetts: | 7.2% (106,479) |
90 or more minutes - Females:
| Northampton: | 1.2% (137) |
| Massachusetts: | 2.3% (34,470) |
Means of transportation to work
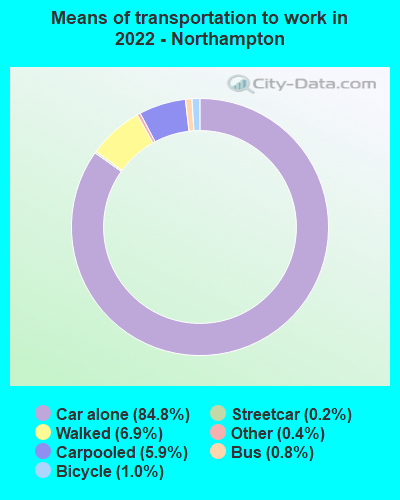
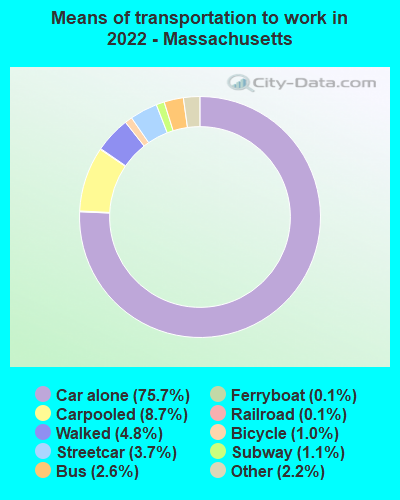
Drove car alone:
| Northampton: | 84.8% (15,235) |
| Massachusetts: | 75.7% (1,106,594) |
Carpooled:
| Northampton: | 5.9% (1,066) |
| Massachusetts: | 8.7% (127,626) |
Bus:
| Northampton: | 0.8% (146) |
| Massachusetts: | 2.6% (44,354) |
Subway or elevated rail:
| Northampton: | 0.2% (29) |
| Massachusetts: | 3.7% (60,427) |
Bicycle:
| Northampton: | 1.0% (173) |
| Massachusetts: | 1.0% (8,296) |
Walked:
| Northampton: | 6.9% (1,245) |
| Massachusetts: | 4.8% (75,411) |
Other means:
| Northampton: | 0.4% (70) |
| Massachusetts: | 2.2% (32,311) |

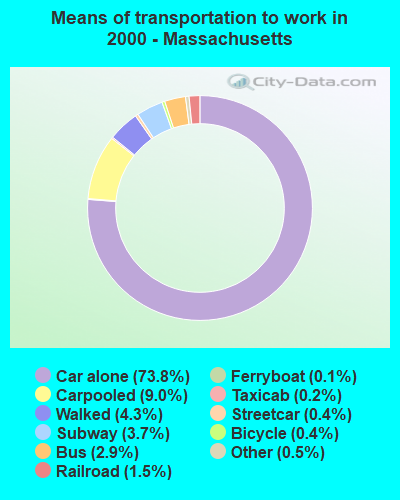
Drove car alone:
| Northampton: | 70.0% (11,206) |
| Massachusetts: | 73.8% (2,290,258) |
Carpooled:
| Northampton: | 7.1% (1,139) |
| Massachusetts: | 9.0% (279,111) |
Bus or trolley bus:
| Northampton: | 2.8% (442) |
| Massachusetts: | 2.9% (88,595) |
Subway or elevated:
| Northampton: | 0.1% (17) |
| Massachusetts: | 3.7% (113,857) |
Railroad:
| Northampton: | 0.0% (8) |
| Massachusetts: | 1.5% (46,263) |
Taxicab:
| Northampton: | 0.2% (40) |
| Massachusetts: | 0.2% (6,547) |
Motorcycle:
| Northampton: | 0.1% (11) |
| Massachusetts: | 0.1% (1,604) |
Bicycle:
| Northampton: | 1.3% (207) |
| Massachusetts: | 0.4% (12,355) |
Walked:
| Northampton: | 13.7% (2,188) |
| Massachusetts: | 4.3% (134,566) |
Other means:
| Northampton: | 0.3% (44) |
| Massachusetts: | 0.5% (16,697) |

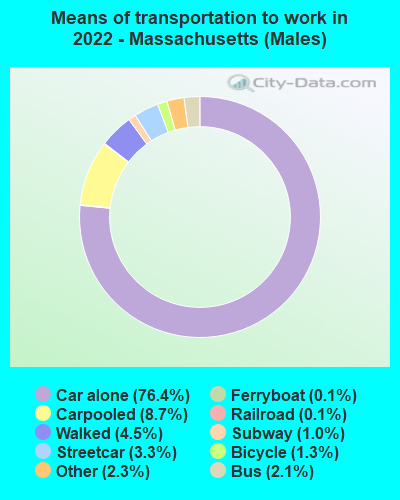
Drove car alone - Males:
| Northampton: | 86.1% (6,859) |
| Massachusetts: | 76.4% (1,106,594) |
Carpooled - Males:
| Northampton: | 4.2% (337) |
| Massachusetts: | 8.7% (127,626) |
Bus - Males:
| Northampton: | 0.4% (34) |
| Massachusetts: | 2.1% (44,354) |
Subway or elevated rail - Males:
| Northampton: | 0.4% (29) |
| Massachusetts: | 3.3% (60,427) |
Bicycle - Males:
| Northampton: | 1.1% (90) |
| Massachusetts: | 1.3% (8,296) |
Walked - Males:
| Northampton: | 7.2% (575) |
| Massachusetts: | 4.5% (75,411) |
Other means - Males:
| Northampton: | 0.6% (45) |
| Massachusetts: | 2.3% (32,311) |

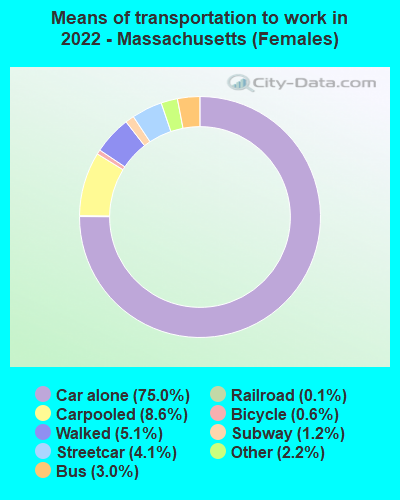
Drove car alone - Females:
| Northampton: | 83.8% (8,385) |
| Massachusetts: | 75.0% (1,106,594) |
Carpooled - Females:
| Northampton: | 7.3% (731) |
| Massachusetts: | 8.6% (127,626) |
Bus - Females:
| Northampton: | 1.1% (112) |
| Massachusetts: | 3.0% (44,354) |
Bicycle - Females:
| Northampton: | 0.8% (83) |
| Massachusetts: | 0.6% (8,296) |
Walked - Females:
| Northampton: | 6.7% (671) |
| Massachusetts: | 5.1% (75,411) |
Other means - Females:
| Northampton: | 0.2% (24) |
| Massachusetts: | 2.2% (32,311) |
Private vehicle occupancy

Drove alone:
| Northampton: | 91.9% (8,382) |
| Massachusetts: | 89.6% (2,238,371) |
In 2 person carpool:
| Northampton: | 6.9% (633) |
| Massachusetts: | 8.0% (200,032) |
In 3 person carpool:
| Northampton: | 0.9% (83) |
| Massachusetts: | 1.3% (31,951) |
In 4 person carpool:
| Northampton: | 0.0% (2) |
| Massachusetts: | 0.6% (14,471) |

Drove alone:
| Northampton: | 90.8% (11,206) |
| Massachusetts: | 89.1% (2,290,258) |
In 2 person carpool:
| Northampton: | 8.2% (1,015) |
| Massachusetts: | 9.0% (230,437) |
In 3 person carpool:
| Northampton: | 0.6% (74) |
| Massachusetts: | 1.2% (30,222) |
In 5-6 person carpool:
| Northampton: | 0.2% (19) |
| Massachusetts: | 0.2% (5,269) |
In 7+ person carpool:
| Northampton: | 0.3% (31) |
| Massachusetts: | 0.1% (3,841) |
Class of workers

Employee of private company:
| Northampton: | 45.1% (6,939) |
| Massachusetts: | 65.0% (2,416,369) |
Self-employed in own incorporated business:
| Northampton: | 2.7% (408) |
| Massachusetts: | 3.4% (126,759) |
Private not-for-profit wage and salary workers:
| Northampton: | 23.6% (3,627) |
| Massachusetts: | 13.4% (499,196) |
Local government workers:
| Northampton: | 7.1% (1,096) |
| Massachusetts: | 7.3% (271,813) |
State government workers:
| Northampton: | 10.2% (1,563) |
| Massachusetts: | 3.6% (134,738) |
Federal government workers:
| Northampton: | 1.2% (185) |
| Massachusetts: | 1.7% (63,827) |
Self-employed workers in own not incorporated business:
| Northampton: | 10.0% (1,533) |
| Massachusetts: | 5.3% (196,965) |
Unpaid family workers:
| Northampton: | 0.1% (18) |
| Massachusetts: | 0.1% (5,156) |

Employee of private company:
| Northampton: | 49.1% (7,996) |
| Massachusetts: | 66.8% (2,112,608) |
Self-employed in own incorporated business:
| Northampton: | 1.7% (284) |
| Massachusetts: | 2.7% (84,530) |
Private not-for-profit wage and salary workers:
| Northampton: | 21.2% (3,454) |
| Massachusetts: | 10.5% (331,510) |
Local government workers:
| Northampton: | 7.9% (1,281) |
| Massachusetts: | 7.5% (236,879) |
State government workers:
| Northampton: | 8.9% (1,446) |
| Massachusetts: | 3.9% (122,041) |
Federal government workers:
| Northampton: | 2.4% (394) |
| Massachusetts: | 2.1% (66,653) |
Self-employed workers in own not incorporated business:
| Northampton: | 8.8% (1,430) |
| Massachusetts: | 6.4% (201,219) |
Unpaid family workers:
| Northampton: | 0.0% (6) |
| Massachusetts: | 0.2% (5,647) |

Employee of private company - Males:
| Northampton: | 55.1% (3,778) |
| Massachusetts: | 69.8% (1,324,965) |
Self-employed in own incorporated business - Males:
| Northampton: | 4.3% (294) |
| Massachusetts: | 4.4% (82,647) |
Private not-for-profit wage and salary workers - Males:
| Northampton: | 13.5% (922) |
| Massachusetts: | 9.6% (181,632) |
Local government workers - Males:
| Northampton: | 5.3% (365) |
| Massachusetts: | 5.2% (99,411) |
State government workers - Males:
| Northampton: | 9.8% (673) |
| Massachusetts: | 3.2% (60,051) |
Federal government workers - Males:
| Northampton: | 1.3% (92) |
| Massachusetts: | 1.9% (36,414) |
Self-employed workers in own not incorporated business - Males:
| Northampton: | 10.6% (729) |
| Massachusetts: | 5.8% (110,558) |

Employee of private company - Females:
| Northampton: | 37.1% (3,161) |
| Massachusetts: | 60.1% (1,091,404) |
Self-employed in own incorporated business - Females:
| Northampton: | 1.3% (114) |
| Massachusetts: | 2.4% (44,112) |
Private not-for-profit wage and salary workers - Females:
| Northampton: | 31.8% (2,705) |
| Massachusetts: | 17.5% (317,564) |
Local government workers - Females:
| Northampton: | 8.6% (731) |
| Massachusetts: | 9.5% (172,402) |
State government workers - Females:
| Northampton: | 10.5% (891) |
| Massachusetts: | 4.1% (74,687) |
Federal government workers - Females:
| Northampton: | 1.1% (92) |
| Massachusetts: | 1.5% (27,413) |
Self-employed workers in own not incorporated business - Females:
| Northampton: | 9.4% (805) |
| Massachusetts: | 4.8% (86,407) |
Unpaid family workers - Females:
| Northampton: | 0.2% (18) |
| Massachusetts: | 0.2% (2,977) |