Work and Jobs in Ocean City, Maryland (MD) Detailed Stats
Occupations, Industries, Unemployment, Workers, Commute
Settings
X


Recent posts about work in Ocean City, Maryland on our local forum with over 2,400,000 registered users:
 | Close to Ocean City? (18 replies) |
| Maryland Among Worst States For Retirement (84 replies) |
| Cumberland MD Pros/Cons? (22 replies) |
| Silly Ocean City Question (27 replies) |
| What year did Ocean City start to get really built up (33 replies) |
| Will Maryland ever do enough to keep retirees from leaving the state? (24 replies) |
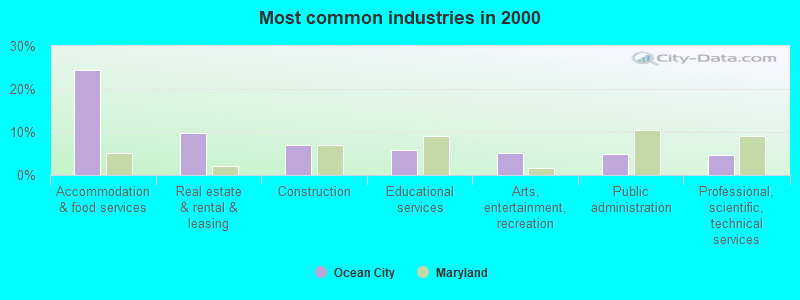
The most common industries in Ocean City are: Accommodation & food services (24.5% of civilian employees), Real estate & rental & leasing (9.7% of civilian employees), Construction (6.9% of civilian employees). 76.1% of workers work in Worcester County and 16.5% of all workers work at home. 60.3% of workers are employees of private companies, which is 3.9% greater than the rate of 57.9% across the entire state of Maryland.
Whole page based on the data from 2000 / 2022 when the population of Ocean City, Maryland was 7,173 / 6,882
Whole page based on the data from 2000 / 2022 when the population of Ocean City, Maryland was 7,173 / 6,882
Most common industries
Most common industries | |||
|---|---|---|---|
Industry | All | Males | Females |
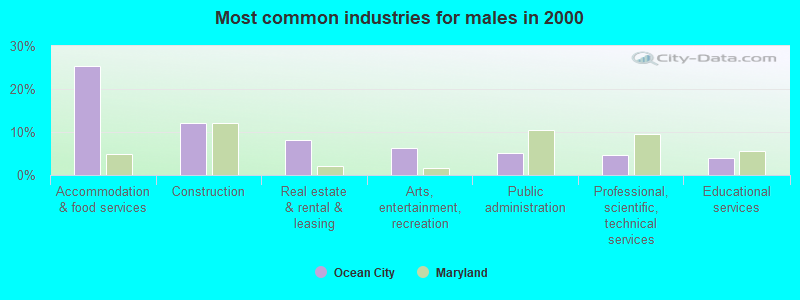
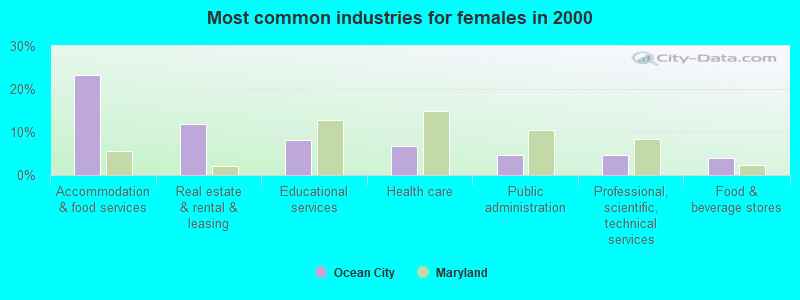
| Accommodation and food services | 24.5% (867) | 25.4% (511) | 23.3% (356) |
| Real estate and rental and leasing | 9.7% (344) | 8.1% (163) | 11.9% (181) |
| Construction | 6.9% (244) | 12.0% (242) | 0.1% (2) |
| Educational services | 5.7% (203) | 3.9% (79) | 8.1% (124) |
| Arts, entertainment, and recreation | 5.0% (178) | 6.4% (128) | 3.3% (50) |
| Public administration | 4.9% (174) | 5.1% (102) | 4.7% (72) |
| Professional, scientific, and technical services | 4.6% (162) | 4.6% (92) | 4.6% (70) |
| Health care | 4.4% (157) | 2.7% (54) | 6.7% (103) |
| Food and beverage stores | 3.0% (107) | 2.4% (48) | 3.9% (59) |
| Finance and insurance | 2.3% (82) | 1.6% (32) | 3.3% (50) |
| Administrative and support and waste management services | 1.7% (60) | 0.8% (17) | 2.8% (43) |
| Broadcasting and telecommunications | 1.7% (60) | 1.1% (23) | 2.4% (37) |
| Repair and maintenance | 1.6% (58) | 2.6% (52) | 0.4% (6) |
| Furniture and home furnishings, and household appliance stores | 1.4% (49) | 1.1% (23) | 1.7% (26) |
| Building material and garden equipment and supplies dealers | 1.2% (43) | 1.8% (36) | 0.5% (7) |
| Personal and laundry services | 1.1% (40) | 0.5% (11) | 1.9% (29) |
| Used merchandise, gift, novelty, and souvenir, and other miscellaneous stores | 1.0% (36) | 0.2% (4) | 2.1% (32) |
| Miscellaneous durable goods merchant wholesalers | 1.0% (34) | 0.9% (19) | 1.0% (15) |
| Sporting goods, camera, and hobby and toy stores | 0.9% (33) | 1.6% (33) | 0.0% (0) |
| Religious, grantmaking, civic, professional, and similar organizations | 0.9% (32) | 1.0% (20) | 0.8% (12) |
| Social assistance | 0.9% (32) | 0.0% (0) | 2.1% (32) |
| Private households | 0.8% (30) | 0.0% (0) | 2.0% (30) |
| Department and other general merchandise stores | 0.8% (29) | 0.7% (14) | 1.0% (15) |
| Other transportation, and support activities, and couriers | 0.8% (29) | 1.4% (29) | 0.0% (0) |
| Publishing, and motion picture and sound recording industries | 0.8% (28) | 0.3% (6) | 1.4% (22) |
| Groceries and related products merchant wholesalers | 0.8% (27) | 1.0% (21) | 0.4% (6) |
| Jewelry, luggage, and leather goods stores | 0.7% (26) | 0.4% (8) | 1.2% (18) |
| Other direct selling establishments | 0.7% (24) | 0.6% (13) | 0.7% (11) |
| Clothing and accessories, including shoe, stores | 0.6% (22) | 0.1% (3) | 1.2% (19) |
| Professional and commercial equipment and supplies merchant wholesalers | 0.6% (21) | 1.0% (21) | 0.0% (0) |
| Alcoholic beverages merchant wholesalers | 0.6% (20) | 1.0% (20) | 0.0% (0) |
| Utilities | 0.6% (20) | 1.0% (20) | 0.0% (0) |
| U. S. Postal service | 0.5% (18) | 0.0% (0) | 1.2% (18) |
| Textile mills and textile products | 0.5% (17) | 0.4% (8) | 0.6% (9) |
| Agriculture, forestry, fishing and hunting | 0.5% (16) | 0.3% (7) | 0.6% (9) |
| Chemicals | 0.5% (16) | 0.0% (0) | 1.0% (16) |
| Health and personal care, except drug, stores | 0.4% (15) | 0.5% (10) | 0.3% (5) |
| Motor vehicle and parts dealers | 0.4% (15) | 0.7% (15) | 0.0% (0) |
| Electronic shopping and mail-order houses | 0.4% (14) | 0.7% (14) | 0.0% (0) |
| Rail transportation | 0.4% (14) | 0.7% (14) | 0.0% (0) |
| Radio, TV, and computer stores | 0.4% (14) | 0.7% (14) | 0.0% (0) |
| Electrical and electronic goods merchant wholesalers | 0.3% (12) | 0.6% (12) | 0.0% (0) |
| Data processing, libraries, and other information services | 0.3% (11) | 0.2% (5) | 0.4% (6) |
| Food | 0.3% (10) | 0.2% (4) | 0.4% (6) |
| Miscellaneous manufacturing | 0.3% (10) | 0.0% (0) | 0.7% (10) |
| Office supplies and stationery stores | 0.3% (9) | 0.4% (9) | 0.0% (0) |
| Machinery | 0.2% (8) | 0.4% (8) | 0.0% (0) |
| Petroleum and petroleum products merchant wholesalers | 0.2% (8) | 0.4% (8) | 0.0% (0) |
| Furniture and related product manufacturing | 0.2% (7) | 0.3% (7) | 0.0% (0) |
| Electrical equipment, appliances, and components | 0.2% (7) | 0.3% (7) | 0.0% (0) |
| Retail florists | 0.2% (6) | 0.0% (0) | 0.4% (6) |
| Vending machine operators | 0.2% (6) | 0.3% (6) | 0.0% (0) |
| Air transportation | 0.2% (6) | 0.3% (6) | 0.0% (0) |
| Plastics and rubber products | 0.2% (6) | 0.0% (0) | 0.4% (6) |
| Motor vehicles, parts and supplies merchant wholesalers | 0.2% (6) | 0.3% (6) | 0.0% (0) |
| Book stores and news dealers | 0.1% (5) | 0.0% (0) | 0.3% (5) |
| Drugs, sundries, and chemical and allied products merchant wholesalers | 0.1% (4) | 0.2% (4) | 0.0% (0) |
| Pharmacies and drug stores | 0.1% (4) | 0.0% (0) | 0.3% (4) |
| Transportation equipment | 0.1% (3) | 0.1% (3) | 0.0% (0) |
Unemployment in Ocean City
- Unemployment by race in 2022
- Unemployment rate for White non-Hispanic residents
- 4.1%Males
- 1.9%Females
- Unemployment rate for Hispanic or Latino residents
- 6.2%Females
- Unemployment by race in 2000
- Unemployment rate for White non-Hispanic residents
- 9.9%Males
- 7.8%Females
- Unemployment rate for two or more race residents
- 22.2%Males
- Unemployment rate for Hispanic or Latino residents
- 52.2%Females
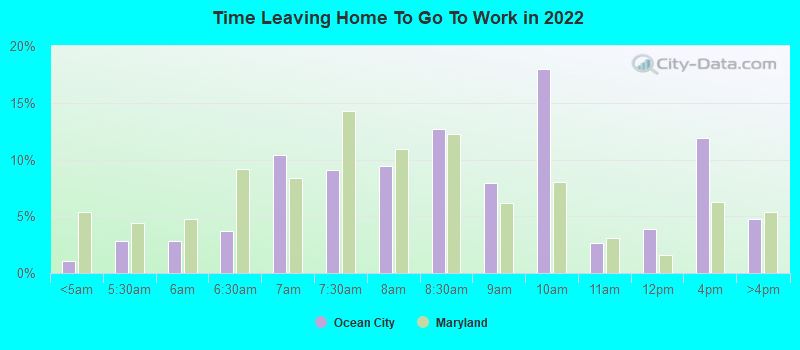
Time leaving home to go to work
12:00 a.m. to 4:59 a.m.:
| Ocean City: | 1.1% (32) |
| Maryland: | 5.4% (137,252) |
5:00 a.m. to 5:29 a.m.:
| Ocean City: | 2.8% (83) |
| Maryland: | 4.4% (112,169) |
5:30 a.m. to 5:59 a.m.:
| Ocean City: | 2.8% (84) |
| Maryland: | 4.8% (121,529) |
6:00 a.m. to 6:29 a.m.:
| Ocean City: | 3.7% (110) |
| Maryland: | 9.1% (231,673) |
6:30 a.m. to 6:59 a.m.:
| Ocean City: | 10.4% (306) |
| Maryland: | 8.3% (211,777) |
7:00 a.m. to 7:29 a.m.:
| Ocean City: | 9.1% (269) |
| Maryland: | 14.3% (362,787) |
7:30 a.m. to 7:59 a.m.:
| Ocean City: | 9.4% (278) |
| Maryland: | 10.9% (277,831) |
8:00 a.m. to 8:29 a.m.:
| Ocean City: | 12.7% (375) |
| Maryland: | 12.2% (310,633) |
8:30 a.m. to 8:59 a.m.:
| Ocean City: | 7.9% (233) |
| Maryland: | 6.2% (157,490) |
9:00 a.m. to 9:59 a.m.:
| Ocean City: | 18.0% (531) |
| Maryland: | 8.0% (204,415) |
10:00 a.m. to 10:59 a.m.:
| Ocean City: | 2.6% (78) |
| Maryland: | 3.0% (77,287) |
11:00 a.m. to 11:59 a.m.:
| Ocean City: | 3.8% (113) |
| Maryland: | 1.6% (40,296) |
12:00 p.m. to 3:59 p.m.:
| Ocean City: | 11.9% (350) |
| Maryland: | 6.3% (159,318) |
4:00 p.m. to 11:59 p.m.:
| Ocean City: | 4.7% (140) |
| Maryland: | 5.3% (135,542) |

<5am:
| Ocean City: | 3.6% (127) |
| Maryland: | 3.0% (77,561) |
5:30am:
| Ocean City: | 0.6% (21) |
| Maryland: | 3.2% (81,972) |
6am:
| Ocean City: | 2.4% (83) |
| Maryland: | 4.7% (120,768) |
6:30am:
| Ocean City: | 3.4% (119) |
| Maryland: | 9.1% (235,203) |
7am:
| Ocean City: | 4.5% (159) |
| Maryland: | 10.3% (267,702) |
7:30am:
| Ocean City: | 11.0% (385) |
| Maryland: | 14.9% (386,941) |
8am:
| Ocean City: | 10.8% (378) |
| Maryland: | 14.3% (370,838) |
8:30am:
| Ocean City: | 11.3% (397) |
| Maryland: | 11.6% (300,061) |
9am:
| Ocean City: | 8.5% (298) |
| Maryland: | 6.0% (154,337) |
10am:
| Ocean City: | 14.1% (496) |
| Maryland: | 5.9% (151,747) |
11am:
| Ocean City: | 4.7% (164) |
| Maryland: | 2.2% (56,218) |
12pm:
| Ocean City: | 2.4% (85) |
| Maryland: | 1.0% (26,260) |
4pm:
| Ocean City: | 6.8% (238) |
| Maryland: | 5.3% (136,187) |
>4pm:
| Ocean City: | 10.3% (362) |
| Maryland: | 5.4% (139,172) |

5:00 a.m. to 5:29 a.m. - Males:
| Ocean City: | 2.5% (35) |
| Maryland: | 5.9% (79,059) |
5:30 a.m. to 5:59 a.m. - Males:
| Ocean City: | 2.5% (35) |
| Maryland: | 5.9% (79,436) |
6:00 a.m. to 6:29 a.m. - Males:
| Ocean City: | 5.1% (72) |
| Maryland: | 10.9% (145,135) |
6:30 a.m. to 6:59 a.m. - Males:
| Ocean City: | 16.0% (227) |
| Maryland: | 8.3% (110,674) |
7:00 a.m. to 7:29 a.m. - Males:
| Ocean City: | 5.9% (84) |
| Maryland: | 13.0% (173,935) |
7:30 a.m. to 7:59 a.m. - Males:
| Ocean City: | 10.5% (149) |
| Maryland: | 9.1% (121,963) |
8:00 a.m. to 8:29 a.m. - Males:
| Ocean City: | 8.8% (125) |
| Maryland: | 11.3% (150,709) |
8:30 a.m. to 8:59 a.m. - Males:
| Ocean City: | 6.4% (91) |
| Maryland: | 4.7% (62,260) |
9:00 a.m. to 9:59 a.m. - Males:
| Ocean City: | 22.6% (321) |
| Maryland: | 7.6% (101,199) |
10:00 a.m. to 10:59 a.m. - Males:
| Ocean City: | 1.2% (17) |
| Maryland: | 2.7% (35,582) |
11:00 a.m. to 11:59 a.m. - Males:
| Ocean City: | 7.7% (109) |
| Maryland: | 1.6% (20,846) |
12:00 p.m. to 3:59 p.m. - Males:
| Ocean City: | 10.2% (144) |
| Maryland: | 6.5% (86,966) |
4:00 p.m. to 11:59 p.m. - Males:
| Ocean City: | 2.4% (34) |
| Maryland: | 5.1% (68,188) |

12:00 a.m. to 4:59 a.m. - Females:
| Ocean City: | 2.0% (31) |
| Maryland: | 3.1% (37,551) |
5:00 a.m. to 5:29 a.m. - Females:
| Ocean City: | 3.2% (49) |
| Maryland: | 2.7% (33,110) |
5:30 a.m. to 5:59 a.m. - Females:
| Ocean City: | 3.1% (47) |
| Maryland: | 3.5% (42,093) |
6:00 a.m. to 6:29 a.m. - Females:
| Ocean City: | 2.5% (38) |
| Maryland: | 7.2% (86,538) |
6:30 a.m. to 6:59 a.m. - Females:
| Ocean City: | 5.3% (81) |
| Maryland: | 8.4% (101,103) |
7:00 a.m. to 7:29 a.m. - Females:
| Ocean City: | 12.1% (186) |
| Maryland: | 15.7% (188,852) |
7:30 a.m. to 7:59 a.m. - Females:
| Ocean City: | 8.3% (128) |
| Maryland: | 12.9% (155,868) |
8:00 a.m. to 8:29 a.m. - Females:
| Ocean City: | 16.1% (246) |
| Maryland: | 13.3% (159,924) |
8:30 a.m. to 8:59 a.m. - Females:
| Ocean City: | 9.3% (143) |
| Maryland: | 7.9% (95,230) |
9:00 a.m. to 9:59 a.m. - Females:
| Ocean City: | 13.9% (213) |
| Maryland: | 8.6% (103,216) |
10:00 a.m. to 10:59 a.m. - Females:
| Ocean City: | 4.0% (62) |
| Maryland: | 3.5% (41,705) |
11:00 a.m. to 11:59 a.m. - Females:
| Ocean City: | 0.5% (8) |
| Maryland: | 1.6% (19,450) |
12:00 p.m. to 3:59 p.m. - Females:
| Ocean City: | 13.3% (204) |
| Maryland: | 6.0% (72,352) |
4:00 p.m. to 11:59 p.m. - Females:
| Ocean City: | 7.0% (107) |
| Maryland: | 5.6% (67,354) |
Travel time to work
Percentage of workers working in this county: 76.1%
Number of people working at home: 614 (16.5% of all workers)
Daytime population change due to commuting: +4,816 (+67.1%)
Workers who live and work in this town: 2,114 (60.2%)
Number of people working at home: 614 (16.5% of all workers)
Daytime population change due to commuting: +4,816 (+67.1%)
Workers who live and work in this town: 2,114 (60.2%)

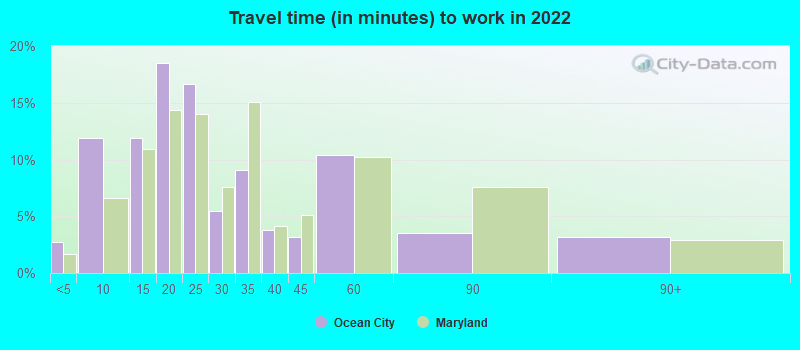

Less than 5 minutes:
| Ocean City: | 2.7% (232) |
| Maryland: | 1.6% (38,588) |
5 to 9 minutes:
| Ocean City: | 11.9% (1,030) |
| Maryland: | 6.6% (154,245) |
10 to 14 minutes:
| Ocean City: | 11.9% (1,028) |
| Maryland: | 10.9% (256,336) |
15 to 19 minutes:
| Ocean City: | 18.5% (1,601) |
| Maryland: | 14.3% (336,664) |
20 to 24 minutes:
| Ocean City: | 16.6% (1,437) |
| Maryland: | 14.0% (328,151) |
25 to 29 minutes:
| Ocean City: | 5.5% (475) |
| Maryland: | 7.5% (176,932) |
30 to 34 minutes:
| Ocean City: | 9.1% (784) |
| Maryland: | 15.1% (354,486) |
35 to 39 minutes:
| Ocean City: | 3.8% (330) |
| Maryland: | 4.1% (97,042) |
40 to 44 minutes:
| Ocean City: | 3.2% (277) |
| Maryland: | 5.1% (120,795) |
45 to 59 minutes:
| Ocean City: | 10.4% (894) |
| Maryland: | 10.2% (239,287) |
60 to 89 minutes:
| Ocean City: | 3.5% (301) |
| Maryland: | 7.6% (177,217) |
90 or more minutes:
| Ocean City: | 3.2% (276) |
| Maryland: | 2.9% (67,235) |


Less than 5 minutes:
| Ocean City: | 7.9% (278) |
| Maryland: | 1.8% (47,843) |
5 to 9 minutes:
| Ocean City: | 20.4% (717) |
| Maryland: | 6.6% (169,884) |
10 to 14 minutes:
| Ocean City: | 19.9% (700) |
| Maryland: | 10.5% (271,204) |
15 to 19 minutes:
| Ocean City: | 11.5% (404) |
| Maryland: | 12.4% (320,679) |
20 to 24 minutes:
| Ocean City: | 7.7% (271) |
| Maryland: | 13.0% (337,452) |
25 to 29 minutes:
| Ocean City: | 3.4% (118) |
| Maryland: | 6.1% (158,702) |
30 to 34 minutes:
| Ocean City: | 7.1% (251) |
| Maryland: | 14.5% (375,140) |
35 to 39 minutes:
| Ocean City: | 2.4% (83) |
| Maryland: | 3.5% (91,893) |
40 to 44 minutes:
| Ocean City: | 3.4% (119) |
| Maryland: | 4.8% (123,823) |
45 to 59 minutes:
| Ocean City: | 6.7% (237) |
| Maryland: | 11.3% (291,586) |
60 to 89 minutes:
| Ocean City: | 1.2% (43) |
| Maryland: | 8.6% (223,613) |
90 or more minutes:
| Ocean City: | 2.6% (91) |
| Maryland: | 3.6% (93,148) |

Less than 5 minutes - Males:
| Ocean City: | 3.2% (154) |
| Maryland: | 1.6% (19,958) |
5 to 9 minutes - Males:
| Ocean City: | 10.6% (507) |
| Maryland: | 5.7% (70,480) |
10 to 14 minutes - Males:
| Ocean City: | 12.1% (580) |
| Maryland: | 9.7% (119,610) |
15 to 19 minutes - Males:
| Ocean City: | 19.2% (919) |
| Maryland: | 13.5% (165,180) |
20 to 24 minutes - Males:
| Ocean City: | 16.5% (793) |
| Maryland: | 12.9% (158,234) |
25 to 29 minutes - Males:
| Ocean City: | 5.1% (245) |
| Maryland: | 7.3% (89,960) |
30 to 34 minutes - Males:
| Ocean City: | 8.7% (417) |
| Maryland: | 15.5% (190,098) |
35 to 39 minutes - Males:
| Ocean City: | 4.2% (203) |
| Maryland: | 4.2% (51,709) |
40 to 44 minutes - Males:
| Ocean City: | 2.8% (132) |
| Maryland: | 5.3% (64,804) |
45 to 59 minutes - Males:
| Ocean City: | 12.1% (580) |
| Maryland: | 11.2% (137,043) |
60 to 89 minutes - Males:
| Ocean City: | 3.4% (161) |
| Maryland: | 9.4% (115,540) |
90 or more minutes - Males:
| Ocean City: | 2.3% (110) |
| Maryland: | 3.6% (44,173) |

Less than 5 minutes - Females:
| Ocean City: | 2.0% (77) |
| Maryland: | 1.7% (18,630) |
5 to 9 minutes - Females:
| Ocean City: | 13.6% (523) |
| Maryland: | 7.5% (83,765) |
10 to 14 minutes - Females:
| Ocean City: | 11.6% (445) |
| Maryland: | 12.2% (136,726) |
15 to 19 minutes - Females:
| Ocean City: | 17.8% (683) |
| Maryland: | 15.3% (171,484) |
20 to 24 minutes - Females:
| Ocean City: | 16.5% (635) |
| Maryland: | 15.2% (169,917) |
25 to 29 minutes - Females:
| Ocean City: | 6.0% (230) |
| Maryland: | 7.8% (86,972) |
30 to 34 minutes - Females:
| Ocean City: | 9.6% (368) |
| Maryland: | 14.7% (164,388) |
35 to 39 minutes - Females:
| Ocean City: | 3.3% (127) |
| Maryland: | 4.0% (45,333) |
40 to 44 minutes - Females:
| Ocean City: | 3.8% (145) |
| Maryland: | 5.0% (55,991) |
45 to 59 minutes - Females:
| Ocean City: | 8.3% (318) |
| Maryland: | 9.1% (102,244) |
60 to 89 minutes - Females:
| Ocean City: | 3.5% (134) |
| Maryland: | 5.5% (61,677) |
90 or more minutes - Females:
| Ocean City: | 4.3% (165) |
| Maryland: | 2.1% (23,062) |
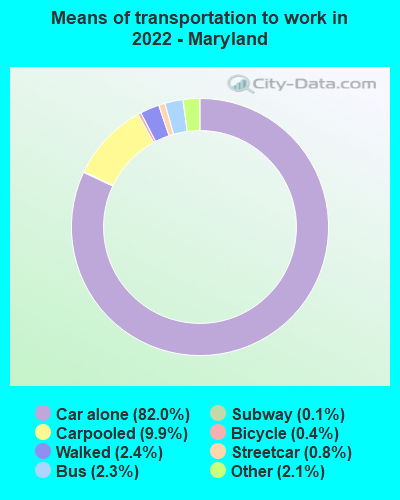
Means of transportation to work
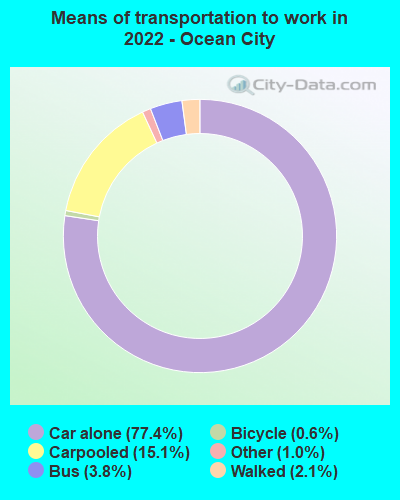
Drove car alone:
| Ocean City: | 77.4% (7,074) |
| Maryland: | 82.0% (909,901) |
Carpooled:
| Ocean City: | 15.1% (1,376) |
| Maryland: | 9.9% (115,593) |
Bus:
| Ocean City: | 3.8% (347) |
| Maryland: | 2.3% (31,481) |
Bicycle:
| Ocean City: | 0.6% (55) |
| Maryland: | 0.4% (2,237) |
Walked:
| Ocean City: | 2.1% (193) |
| Maryland: | 2.4% (24,631) |
Other means:
| Ocean City: | 1.0% (90) |
| Maryland: | 2.1% (25,384) |


Drove car alone:
| Ocean City: | 72.8% (2,557) |
| Maryland: | 73.7% (1,910,917) |
Carpooled:
| Ocean City: | 6.7% (235) |
| Maryland: | 12.4% (320,992) |
Bus or trolley bus:
| Ocean City: | 4.4% (153) |
| Maryland: | 3.6% (93,111) |
Taxicab:
| Ocean City: | 0.7% (25) |
| Maryland: | 0.3% (6,714) |
Bicycle:
| Ocean City: | 1.3% (45) |
| Maryland: | 0.2% (4,843) |
Walked:
| Ocean City: | 6.8% (239) |
| Maryland: | 2.5% (64,852) |
Other means:
| Ocean City: | 1.7% (58) |
| Maryland: | 0.6% (14,621) |

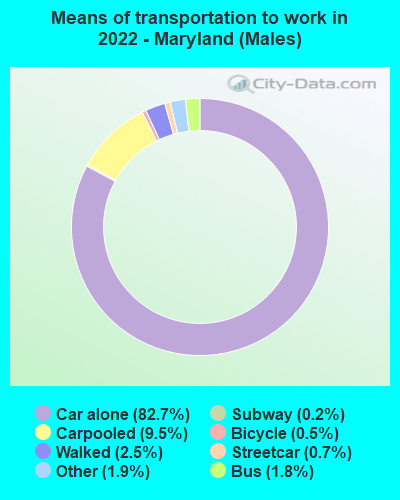
Drove car alone - Males:
| Ocean City: | 76.6% (3,872) |
| Maryland: | 82.7% (909,901) |
Carpooled - Males:
| Ocean City: | 16.1% (814) |
| Maryland: | 9.5% (115,593) |
Bus - Males:
| Ocean City: | 2.5% (127) |
| Maryland: | 1.8% (31,481) |
Bicycle - Males:
| Ocean City: | 0.6% (32) |
| Maryland: | 0.5% (2,237) |
Walked - Males:
| Ocean City: | 2.8% (143) |
| Maryland: | 2.5% (24,631) |
Other means - Males:
| Ocean City: | 1.4% (69) |
| Maryland: | 1.9% (25,384) |

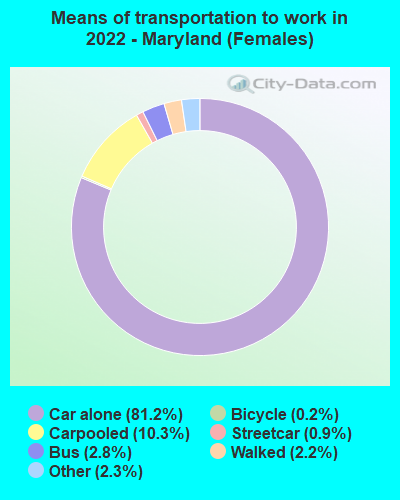
Drove car alone - Females:
| Ocean City: | 78.6% (3,200) |
| Maryland: | 81.2% (909,901) |
Carpooled - Females:
| Ocean City: | 13.8% (560) |
| Maryland: | 10.3% (115,593) |
Bus - Females:
| Ocean City: | 5.4% (220) |
| Maryland: | 2.8% (31,481) |
Bicycle - Females:
| Ocean City: | 0.6% (23) |
| Maryland: | 0.2% (2,237) |
Walked - Females:
| Ocean City: | 1.2% (50) |
| Maryland: | 2.2% (24,631) |
Other means - Females:
| Ocean City: | 0.5% (21) |
| Maryland: | 2.3% (25,384) |
Private vehicle occupancy

Drove alone:
| Ocean City: | 94.6% (2,374) |
| Maryland: | 89.2% (2,046,832) |
In 2 person carpool:
| Ocean City: | 3.1% (77) |
| Maryland: | 8.2% (188,419) |
In 4 person carpool:
| Ocean City: | 0.7% (18) |
| Maryland: | 0.5% (11,805) |
In 5-6 person carpool:
| Ocean City: | 1.4% (36) |
| Maryland: | 0.4% (8,574) |

Drove alone:
| Ocean City: | 91.6% (2,557) |
| Maryland: | 85.6% (1,910,917) |
In 2 person carpool:
| Ocean City: | 7.5% (210) |
| Maryland: | 11.2% (249,591) |
In 3 person carpool:
| Ocean City: | 0.8% (23) |
| Maryland: | 1.9% (43,068) |
In 7+ person carpool:
| Ocean City: | 0.1% (2) |
| Maryland: | 0.3% (6,020) |
Class of workers
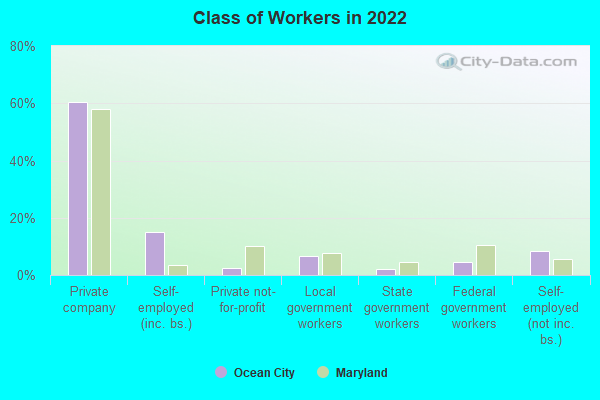
Employee of private company:
| Ocean City: | 60.3% (2,285) |
| Maryland: | 57.9% (1,834,766) |
Self-employed in own incorporated business:
| Ocean City: | 15.2% (575) |
| Maryland: | 3.6% (114,186) |
Private not-for-profit wage and salary workers:
| Ocean City: | 2.3% (88) |
| Maryland: | 10.1% (321,165) |
Local government workers:
| Ocean City: | 6.7% (254) |
| Maryland: | 7.7% (243,652) |
State government workers:
| Ocean City: | 2.1% (80) |
| Maryland: | 4.5% (142,830) |
Federal government workers:
| Ocean City: | 4.6% (176) |
| Maryland: | 10.5% (333,930) |
Self-employed workers in own not incorporated business:
| Ocean City: | 8.3% (316) |
| Maryland: | 5.4% (171,588) |
Unpaid family workers:
| Ocean City: | 0.5% (17) |
| Maryland: | 0.2% (6,301) |

Employee of private company:
| Ocean City: | 65.7% (2,323) |
| Maryland: | 60.5% (1,579,238) |
Self-employed in own incorporated business:
| Ocean City: | 7.1% (252) |
| Maryland: | 3.2% (82,204) |
Private not-for-profit wage and salary workers:
| Ocean City: | 4.5% (158) |
| Maryland: | 8.4% (219,162) |
Local government workers:
| Ocean City: | 6.9% (245) |
| Maryland: | 7.9% (204,895) |
State government workers:
| Ocean City: | 3.3% (116) |
| Maryland: | 4.4% (114,670) |
Federal government workers:
| Ocean City: | 1.1% (39) |
| Maryland: | 10.0% (262,046) |
Self-employed workers in own not incorporated business:
| Ocean City: | 11.1% (392) |
| Maryland: | 5.4% (140,769) |
Unpaid family workers:
| Ocean City: | 0.4% (13) |
| Maryland: | 0.2% (5,473) |

Employee of private company - Males:
| Ocean City: | 64.0% (1,044) |
| Maryland: | 62.1% (1,004,780) |
Self-employed in own incorporated business - Males:
| Ocean City: | 14.8% (241) |
| Maryland: | 4.6% (73,780) |
Private not-for-profit wage and salary workers - Males:
| Ocean City: | 0.2% (3) |
| Maryland: | 7.2% (115,680) |
Local government workers - Males:
| Ocean City: | 4.5% (73) |
| Maryland: | 5.3% (85,832) |
State government workers - Males:
| Ocean City: | 0.5% (8) |
| Maryland: | 3.8% (61,646) |
Federal government workers - Males:
| Ocean City: | 6.0% (97) |
| Maryland: | 10.8% (174,115) |
Self-employed workers in own not incorporated business - Males:
| Ocean City: | 9.1% (148) |
| Maryland: | 6.0% (97,677) |
Unpaid family workers - Males:
| Ocean City: | 1.1% (17) |
| Maryland: | 0.2% (3,498) |

Employee of private company - Females:
| Ocean City: | 57.5% (1,240) |
| Maryland: | 53.5% (829,986) |
Self-employed in own incorporated business - Females:
| Ocean City: | 15.5% (334) |
| Maryland: | 2.6% (40,406) |
Private not-for-profit wage and salary workers - Females:
| Ocean City: | 3.9% (85) |
| Maryland: | 13.2% (205,485) |
Local government workers - Females:
| Ocean City: | 8.4% (181) |
| Maryland: | 10.2% (157,820) |
State government workers - Females:
| Ocean City: | 3.3% (72) |
| Maryland: | 5.2% (81,184) |
Federal government workers - Females:
| Ocean City: | 3.7% (79) |
| Maryland: | 10.3% (159,815) |
Self-employed workers in own not incorporated business - Females:
| Ocean City: | 7.8% (168) |
| Maryland: | 4.8% (73,911) |