Work and Jobs in Perth Amboy, New Jersey (NJ) Detailed Stats
Occupations, Industries, Unemployment, Workers, Commute
Settings
X


Recent posts about work in Perth Amboy, New Jersey on our local forum with over 2,400,000 registered users:
 | New Job in Perth Amboy. What area is near to live? no kids,1500-2000 rent,within 30min Perth Amboy (21 replies) |
| Perth Amboy Crime/Safety??? (13 replies) |
| Where do poor white people in new jersey live? (268 replies) |
| Anybody remember Edison NJ when....... (49 replies) |
| Unemployment Extension Problems (61 replies) |
| Two Questions for people who actually Live in Perth Amboy (16 replies) |
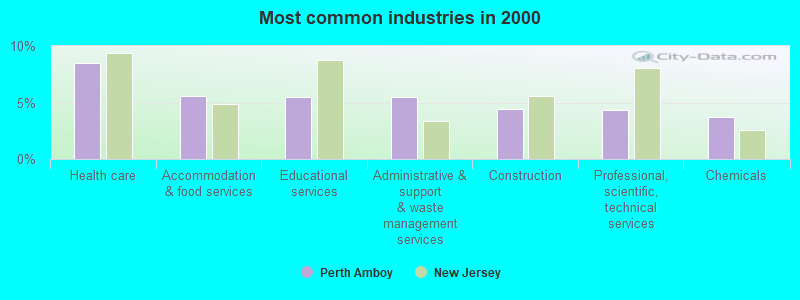
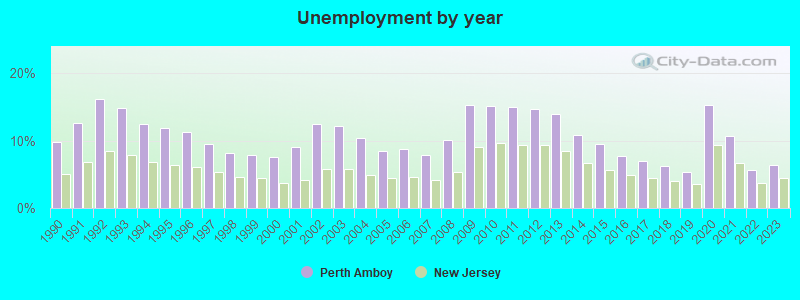
The unemployment rate in 2023 in Perth Amboy, NJ was 6.4%, which was 29.7% greater than the unemployment rate of 4.5% across the entire state of New Jersey. Compared to the unemployment rate of 13.9% in 2013, this represents a decrease of 117.2%. The most common industries in Perth Amboy are: Health care (8.5% of civilian employees), Accommodation & food services (5.6% of civilian employees), Educational services (5.5% of civilian employees). 78.2% of workers work in Middlesex County and 3.8% of all workers work at home. 79.0% of workers are employees of private companies, which is 13.0% greater than the rate of 68.8% across the entire state of New Jersey.
Whole page based on the data from 2000 / 2022 when the population of Perth Amboy, New Jersey was 47,303 / 55,308
Whole page based on the data from 2000 / 2022 when the population of Perth Amboy, New Jersey was 47,303 / 55,308
Most common industries
Most common industries | |||
|---|---|---|---|
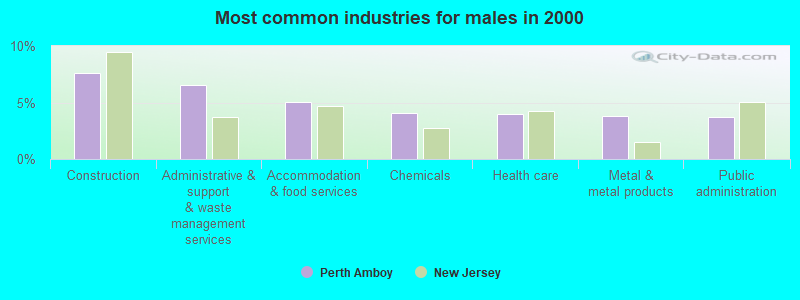
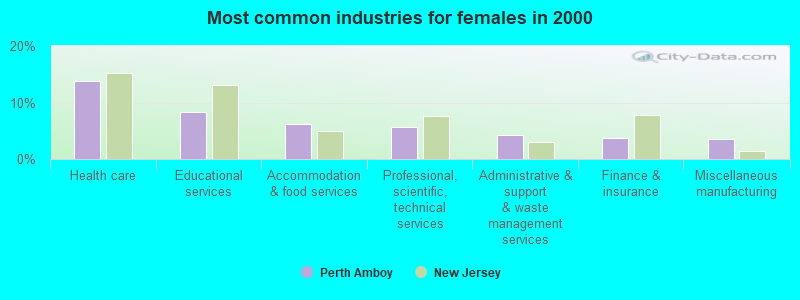
Industry | All | Males | Females |
| Health care | 8.5% (1,593) | 4.0% (398) | 13.8% (1,195) |
| Accommodation and food services | 5.6% (1,049) | 5.0% (507) | 6.3% (542) |
| Educational services | 5.5% (1,028) | 3.1% (309) | 8.3% (719) |
| Administrative and support and waste management services | 5.5% (1,028) | 6.5% (659) | 4.3% (369) |
| Construction | 4.4% (832) | 7.6% (768) | 0.7% (64) |
| Professional, scientific, and technical services | 4.3% (811) | 3.2% (317) | 5.7% (494) |
| Chemicals | 3.7% (692) | 4.1% (413) | 3.2% (279) |
| Public administration | 3.4% (635) | 3.7% (372) | 3.0% (263) |
| Miscellaneous manufacturing | 3.3% (609) | 3.0% (302) | 3.6% (307) |
| Finance and insurance | 3.2% (601) | 2.7% (273) | 3.8% (328) |
| Metal and metal products | 3.0% (564) | 3.8% (384) | 2.1% (180) |
| Food and beverage stores | 2.7% (499) | 3.2% (324) | 2.0% (175) |
| Machinery | 2.5% (473) | 2.2% (225) | 2.9% (248) |
| Other transportation, and support activities, and couriers | 2.4% (445) | 3.2% (326) | 1.4% (119) |
| Department and other general merchandise stores | 2.2% (407) | 1.5% (151) | 3.0% (256) |
| Apparel | 1.9% (361) | 1.3% (127) | 2.7% (234) |
| Repair and maintenance | 1.9% (348) | 3.2% (327) | 0.2% (21) |
| Personal and laundry services | 1.7% (323) | 1.3% (135) | 2.2% (188) |
| Broadcasting and telecommunications | 1.6% (307) | 2.0% (203) | 1.2% (104) |
| Warehousing and storage | 1.6% (306) | 2.4% (246) | 0.7% (60) |
| Truck transportation | 1.6% (297) | 2.7% (275) | 0.3% (22) |
| Real estate and rental and leasing | 1.5% (272) | 1.5% (152) | 1.4% (120) |
| Miscellaneous nondurable goods merchant wholesalers | 1.4% (253) | 1.4% (142) | 1.3% (111) |
| Groceries and related products merchant wholesalers | 1.3% (243) | 2.0% (197) | 0.5% (46) |
| Furniture and related product manufacturing | 1.3% (239) | 0.8% (76) | 1.9% (163) |
| Social assistance | 1.2% (228) | 0.2% (24) | 2.4% (204) |
| Clothing and accessories, including shoe, stores | 1.2% (226) | 0.5% (49) | 2.0% (177) |
| Other direct selling establishments | 1.1% (201) | 1.0% (100) | 1.2% (101) |
| Computer and electronic products | 1.0% (196) | 0.9% (90) | 1.2% (106) |
| Plastics and rubber products | 1.0% (187) | 1.0% (101) | 1.0% (86) |
| Food | 0.9% (176) | 1.4% (141) | 0.4% (35) |
| Religious, grantmaking, civic, professional, and similar organizations | 0.9% (163) | 0.8% (82) | 0.9% (81) |
| Motor vehicle and parts dealers | 0.9% (159) | 1.5% (152) | 0.1% (7) |
| Apparel, fabrics, and notions merchant wholesalers | 0.7% (133) | 0.2% (16) | 1.4% (117) |
| Textile mills and textile products | 0.7% (128) | 0.6% (64) | 0.7% (64) |
| Pharmacies and drug stores | 0.7% (128) | 0.3% (29) | 1.1% (99) |
| Publishing, and motion picture and sound recording industries | 0.7% (125) | 0.4% (44) | 0.9% (81) |
| Printing and related support activities | 0.7% (123) | 0.7% (67) | 0.6% (56) |
| Arts, entertainment, and recreation | 0.6% (119) | 0.7% (68) | 0.6% (51) |
| Furniture and home furnishings, and household appliance stores | 0.6% (117) | 0.7% (73) | 0.5% (44) |
| Utilities | 0.6% (105) | 0.8% (77) | 0.3% (28) |
| Electrical equipment, appliances, and components | 0.5% (98) | 0.4% (44) | 0.6% (54) |
| Private households | 0.5% (96) | 0.2% (24) | 0.8% (72) |
| Transportation equipment | 0.5% (94) | 0.8% (77) | 0.2% (17) |
| U. S. Postal service | 0.5% (93) | 0.7% (69) | 0.3% (24) |
| Electronic shopping and mail-order houses | 0.5% (93) | 0.2% (16) | 0.9% (77) |
| Radio, TV, and computer stores | 0.5% (87) | 0.7% (71) | 0.2% (16) |
| Drugs, sundries, and chemical and allied products merchant wholesalers | 0.5% (86) | 0.5% (54) | 0.4% (32) |
| Nonmetallic mineral products | 0.4% (82) | 0.8% (82) | 0.0% (0) |
| Miscellaneous durable goods merchant wholesalers | 0.4% (81) | 0.5% (46) | 0.4% (35) |
| Used merchandise, gift, novelty, and souvenir, and other miscellaneous stores | 0.4% (80) | 0.6% (59) | 0.2% (21) |
| Machinery, equipment, and supplies merchant wholesalers | 0.4% (74) | 0.5% (50) | 0.3% (24) |
| Electrical and electronic goods merchant wholesalers | 0.4% (70) | 0.5% (54) | 0.2% (16) |
| Air transportation | 0.4% (69) | 0.3% (35) | 0.4% (34) |
| Paper | 0.3% (65) | 0.4% (42) | 0.3% (23) |
| Lumber and other construction materials merchant wholesalers | 0.3% (63) | 0.4% (38) | 0.3% (25) |
| Building material and garden equipment and supplies dealers | 0.3% (62) | 0.4% (42) | 0.2% (20) |
| Data processing, libraries, and other information services | 0.3% (61) | 0.3% (33) | 0.3% (28) |
| Professional and commercial equipment and supplies merchant wholesalers | 0.3% (59) | 0.3% (27) | 0.4% (32) |
| Wood products | 0.3% (59) | 0.6% (59) | 0.0% (0) |
| Music stores | 0.3% (52) | 0.3% (33) | 0.2% (19) |
| Gasoline stations | 0.2% (45) | 0.4% (45) | 0.0% (0) |
| Petroleum and coal products | 0.2% (35) | 0.3% (28) | 0.1% (7) |
| Motor vehicles, parts and supplies merchant wholesalers | 0.2% (34) | 0.3% (30) | 0.0% (4) |
| Book stores and news dealers | 0.2% (33) | 0.3% (26) | 0.1% (7) |
| Recyclable material merchant wholesalers | 0.1% (26) | 0.3% (26) | 0.0% (0) |
| Furniture and home furnishing merchant wholesalers | 0.1% (25) | 0.1% (13) | 0.1% (12) |
| Sporting goods, camera, and hobby and toy stores | 0.1% (24) | 0.2% (24) | 0.0% (0) |
| Office supplies and stationery stores | 0.1% (22) | 0.2% (17) | 0.1% (5) |
| Paper and paper products merchant wholesalers | 0.1% (22) | 0.1% (14) | 0.1% (8) |
| Hardware, plumbing and heating equipment, and supplies merchant wholesalers | 0.1% (20) | 0.2% (20) | 0.0% (0) |
| Health and personal care, except drug, stores | 0.1% (19) | 0.0% (4) | 0.2% (15) |
| Alcoholic beverages merchant wholesalers | 0.1% (18) | 0.2% (18) | 0.0% (0) |
| Fuel dealers | 0.1% (12) | 0.1% (12) | 0.0% (0) |
Unemployment in Perth Amboy
- Unemployment by race in 2022
- Unemployment rate for White non-Hispanic residents
- 3.0%Males
- 0.5%Females
- Unemployment rate for Black residents
- 33.4%Males
- Unemployment rate for American Indian and Alaska Native residents
- 36.4%Females
- Unemployment rate for Asian residents
- 12.0%Males
- 1.9%Females
- Unemployment rate for other race residents
- 13.9%Males
- 11.5%Females
- Unemployment rate for two or more race residents
- 6.7%Males
- 14.1%Females
- Unemployment rate for Hispanic or Latino residents
- 11.4%Males
- 10.1%Females
- Unemployment by race in 2000
- Unemployment rate for White non-Hispanic residents
- 9.9%Males
- 7.7%Females
- Unemployment rate for Black residents
- 10.8%Males
- 7.7%Females
- Unemployment rate for American Indian and Alaska Native residents
- 35.4%Males
- Unemployment rate for other race residents
- 10.0%Males
- 14.5%Females
- Unemployment rate for two or more race residents
- 9.7%Males
- 16.0%Females
- Unemployment rate for Hispanic or Latino residents
- 10.4%Males
- 13.8%Females
Unemployment in 2023:
| Perth Amboy: | 6.4% |
| New Jersey: | 4.5% |
Unemployment in 2022:
| Perth Amboy: | 5.6% |
| New Jersey: | 3.7% |
Unemployment in 2021:
| Perth Amboy: | 10.7% |
| New Jersey: | 6.6% |
Unemployment in 2020:
| Perth Amboy: | 15.2% |
| New Jersey: | 9.4% |
Unemployment in 2019:
| Perth Amboy: | 5.4% |
| New Jersey: | 3.5% |
Unemployment in 2018:
| Perth Amboy: | 6.2% |
| New Jersey: | 4.0% |
Unemployment in 2017:
| Perth Amboy: | 7.0% |
| New Jersey: | 4.5% |
Unemployment in 2016:
| Perth Amboy: | 7.7% |
| New Jersey: | 4.9% |
Unemployment in 2015:
| Perth Amboy: | 9.5% |
| New Jersey: | 5.7% |
Unemployment in 2014:
| Perth Amboy: | 10.8% |
| New Jersey: | 6.7% |
Unemployment in 2013:
| Perth Amboy: | 13.9% |
| New Jersey: | 8.4% |
Unemployment in 2012:
| Perth Amboy: | 14.6% |
| New Jersey: | 9.4% |
Unemployment in 2011:
| Perth Amboy: | 14.9% |
| New Jersey: | 9.4% |
Unemployment in 2010:
| Perth Amboy: | 15.1% |
| New Jersey: | 9.7% |
Unemployment in 2009:
| Perth Amboy: | 15.3% |
| New Jersey: | 9.0% |
Unemployment in 2008:
| Perth Amboy: | 10.1% |
| New Jersey: | 5.4% |
Unemployment in 2007:
| Perth Amboy: | 7.8% |
| New Jersey: | 4.2% |
Unemployment in 2006:
| Perth Amboy: | 8.7% |
| New Jersey: | 4.6% |
Unemployment in 2005:
| Perth Amboy: | 8.5% |
| New Jersey: | 4.4% |
Unemployment in 2004:
| Perth Amboy: | 10.3% |
| New Jersey: | 4.9% |
Unemployment in 2003:
| Perth Amboy: | 12.2% |
| New Jersey: | 5.8% |
Unemployment in 2002:
| Perth Amboy: | 12.4% |
| New Jersey: | 5.8% |
Unemployment in 2001:
| Perth Amboy: | 9.0% |
| New Jersey: | 4.2% |
Unemployment in 2000:
| Perth Amboy: | 7.6% |
| New Jersey: | 3.7% |
Unemployment in 1999:
| Perth Amboy: | 7.9% |
| New Jersey: | 4.4% |
Unemployment in 1998:
| Perth Amboy: | 8.2% |
| New Jersey: | 4.6% |
Unemployment in 1997:
| Perth Amboy: | 9.5% |
| New Jersey: | 5.3% |
Unemployment in 1996:
| Perth Amboy: | 11.2% |
| New Jersey: | 6.1% |
Unemployment in 1995:
| Perth Amboy: | 11.9% |
| New Jersey: | 6.4% |
Unemployment in 1994:
| Perth Amboy: | 12.5% |
| New Jersey: | 6.8% |
Unemployment in 1993:
| Perth Amboy: | 14.8% |
| New Jersey: | 7.8% |
Unemployment in 1992:
| Perth Amboy: | 16.1% |
| New Jersey: | 8.5% |
Unemployment in 1991:
| Perth Amboy: | 12.6% |
| New Jersey: | 6.8% |
Unemployment in 1990:
| Perth Amboy: | 9.8% |
| New Jersey: | 5.1% |
Time leaving home to go to work

12:00 a.m. to 4:59 a.m.:
| Perth Amboy: | 9.5% (2,206) |
| New Jersey: | 3.8% (147,155) |
5:00 a.m. to 5:29 a.m.:
| Perth Amboy: | 4.3% (1,008) |
| New Jersey: | 2.8% (107,136) |
5:30 a.m. to 5:59 a.m.:
| Perth Amboy: | 3.9% (894) |
| New Jersey: | 4.0% (154,533) |
6:00 a.m. to 6:29 a.m.:
| Perth Amboy: | 12.4% (2,886) |
| New Jersey: | 7.9% (305,654) |
6:30 a.m. to 6:59 a.m.:
| Perth Amboy: | 11.3% (2,628) |
| New Jersey: | 8.9% (340,440) |
7:00 a.m. to 7:29 a.m.:
| Perth Amboy: | 13.3% (3,086) |
| New Jersey: | 13.9% (534,088) |
7:30 a.m. to 7:59 a.m.:
| Perth Amboy: | 7.9% (1,838) |
| New Jersey: | 12.3% (471,489) |
8:00 a.m. to 8:29 a.m.:
| Perth Amboy: | 9.7% (2,252) |
| New Jersey: | 14.1% (542,061) |
8:30 a.m. to 8:59 a.m.:
| Perth Amboy: | 3.5% (822) |
| New Jersey: | 7.7% (295,841) |
9:00 a.m. to 9:59 a.m.:
| Perth Amboy: | 3.3% (763) |
| New Jersey: | 8.2% (315,306) |
10:00 a.m. to 10:59 a.m.:
| Perth Amboy: | 4.1% (944) |
| New Jersey: | 3.2% (121,390) |
11:00 a.m. to 11:59 a.m.:
| Perth Amboy: | 2.1% (492) |
| New Jersey: | 1.5% (56,797) |
12:00 p.m. to 3:59 p.m.:
| Perth Amboy: | 6.8% (1,580) |
| New Jersey: | 6.2% (238,009) |
4:00 p.m. to 11:59 p.m.:
| Perth Amboy: | 7.1% (1,641) |
| New Jersey: | 5.6% (215,268) |

<5am:
| Perth Amboy: | 3.9% (715) |
| New Jersey: | 2.4% (92,776) |
5:30am:
| Perth Amboy: | 3.9% (700) |
| New Jersey: | 2.1% (83,147) |
6am:
| Perth Amboy: | 3.7% (666) |
| New Jersey: | 3.2% (124,191) |
6:30am:
| Perth Amboy: | 11.4% (2,070) |
| New Jersey: | 7.7% (297,494) |
7am:
| Perth Amboy: | 12.9% (2,344) |
| New Jersey: | 9.5% (369,088) |
7:30am:
| Perth Amboy: | 12.1% (2,208) |
| New Jersey: | 14.4% (558,435) |
8am:
| Perth Amboy: | 13.0% (2,356) |
| New Jersey: | 15.3% (592,839) |
8:30am:
| Perth Amboy: | 8.6% (1,565) |
| New Jersey: | 14.0% (541,137) |
9am:
| Perth Amboy: | 5.9% (1,075) |
| New Jersey: | 7.6% (295,834) |
10am:
| Perth Amboy: | 4.8% (871) |
| New Jersey: | 6.4% (246,745) |
11am:
| Perth Amboy: | 1.3% (230) |
| New Jersey: | 2.4% (92,391) |
12pm:
| Perth Amboy: | 1.1% (208) |
| New Jersey: | 1.1% (43,997) |
4pm:
| Perth Amboy: | 8.4% (1,522) |
| New Jersey: | 5.5% (213,079) |
>4pm:
| Perth Amboy: | 8.1% (1,465) |
| New Jersey: | 5.6% (218,724) |

12:00 a.m. to 4:59 a.m. - Males:
| Perth Amboy: | 11.6% (1,462) |
| New Jersey: | 4.9% (100,687) |
5:00 a.m. to 5:29 a.m. - Males:
| Perth Amboy: | 5.5% (686) |
| New Jersey: | 4.0% (82,885) |
5:30 a.m. to 5:59 a.m. - Males:
| Perth Amboy: | 3.8% (478) |
| New Jersey: | 5.1% (104,431) |
6:00 a.m. to 6:29 a.m. - Males:
| Perth Amboy: | 15.2% (1,914) |
| New Jersey: | 9.7% (200,451) |
6:30 a.m. to 6:59 a.m. - Males:
| Perth Amboy: | 11.3% (1,416) |
| New Jersey: | 9.3% (191,368) |
7:00 a.m. to 7:29 a.m. - Males:
| Perth Amboy: | 11.3% (1,421) |
| New Jersey: | 14.0% (288,907) |
7:30 a.m. to 7:59 a.m. - Males:
| Perth Amboy: | 3.6% (452) |
| New Jersey: | 10.9% (224,409) |
8:00 a.m. to 8:29 a.m. - Males:
| Perth Amboy: | 10.1% (1,275) |
| New Jersey: | 12.2% (251,968) |
8:30 a.m. to 8:59 a.m. - Males:
| Perth Amboy: | 2.6% (324) |
| New Jersey: | 6.5% (133,460) |
9:00 a.m. to 9:59 a.m. - Males:
| Perth Amboy: | 1.7% (212) |
| New Jersey: | 7.2% (148,957) |
10:00 a.m. to 10:59 a.m. - Males:
| Perth Amboy: | 5.2% (649) |
| New Jersey: | 2.8% (58,200) |
11:00 a.m. to 11:59 a.m. - Males:
| Perth Amboy: | 2.2% (275) |
| New Jersey: | 1.4% (29,175) |
12:00 p.m. to 3:59 p.m. - Males:
| Perth Amboy: | 6.8% (851) |
| New Jersey: | 6.2% (126,671) |
4:00 p.m. to 11:59 p.m. - Males:
| Perth Amboy: | 8.3% (1,046) |
| New Jersey: | 5.7% (117,720) |

12:00 a.m. to 4:59 a.m. - Females:
| Perth Amboy: | 7.1% (752) |
| New Jersey: | 2.6% (46,468) |
5:00 a.m. to 5:29 a.m. - Females:
| Perth Amboy: | 2.9% (312) |
| New Jersey: | 1.4% (24,251) |
5:30 a.m. to 5:59 a.m. - Females:
| Perth Amboy: | 4.0% (430) |
| New Jersey: | 2.8% (50,102) |
6:00 a.m. to 6:29 a.m. - Females:
| Perth Amboy: | 9.2% (973) |
| New Jersey: | 5.9% (105,203) |
6:30 a.m. to 6:59 a.m. - Females:
| Perth Amboy: | 11.4% (1,213) |
| New Jersey: | 8.3% (149,072) |
7:00 a.m. to 7:29 a.m. - Females:
| Perth Amboy: | 15.2% (1,610) |
| New Jersey: | 13.7% (245,181) |
7:30 a.m. to 7:59 a.m. - Females:
| Perth Amboy: | 12.7% (1,350) |
| New Jersey: | 13.8% (247,080) |
8:00 a.m. to 8:29 a.m. - Females:
| Perth Amboy: | 9.3% (984) |
| New Jersey: | 16.2% (290,093) |
8:30 a.m. to 8:59 a.m. - Females:
| Perth Amboy: | 4.7% (497) |
| New Jersey: | 9.1% (162,381) |
9:00 a.m. to 9:59 a.m. - Females:
| Perth Amboy: | 5.4% (576) |
| New Jersey: | 9.3% (166,349) |
10:00 a.m. to 10:59 a.m. - Females:
| Perth Amboy: | 2.8% (295) |
| New Jersey: | 3.5% (63,190) |
11:00 a.m. to 11:59 a.m. - Females:
| Perth Amboy: | 1.8% (190) |
| New Jersey: | 1.5% (27,622) |
12:00 p.m. to 3:59 p.m. - Females:
| Perth Amboy: | 6.9% (729) |
| New Jersey: | 6.2% (111,338) |
4:00 p.m. to 11:59 p.m. - Females:
| Perth Amboy: | 5.6% (595) |
| New Jersey: | 5.5% (97,548) |
Travel time to work
Percentage of workers working in this county: 78.2%
Number of people working at home: 949 (3.8% of all workers)
Daytime population change due to commuting: -6,497 (-13.7%)
Workers who live and work in this city: 4,535 (25.0%)
Number of people working at home: 949 (3.8% of all workers)
Daytime population change due to commuting: -6,497 (-13.7%)
Workers who live and work in this city: 4,535 (25.0%)

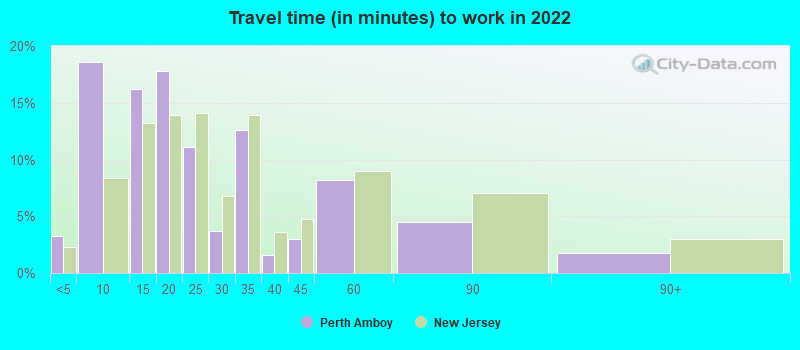

Less than 5 minutes:
| Perth Amboy: | 3.3% (465) |
| New Jersey: | 2.3% (81,825) |
5 to 9 minutes:
| Perth Amboy: | 18.6% (2,628) |
| New Jersey: | 8.3% (298,192) |
10 to 14 minutes:
| Perth Amboy: | 16.2% (2,287) |
| New Jersey: | 13.3% (473,288) |
15 to 19 minutes:
| Perth Amboy: | 17.8% (2,510) |
| New Jersey: | 13.9% (498,065) |
20 to 24 minutes:
| Perth Amboy: | 11.1% (1,564) |
| New Jersey: | 14.1% (502,432) |
25 to 29 minutes:
| Perth Amboy: | 3.7% (527) |
| New Jersey: | 6.8% (242,857) |
30 to 34 minutes:
| Perth Amboy: | 12.6% (1,776) |
| New Jersey: | 13.9% (496,723) |
35 to 39 minutes:
| Perth Amboy: | 1.6% (223) |
| New Jersey: | 3.6% (130,069) |
40 to 44 minutes:
| Perth Amboy: | 3.0% (420) |
| New Jersey: | 4.7% (168,760) |
45 to 59 minutes:
| Perth Amboy: | 8.2% (1,162) |
| New Jersey: | 9.0% (320,422) |
60 to 89 minutes:
| Perth Amboy: | 4.5% (632) |
| New Jersey: | 7.1% (252,432) |
90 or more minutes:
| Perth Amboy: | 1.8% (252) |
| New Jersey: | 3.0% (106,190) |


Less than 5 minutes:
| Perth Amboy: | 2.3% (421) |
| New Jersey: | 2.6% (99,241) |
5 to 9 minutes:
| Perth Amboy: | 12.5% (2,273) |
| New Jersey: | 9.0% (347,598) |
10 to 14 minutes:
| Perth Amboy: | 15.4% (2,803) |
| New Jersey: | 12.5% (482,988) |
15 to 19 minutes:
| Perth Amboy: | 17.5% (3,177) |
| New Jersey: | 13.2% (510,571) |
20 to 24 minutes:
| Perth Amboy: | 15.7% (2,851) |
| New Jersey: | 12.8% (497,467) |
25 to 29 minutes:
| Perth Amboy: | 4.8% (874) |
| New Jersey: | 5.4% (210,226) |
30 to 34 minutes:
| Perth Amboy: | 13.8% (2,500) |
| New Jersey: | 12.7% (492,539) |
35 to 39 minutes:
| Perth Amboy: | 2.1% (388) |
| New Jersey: | 2.8% (109,571) |
40 to 44 minutes:
| Perth Amboy: | 2.1% (382) |
| New Jersey: | 4.0% (156,148) |
45 to 59 minutes:
| Perth Amboy: | 6.3% (1,144) |
| New Jersey: | 9.1% (352,609) |
60 to 89 minutes:
| Perth Amboy: | 3.7% (668) |
| New Jersey: | 8.7% (335,777) |
90 or more minutes:
| Perth Amboy: | 2.8% (514) |
| New Jersey: | 4.5% (175,142) |

Less than 5 minutes - Males:
| Perth Amboy: | 2.3% (153) |
| New Jersey: | 2.3% (44,228) |
5 to 9 minutes - Males:
| Perth Amboy: | 24.4% (1,657) |
| New Jersey: | 7.0% (133,825) |
10 to 14 minutes - Males:
| Perth Amboy: | 9.4% (635) |
| New Jersey: | 11.3% (215,430) |
15 to 19 minutes - Males:
| Perth Amboy: | 16.5% (1,119) |
| New Jersey: | 13.4% (254,987) |
20 to 24 minutes - Males:
| Perth Amboy: | 9.8% (663) |
| New Jersey: | 13.8% (262,577) |
25 to 29 minutes - Males:
| Perth Amboy: | 3.7% (252) |
| New Jersey: | 6.3% (119,569) |
30 to 34 minutes - Males:
| Perth Amboy: | 14.4% (974) |
| New Jersey: | 14.4% (275,270) |
35 to 39 minutes - Males:
| Perth Amboy: | 1.8% (119) |
| New Jersey: | 4.0% (76,254) |
40 to 44 minutes - Males:
| Perth Amboy: | 3.6% (244) |
| New Jersey: | 5.2% (99,982) |
45 to 59 minutes - Males:
| Perth Amboy: | 11.1% (753) |
| New Jersey: | 9.9% (187,910) |
60 to 89 minutes - Males:
| Perth Amboy: | 4.5% (305) |
| New Jersey: | 8.8% (167,057) |
90 or more minutes - Males:
| Perth Amboy: | 1.6% (110) |
| New Jersey: | 3.7% (70,611) |

Less than 5 minutes - Females:
| Perth Amboy: | 4.0% (290) |
| New Jersey: | 2.3% (37,597) |
5 to 9 minutes - Females:
| Perth Amboy: | 13.5% (989) |
| New Jersey: | 9.9% (164,367) |
10 to 14 minutes - Females:
| Perth Amboy: | 23.5% (1,721) |
| New Jersey: | 15.5% (257,858) |
15 to 19 minutes - Females:
| Perth Amboy: | 18.9% (1,381) |
| New Jersey: | 14.6% (243,078) |
20 to 24 minutes - Females:
| Perth Amboy: | 12.3% (897) |
| New Jersey: | 14.4% (239,855) |
25 to 29 minutes - Females:
| Perth Amboy: | 3.8% (276) |
| New Jersey: | 7.4% (123,288) |
30 to 34 minutes - Females:
| Perth Amboy: | 10.8% (788) |
| New Jersey: | 13.3% (221,453) |
35 to 39 minutes - Females:
| Perth Amboy: | 1.4% (103) |
| New Jersey: | 3.2% (53,815) |
40 to 44 minutes - Females:
| Perth Amboy: | 2.4% (176) |
| New Jersey: | 4.1% (68,778) |
45 to 59 minutes - Females:
| Perth Amboy: | 5.5% (401) |
| New Jersey: | 8.0% (132,512) |
60 to 89 minutes - Females:
| Perth Amboy: | 3.5% (259) |
| New Jersey: | 5.1% (85,375) |
90 or more minutes - Females:
| Perth Amboy: | 2.0% (146) |
| New Jersey: | 2.1% (35,579) |
Means of transportation to work
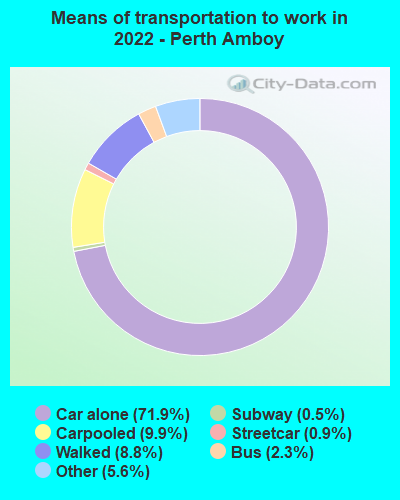

Drove car alone:
| Perth Amboy: | 71.9% (10,467) |
| New Jersey: | 78.3% (1,290,804) |
Carpooled:
| Perth Amboy: | 9.9% (1,443) |
| New Jersey: | 10.5% (178,194) |
Bus:
| Perth Amboy: | 2.3% (341) |
| New Jersey: | 2.6% (51,576) |
Subway or elevated rail:
| Perth Amboy: | 0.9% (138) |
| New Jersey: | 0.7% (10,397) |
Long-distance train or commuter rail:
| Perth Amboy: | 0.5% (71) |
| New Jersey: | 0.6% (9,716) |
Bicycle:
| Perth Amboy: | 0.1% (8) |
| New Jersey: | 0.4% (2,821) |
Walked:
| Perth Amboy: | 8.8% (1,275) |
| New Jersey: | 3.8% (65,269) |
Other means:
| Perth Amboy: | 5.6% (820) |
| New Jersey: | 2.8% (49,284) |

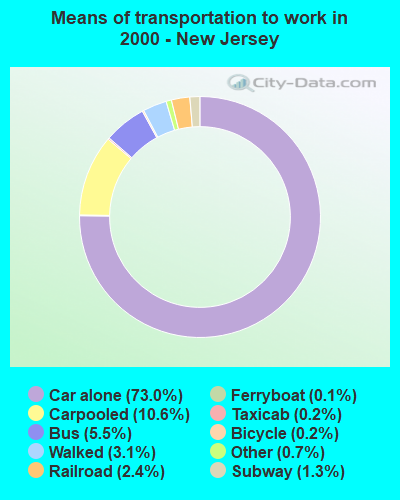
Drove car alone:
| Perth Amboy: | 57.2% (10,396) |
| New Jersey: | 73.0% (2,828,303) |
Carpooled:
| Perth Amboy: | 25.6% (4,658) |
| New Jersey: | 10.6% (412,299) |
Bus or trolley bus:
| Perth Amboy: | 3.3% (605) |
| New Jersey: | 5.5% (213,067) |
Subway or elevated:
| Perth Amboy: | 0.3% (50) |
| New Jersey: | 1.3% (50,279) |
Railroad:
| Perth Amboy: | 1.9% (339) |
| New Jersey: | 2.4% (93,864) |
Taxicab:
| Perth Amboy: | 1.5% (274) |
| New Jersey: | 0.2% (7,879) |
Bicycle:
| Perth Amboy: | 0.4% (64) |
| New Jersey: | 0.2% (9,142) |
Walked:
| Perth Amboy: | 6.6% (1,199) |
| New Jersey: | 3.1% (121,305) |
Other means:
| Perth Amboy: | 2.3% (410) |
| New Jersey: | 0.7% (25,484) |

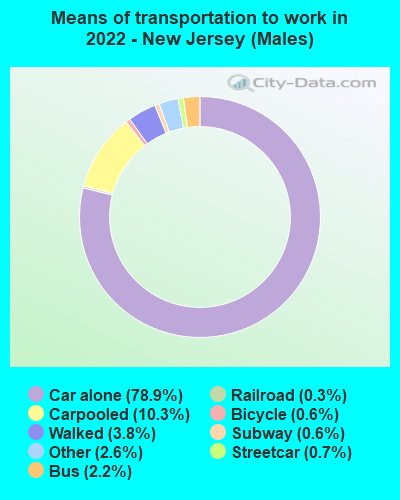
Drove car alone - Males:
| Perth Amboy: | 76.5% (5,362) |
| New Jersey: | 78.9% (1,290,804) |
Carpooled - Males:
| Perth Amboy: | 9.6% (674) |
| New Jersey: | 10.3% (178,194) |
Bus - Males:
| Perth Amboy: | 0.2% (17) |
| New Jersey: | 2.2% (51,576) |
Long-distance train or commuter rail - Males:
| Perth Amboy: | 0.7% (48) |
| New Jersey: | 0.6% (9,716) |
Bicycle - Males:
| Perth Amboy: | 0.1% (8) |
| New Jersey: | 0.6% (2,821) |
Walked - Males:
| Perth Amboy: | 7.7% (542) |
| New Jersey: | 3.8% (65,269) |
Other means - Males:
| Perth Amboy: | 5.1% (358) |
| New Jersey: | 2.6% (49,284) |


Drove car alone - Females:
| Perth Amboy: | 67.6% (5,104) |
| New Jersey: | 77.6% (1,290,804) |
Carpooled - Females:
| Perth Amboy: | 10.2% (768) |
| New Jersey: | 10.7% (178,194) |
Bus - Females:
| Perth Amboy: | 4.3% (323) |
| New Jersey: | 3.1% (51,576) |
Subway or elevated rail - Females:
| Perth Amboy: | 1.8% (137) |
| New Jersey: | 0.6% (10,397) |
Long-distance train or commuter rail - Females:
| Perth Amboy: | 0.3% (23) |
| New Jersey: | 0.6% (9,716) |
Walked - Females:
| Perth Amboy: | 9.7% (732) |
| New Jersey: | 3.9% (65,269) |
Other means - Females:
| Perth Amboy: | 6.1% (462) |
| New Jersey: | 3.0% (49,284) |
Private vehicle occupancy

Drove alone:
| Perth Amboy: | 77.1% (14,330) |
| New Jersey: | 88.1% (2,840,182) |
In 2 person carpool:
| Perth Amboy: | 12.9% (2,404) |
| New Jersey: | 8.5% (274,126) |
In 3 person carpool:
| Perth Amboy: | 5.9% (1,090) |
| New Jersey: | 1.9% (62,756) |
In 4 person carpool:
| Perth Amboy: | 2.6% (491) |
| New Jersey: | 0.9% (27,905) |
In 5-6 person carpool:
| Perth Amboy: | 1.3% (234) |
| New Jersey: | 0.3% (11,091) |
In 7+ person carpool:
| Perth Amboy: | 0.2% (46) |
| New Jersey: | 0.2% (6,421) |

Drove alone:
| Perth Amboy: | 69.1% (10,396) |
| New Jersey: | 87.3% (2,828,303) |
In 2 person carpool:
| Perth Amboy: | 15.9% (2,390) |
| New Jersey: | 9.6% (311,146) |
In 3 person carpool:
| Perth Amboy: | 5.8% (868) |
| New Jersey: | 1.7% (55,192) |
In 4 person carpool:
| Perth Amboy: | 3.5% (532) |
| New Jersey: | 0.7% (21,516) |
In 5-6 person carpool:
| Perth Amboy: | 2.4% (357) |
| New Jersey: | 0.4% (12,963) |
In 7+ person carpool:
| Perth Amboy: | 3.4% (511) |
| New Jersey: | 0.4% (11,482) |
Class of workers

Employee of private company:
| Perth Amboy: | 79.0% (20,710) |
| New Jersey: | 68.8% (3,236,727) |
Self-employed in own incorporated business:
| Perth Amboy: | 1.8% (479) |
| New Jersey: | 4.0% (187,817) |
Private not-for-profit wage and salary workers:
| Perth Amboy: | 4.0% (1,045) |
| New Jersey: | 7.9% (369,959) |
Local government workers:
| Perth Amboy: | 5.9% (1,557) |
| New Jersey: | 8.4% (397,465) |
State government workers:
| Perth Amboy: | 3.2% (842) |
| New Jersey: | 4.1% (190,835) |
Federal government workers:
| Perth Amboy: | 1.9% (491) |
| New Jersey: | 2.0% (94,493) |
Self-employed workers in own not incorporated business:
| Perth Amboy: | 4.0% (1,048) |
| New Jersey: | 4.7% (223,359) |
Unpaid family workers:
| Perth Amboy: | 0.2% (46) |
| New Jersey: | 0.2% (7,135) |

Employee of private company:
| Perth Amboy: | 80.7% (15,092) |
| New Jersey: | 70.6% (2,789,718) |
Self-employed in own incorporated business:
| Perth Amboy: | 1.2% (230) |
| New Jersey: | 3.8% (149,548) |
Private not-for-profit wage and salary workers:
| Perth Amboy: | 4.0% (740) |
| New Jersey: | 6.4% (254,203) |
Local government workers:
| Perth Amboy: | 7.3% (1,372) |
| New Jersey: | 7.9% (311,080) |
State government workers:
| Perth Amboy: | 2.7% (502) |
| New Jersey: | 3.8% (151,067) |
Federal government workers:
| Perth Amboy: | 1.2% (228) |
| New Jersey: | 2.2% (88,294) |
Self-employed workers in own not incorporated business:
| Perth Amboy: | 2.8% (528) |
| New Jersey: | 5.0% (197,664) |
Unpaid family workers:
| Perth Amboy: | 0.0% (6) |
| New Jersey: | 0.2% (8,455) |

Employee of private company - Males:
| Perth Amboy: | 80.8% (11,313) |
| New Jersey: | 72.0% (1,792,593) |
Self-employed in own incorporated business - Males:
| Perth Amboy: | 2.1% (298) |
| New Jersey: | 5.0% (125,798) |
Private not-for-profit wage and salary workers - Males:
| Perth Amboy: | 3.1% (441) |
| New Jersey: | 5.5% (135,866) |
Local government workers - Males:
| Perth Amboy: | 5.1% (719) |
| New Jersey: | 6.3% (156,104) |
State government workers - Males:
| Perth Amboy: | 1.9% (270) |
| New Jersey: | 3.5% (86,712) |
Federal government workers - Males:
| Perth Amboy: | 2.0% (284) |
| New Jersey: | 2.4% (59,437) |
Self-employed workers in own not incorporated business - Males:
| Perth Amboy: | 4.7% (663) |
| New Jersey: | 5.3% (132,027) |
Unpaid family workers - Males:
| Perth Amboy: | 0.1% (20) |
| New Jersey: | 0.1% (2,784) |

Employee of private company - Females:
| Perth Amboy: | 77.0% (9,396) |
| New Jersey: | 65.2% (1,444,134) |
Self-employed in own incorporated business - Females:
| Perth Amboy: | 1.5% (181) |
| New Jersey: | 2.8% (62,019) |
Private not-for-profit wage and salary workers - Females:
| Perth Amboy: | 4.9% (604) |
| New Jersey: | 10.6% (234,093) |
Local government workers - Females:
| Perth Amboy: | 6.9% (838) |
| New Jersey: | 10.9% (241,361) |
State government workers - Females:
| Perth Amboy: | 4.7% (572) |
| New Jersey: | 4.7% (104,123) |
Federal government workers - Females:
| Perth Amboy: | 1.7% (207) |
| New Jersey: | 1.6% (35,056) |
Self-employed workers in own not incorporated business - Females:
| Perth Amboy: | 3.1% (384) |
| New Jersey: | 4.1% (91,332) |
Unpaid family workers - Females:
| Perth Amboy: | 0.2% (27) |
| New Jersey: | 0.2% (4,351) |