Work and Jobs in Philadelphia, Mississippi (MS) Detailed Stats
Occupations, Industries, Unemployment, Workers, Commute
Settings
X


Recent posts about work in Philadelphia, Mississippi on our local forum with over 2,400,000 registered users:
 | All these states complaining about Californians moving there..... (116 replies) |
| Job opportunity in Biloxi. Living for single male in 20s? (5 replies) |
| Mayor BabyChok knows he can't come to Historic Kenny's House (68 replies) |
| California Taxes failed (54 replies) |
| Where should I move to in Mississippi (36 replies) |
| Moving family to Starkville... What's it like? (23 replies) |
Latest news about work in Philadelphia, MS collected exclusively by city-data.com from local newspapers, TV, and radio stations
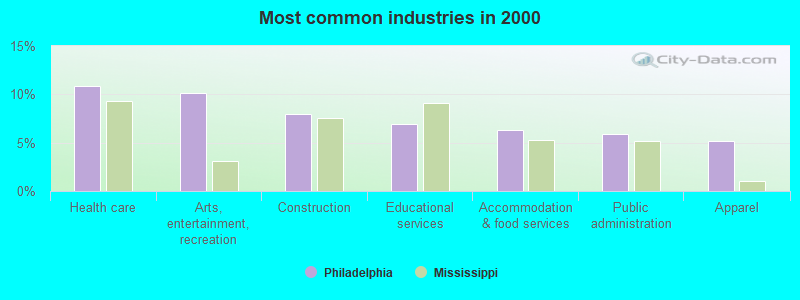
The most common industries in Philadelphia are: Health care (10.9% of civilian employees), Arts, entertainment, recreation (10.2% of civilian employees), Construction (8.0% of civilian employees). 79.0% of workers work in Neshoba County and 5.4% of all workers work at home. 67.5% of workers are employees of private companies, which is 3.3% greater than the rate of 65.3% across the entire state of Mississippi.
Whole page based on the data from 2000 / 2022 when the population of Philadelphia, Mississippi was 7,303 / 7,020
Whole page based on the data from 2000 / 2022 when the population of Philadelphia, Mississippi was 7,303 / 7,020
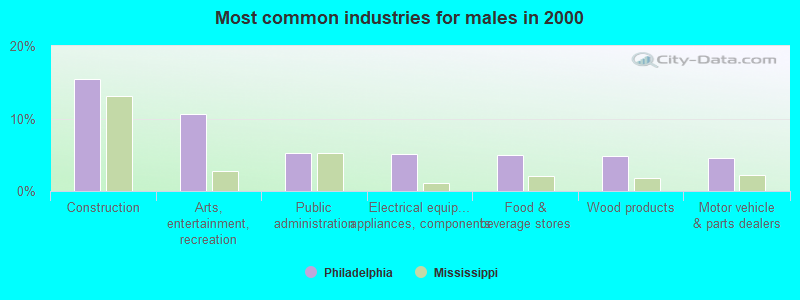
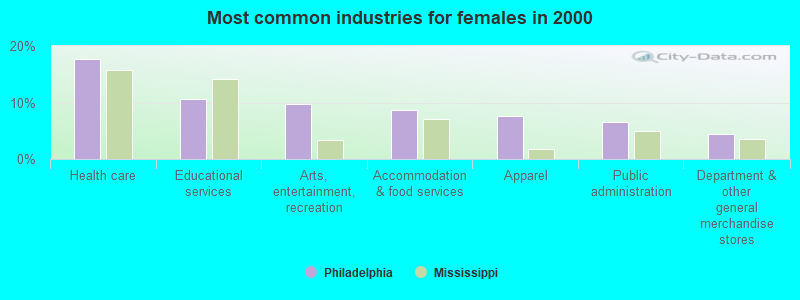
Most common industries
Most common industries | |||
|---|---|---|---|
Industry | All | Males | Females |
| Health care | 10.9% (318) | 3.2% (44) | 17.8% (274) |
| Arts, entertainment, and recreation | 10.2% (297) | 10.6% (146) | 9.8% (151) |
| Construction | 8.0% (233) | 15.5% (214) | 1.2% (19) |
| Educational services | 6.9% (203) | 2.8% (38) | 10.7% (165) |
| Accommodation and food services | 6.3% (185) | 3.6% (50) | 8.7% (135) |
| Public administration | 5.9% (173) | 5.3% (73) | 6.5% (100) |
| Apparel | 5.1% (150) | 2.3% (32) | 7.6% (118) |
| Wood products | 3.3% (97) | 4.9% (67) | 1.9% (30) |
| Electrical equipment, appliances, and components | 3.0% (89) | 5.1% (70) | 1.2% (19) |
| Finance and insurance | 3.0% (89) | 2.2% (31) | 3.8% (58) |
| Department and other general merchandise stores | 3.0% (87) | 1.4% (19) | 4.4% (68) |
| Motor vehicle and parts dealers | 2.8% (83) | 4.6% (63) | 1.3% (20) |
| Administrative and support and waste management services | 2.4% (70) | 3.0% (42) | 1.8% (28) |
| Food and beverage stores | 2.4% (69) | 5.0% (69) | 0.0% (0) |
| Professional, scientific, and technical services | 2.3% (67) | 1.6% (22) | 2.9% (45) |
| Food | 2.1% (62) | 1.3% (18) | 2.9% (44) |
| Agriculture, forestry, fishing and hunting | 1.8% (52) | 3.8% (52) | 0.0% (0) |
| Used merchandise, gift, novelty, and souvenir, and other miscellaneous stores | 1.4% (41) | 1.0% (14) | 1.7% (27) |
| Personal and laundry services | 1.3% (39) | 0.7% (10) | 1.9% (29) |
| Repair and maintenance | 1.3% (37) | 2.7% (37) | 0.0% (0) |
| Real estate and rental and leasing | 1.2% (35) | 0.9% (12) | 1.5% (23) |
| Computer and electronic products | 1.0% (30) | 1.4% (19) | 0.7% (11) |
| Furniture and related product manufacturing | 1.0% (28) | 1.7% (23) | 0.3% (5) |
| Truck transportation | 0.9% (26) | 1.2% (16) | 0.6% (10) |
| Religious, grantmaking, civic, professional, and similar organizations | 0.8% (24) | 1.4% (19) | 0.3% (5) |
| Social assistance | 0.8% (24) | 0.0% (0) | 1.6% (24) |
| Building material and garden equipment and supplies dealers | 0.8% (23) | 1.7% (23) | 0.0% (0) |
| Broadcasting and telecommunications | 0.8% (23) | 0.6% (8) | 1.0% (15) |
| Gasoline stations | 0.7% (20) | 0.4% (5) | 1.0% (15) |
| Other transportation, and support activities, and couriers | 0.6% (19) | 0.5% (7) | 0.8% (12) |
| Furniture and home furnishings, and household appliance stores | 0.6% (18) | 0.4% (6) | 0.8% (12) |
| Clothing and accessories, including shoe, stores | 0.6% (18) | 0.0% (0) | 1.2% (18) |
| Pharmacies and drug stores | 0.5% (16) | 0.7% (10) | 0.4% (6) |
| Metal and metal products | 0.5% (16) | 1.2% (16) | 0.0% (0) |
| Plastics and rubber products | 0.4% (13) | 0.9% (13) | 0.0% (0) |
| Metals and minerals, except petroleum, merchant wholesalers | 0.4% (12) | 0.9% (12) | 0.0% (0) |
| Nonmetallic mineral products | 0.4% (12) | 0.9% (12) | 0.0% (0) |
| Motor vehicles, parts and supplies merchant wholesalers | 0.4% (12) | 0.9% (12) | 0.0% (0) |
| Transportation equipment | 0.4% (11) | 0.4% (5) | 0.4% (6) |
| Groceries and related products merchant wholesalers | 0.4% (11) | 0.8% (11) | 0.0% (0) |
| Private households | 0.4% (11) | 0.0% (0) | 0.7% (11) |
| Utilities | 0.3% (10) | 0.0% (0) | 0.6% (10) |
| Sporting goods, camera, and hobby and toy stores | 0.3% (9) | 0.0% (0) | 0.6% (9) |
| Vending machine operators | 0.3% (9) | 0.7% (9) | 0.0% (0) |
| Miscellaneous manufacturing | 0.3% (8) | 0.0% (0) | 0.5% (8) |
| Printing and related support activities | 0.2% (7) | 0.0% (0) | 0.5% (7) |
| Beverage and tobacco products | 0.2% (6) | 0.0% (0) | 0.4% (6) |
| Fuel dealers | 0.2% (6) | 0.4% (6) | 0.0% (0) |
| Hardware, plumbing and heating equipment, and supplies merchant wholesalers | 0.2% (6) | 0.4% (6) | 0.0% (0) |
| Retail florists | 0.2% (5) | 0.4% (5) | 0.0% (0) |
| Machinery | 0.2% (5) | 0.4% (5) | 0.0% (0) |
| Lumber and other construction materials merchant wholesalers | 0.2% (5) | 0.4% (5) | 0.0% (0) |
| Other direct selling establishments | 0.2% (5) | 0.4% (5) | 0.0% (0) |
Unemployment in Philadelphia
- Unemployment by race in 2022
- Unemployment rate for White non-Hispanic residents
- 1.6%Males
- 4.2%Females
- Unemployment rate for Black residents
- 16.1%Males
- 11.0%Females
- Unemployment by race in 2000
- Unemployment rate for White non-Hispanic residents
- 3.6%Males
- 6.0%Females
- Unemployment rate for Black residents
- 18.5%Males
- 12.2%Females
- Unemployment rate for American Indian and Alaska Native residents
- 29.4%Males
- 23.1%Females
- Unemployment rate for Asian residents
- 22.7%Females
- Unemployment rate for two or more race residents
- 53.3%Females
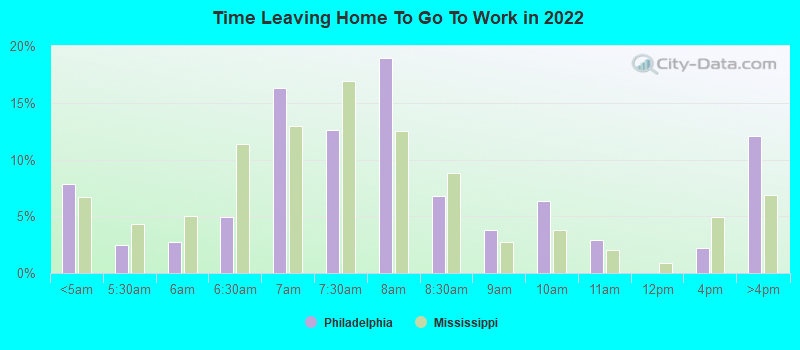
Time leaving home to go to work
12:00 a.m. to 4:59 a.m.:
| Philadelphia: | 7.9% (198) |
| Mississippi: | 6.7% (79,011) |
5:00 a.m. to 5:29 a.m.:
| Philadelphia: | 2.4% (61) |
| Mississippi: | 4.4% (51,439) |
5:30 a.m. to 5:59 a.m.:
| Philadelphia: | 2.8% (70) |
| Mississippi: | 5.0% (59,537) |
6:00 a.m. to 6:29 a.m.:
| Philadelphia: | 5.0% (125) |
| Mississippi: | 11.3% (133,877) |
6:30 a.m. to 6:59 a.m.:
| Philadelphia: | 16.3% (410) |
| Mississippi: | 13.0% (153,080) |
7:00 a.m. to 7:29 a.m.:
| Philadelphia: | 12.6% (317) |
| Mississippi: | 16.9% (200,266) |
7:30 a.m. to 7:59 a.m.:
| Philadelphia: | 19.0% (478) |
| Mississippi: | 12.5% (147,603) |
8:00 a.m. to 8:29 a.m.:
| Philadelphia: | 6.8% (171) |
| Mississippi: | 8.8% (104,457) |
8:30 a.m. to 8:59 a.m.:
| Philadelphia: | 3.8% (95) |
| Mississippi: | 2.7% (32,207) |
9:00 a.m. to 9:59 a.m.:
| Philadelphia: | 6.4% (160) |
| Mississippi: | 3.8% (45,125) |
10:00 a.m. to 10:59 a.m.:
| Philadelphia: | 2.9% (73) |
| Mississippi: | 2.1% (24,276) |
12:00 p.m. to 3:59 p.m.:
| Philadelphia: | 2.2% (56) |
| Mississippi: | 5.0% (58,682) |
4:00 p.m. to 11:59 p.m.:
| Philadelphia: | 12.1% (304) |
| Mississippi: | 6.9% (81,661) |

<5am:
| Philadelphia: | 6.2% (177) |
| Mississippi: | 4.3% (50,086) |
5:30am:
| Philadelphia: | 3.4% (98) |
| Mississippi: | 3.4% (39,399) |
6am:
| Philadelphia: | 1.7% (49) |
| Mississippi: | 5.4% (62,297) |
6:30am:
| Philadelphia: | 6.6% (189) |
| Mississippi: | 10.7% (125,036) |
7am:
| Philadelphia: | 13.8% (397) |
| Mississippi: | 14.0% (163,121) |
7:30am:
| Philadelphia: | 17.1% (492) |
| Mississippi: | 15.7% (182,928) |
8am:
| Philadelphia: | 16.0% (461) |
| Mississippi: | 15.7% (182,414) |
8:30am:
| Philadelphia: | 8.5% (244) |
| Mississippi: | 6.9% (80,436) |
9am:
| Philadelphia: | 4.2% (120) |
| Mississippi: | 2.7% (31,822) |
10am:
| Philadelphia: | 4.0% (114) |
| Mississippi: | 3.4% (39,736) |
11am:
| Philadelphia: | 2.3% (65) |
| Mississippi: | 1.5% (17,812) |
12pm:
| Philadelphia: | 1.6% (46) |
| Mississippi: | 0.8% (9,112) |
4pm:
| Philadelphia: | 7.4% (214) |
| Mississippi: | 6.6% (77,163) |
>4pm:
| Philadelphia: | 6.6% (189) |
| Mississippi: | 6.9% (80,157) |

12:00 a.m. to 4:59 a.m. - Males:
| Philadelphia: | 8.0% (98) |
| Mississippi: | 8.8% (54,252) |
5:00 a.m. to 5:29 a.m. - Males:
| Philadelphia: | 4.8% (59) |
| Mississippi: | 5.9% (36,183) |
5:30 a.m. to 5:59 a.m. - Males:
| Philadelphia: | 1.3% (15) |
| Mississippi: | 6.3% (38,697) |
6:00 a.m. to 6:29 a.m. - Males:
| Philadelphia: | 8.3% (101) |
| Mississippi: | 13.6% (83,465) |
6:30 a.m. to 6:59 a.m. - Males:
| Philadelphia: | 18.3% (223) |
| Mississippi: | 12.8% (78,604) |
7:00 a.m. to 7:29 a.m. - Males:
| Philadelphia: | 9.1% (111) |
| Mississippi: | 15.4% (94,605) |
7:30 a.m. to 7:59 a.m. - Males:
| Philadelphia: | 13.7% (167) |
| Mississippi: | 9.4% (57,558) |
8:00 a.m. to 8:29 a.m. - Males:
| Philadelphia: | 11.6% (141) |
| Mississippi: | 8.2% (50,568) |
8:30 a.m. to 8:59 a.m. - Males:
| Philadelphia: | 2.3% (28) |
| Mississippi: | 2.0% (12,557) |
10:00 a.m. to 10:59 a.m. - Males:
| Philadelphia: | 6.6% (80) |
| Mississippi: | 1.8% (10,900) |
12:00 p.m. to 3:59 p.m. - Males:
| Philadelphia: | 4.5% (55) |
| Mississippi: | 4.7% (28,857) |
4:00 p.m. to 11:59 p.m. - Males:
| Philadelphia: | 11.6% (142) |
| Mississippi: | 6.8% (41,602) |

12:00 a.m. to 4:59 a.m. - Females:
| Philadelphia: | 7.6% (99) |
| Mississippi: | 4.4% (24,759) |
5:30 a.m. to 5:59 a.m. - Females:
| Philadelphia: | 4.2% (54) |
| Mississippi: | 3.7% (20,840) |
6:00 a.m. to 6:29 a.m. - Females:
| Philadelphia: | 1.9% (24) |
| Mississippi: | 8.9% (50,412) |
6:30 a.m. to 6:59 a.m. - Females:
| Philadelphia: | 14.4% (187) |
| Mississippi: | 13.1% (74,476) |
7:00 a.m. to 7:29 a.m. - Females:
| Philadelphia: | 15.7% (203) |
| Mississippi: | 18.6% (105,661) |
7:30 a.m. to 7:59 a.m. - Females:
| Philadelphia: | 24.1% (313) |
| Mississippi: | 15.8% (90,045) |
8:00 a.m. to 8:29 a.m. - Females:
| Philadelphia: | 2.6% (34) |
| Mississippi: | 9.5% (53,889) |
8:30 a.m. to 8:59 a.m. - Females:
| Philadelphia: | 5.2% (67) |
| Mississippi: | 3.5% (19,650) |
9:00 a.m. to 9:59 a.m. - Females:
| Philadelphia: | 11.3% (147) |
| Mississippi: | 4.4% (24,778) |
4:00 p.m. to 11:59 p.m. - Females:
| Philadelphia: | 12.6% (164) |
| Mississippi: | 7.0% (40,059) |
Travel time to work
Percentage of workers working in this county: 79.0%
Number of people working at home: 145 (5.4% of all workers)
Daytime population change due to commuting: +4,007 (+54.9%)
Workers who live and work in this city: 1,773 (61.7%)
Number of people working at home: 145 (5.4% of all workers)
Daytime population change due to commuting: +4,007 (+54.9%)
Workers who live and work in this city: 1,773 (61.7%)


Less than 5 minutes:
| Philadelphia: | 4.1% (255) |
| Mississippi: | 3.6% (40,333) |
5 to 9 minutes:
| Philadelphia: | 22.1% (1,362) |
| Mississippi: | 11.0% (123,571) |
10 to 14 minutes:
| Philadelphia: | 15.4% (952) |
| Mississippi: | 15.1% (169,909) |
15 to 19 minutes:
| Philadelphia: | 11.4% (701) |
| Mississippi: | 16.1% (181,943) |
20 to 24 minutes:
| Philadelphia: | 14.3% (881) |
| Mississippi: | 14.4% (162,587) |
25 to 29 minutes:
| Philadelphia: | 4.2% (257) |
| Mississippi: | 6.2% (70,424) |
30 to 34 minutes:
| Philadelphia: | 10.2% (631) |
| Mississippi: | 13.5% (152,312) |
35 to 39 minutes:
| Philadelphia: | 2.9% (179) |
| Mississippi: | 2.8% (31,739) |
40 to 44 minutes:
| Philadelphia: | 4.7% (287) |
| Mississippi: | 3.1% (34,931) |
45 to 59 minutes:
| Philadelphia: | 4.5% (278) |
| Mississippi: | 6.7% (75,844) |
60 to 89 minutes:
| Philadelphia: | 4.4% (271) |
| Mississippi: | 5.2% (58,101) |
90 or more minutes:
| Philadelphia: | 1.7% (103) |
| Mississippi: | 2.3% (25,653) |


Less than 5 minutes:
| Philadelphia: | 8.5% (243) |
| Mississippi: | 3.7% (43,278) |
5 to 9 minutes:
| Philadelphia: | 23.5% (677) |
| Mississippi: | 12.3% (142,991) |
10 to 14 minutes:
| Philadelphia: | 24.1% (692) |
| Mississippi: | 16.2% (188,931) |
15 to 19 minutes:
| Philadelphia: | 16.6% (477) |
| Mississippi: | 17.0% (197,875) |
20 to 24 minutes:
| Philadelphia: | 10.6% (306) |
| Mississippi: | 14.0% (163,362) |
25 to 29 minutes:
| Philadelphia: | 1.1% (33) |
| Mississippi: | 5.2% (60,981) |
30 to 34 minutes:
| Philadelphia: | 3.9% (111) |
| Mississippi: | 12.7% (147,453) |
35 to 39 minutes:
| Philadelphia: | 0.6% (18) |
| Mississippi: | 2.1% (24,839) |
40 to 44 minutes:
| Philadelphia: | 1.3% (36) |
| Mississippi: | 2.2% (25,310) |
45 to 59 minutes:
| Philadelphia: | 4.7% (134) |
| Mississippi: | 5.9% (68,120) |
60 to 89 minutes:
| Philadelphia: | 3.2% (92) |
| Mississippi: | 3.6% (41,974) |
90 or more minutes:
| Philadelphia: | 1.3% (36) |
| Mississippi: | 3.1% (36,405) |

Less than 5 minutes - Males:
| Philadelphia: | 4.1% (123) |
| Mississippi: | 3.6% (21,093) |
5 to 9 minutes - Males:
| Philadelphia: | 19.6% (582) |
| Mississippi: | 9.8% (56,766) |
10 to 14 minutes - Males:
| Philadelphia: | 17.4% (517) |
| Mississippi: | 14.3% (82,698) |
15 to 19 minutes - Males:
| Philadelphia: | 8.7% (260) |
| Mississippi: | 15.6% (90,243) |
20 to 24 minutes - Males:
| Philadelphia: | 17.9% (531) |
| Mississippi: | 13.7% (79,338) |
25 to 29 minutes - Males:
| Philadelphia: | 5.6% (167) |
| Mississippi: | 6.2% (35,876) |
30 to 34 minutes - Males:
| Philadelphia: | 13.0% (387) |
| Mississippi: | 13.7% (79,499) |
35 to 39 minutes - Males:
| Philadelphia: | 1.7% (49) |
| Mississippi: | 2.7% (15,457) |
40 to 44 minutes - Males:
| Philadelphia: | 2.4% (72) |
| Mississippi: | 3.1% (18,071) |
45 to 59 minutes - Males:
| Philadelphia: | 3.7% (109) |
| Mississippi: | 7.7% (44,412) |
60 to 89 minutes - Males:
| Philadelphia: | 4.1% (123) |
| Mississippi: | 6.6% (38,505) |
90 or more minutes - Males:
| Philadelphia: | 1.1% (32) |
| Mississippi: | 3.0% (17,206) |

Less than 5 minutes - Females:
| Philadelphia: | 4.2% (133) |
| Mississippi: | 3.5% (19,240) |
5 to 9 minutes - Females:
| Philadelphia: | 24.5% (781) |
| Mississippi: | 12.2% (66,805) |
10 to 14 minutes - Females:
| Philadelphia: | 13.7% (436) |
| Mississippi: | 15.9% (87,211) |
15 to 19 minutes - Females:
| Philadelphia: | 13.8% (441) |
| Mississippi: | 16.7% (91,700) |
20 to 24 minutes - Females:
| Philadelphia: | 10.9% (349) |
| Mississippi: | 15.2% (83,249) |
25 to 29 minutes - Females:
| Philadelphia: | 2.9% (92) |
| Mississippi: | 6.3% (34,548) |
30 to 34 minutes - Females:
| Philadelphia: | 7.7% (244) |
| Mississippi: | 13.3% (72,813) |
35 to 39 minutes - Females:
| Philadelphia: | 4.1% (130) |
| Mississippi: | 3.0% (16,282) |
40 to 44 minutes - Females:
| Philadelphia: | 7.3% (232) |
| Mississippi: | 3.1% (16,860) |
45 to 59 minutes - Females:
| Philadelphia: | 5.1% (164) |
| Mississippi: | 5.7% (31,432) |
60 to 89 minutes - Females:
| Philadelphia: | 4.4% (140) |
| Mississippi: | 3.6% (19,596) |
90 or more minutes - Females:
| Philadelphia: | 2.4% (76) |
| Mississippi: | 1.5% (8,447) |
Means of transportation to work
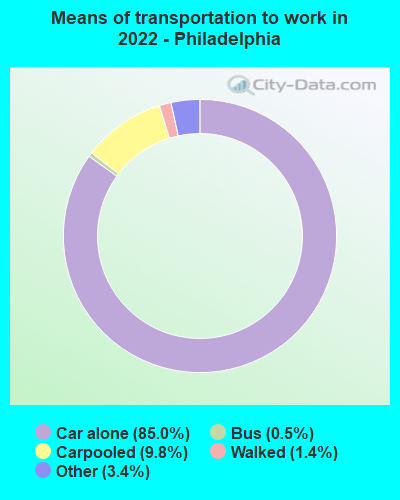

Drove car alone:
| Philadelphia: | 85.0% (5,301) |
| Mississippi: | 86.7% (476,229) |
Carpooled:
| Philadelphia: | 9.8% (608) |
| Mississippi: | 10.3% (57,245) |
Bus:
| Philadelphia: | 0.5% (28) |
| Mississippi: | 0.3% (1,368) |
Walked:
| Philadelphia: | 1.4% (87) |
| Mississippi: | 1.7% (7,350) |
Other means:
| Philadelphia: | 3.4% (211) |
| Mississippi: | 1.0% (5,079) |

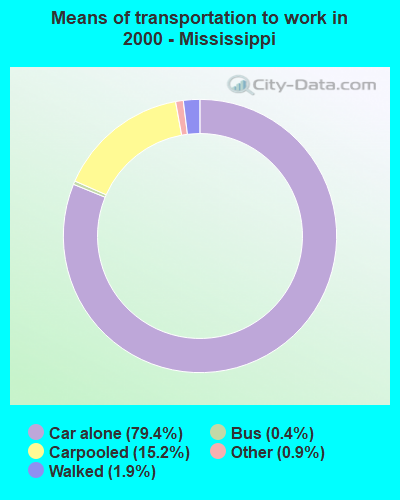
Drove car alone:
| Philadelphia: | 84.1% (2,417) |
| Mississippi: | 79.4% (924,506) |
Carpooled:
| Philadelphia: | 11.4% (328) |
| Mississippi: | 15.2% (176,465) |
Bus or trolley bus:
| Philadelphia: | 1.0% (28) |
| Mississippi: | 0.4% (4,991) |
Walked:
| Philadelphia: | 2.3% (66) |
| Mississippi: | 1.9% (21,868) |
Other means:
| Philadelphia: | 0.6% (16) |
| Mississippi: | 0.9% (10,269) |

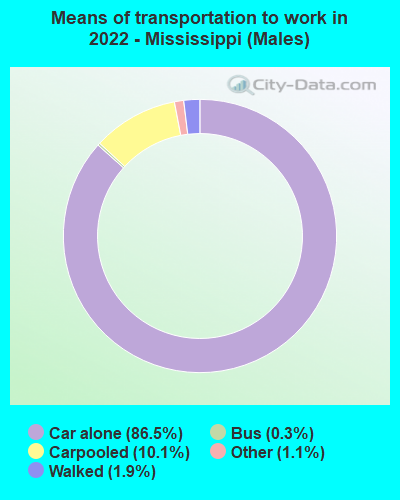
Drove car alone - Males:
| Philadelphia: | 91.1% (2,727) |
| Mississippi: | 86.5% (476,229) |
Carpooled - Males:
| Philadelphia: | 6.2% (184) |
| Mississippi: | 10.1% (57,245) |
Walked - Males:
| Philadelphia: | 1.6% (47) |
| Mississippi: | 1.9% (7,350) |
Other means - Males:
| Philadelphia: | 1.2% (37) |
| Mississippi: | 1.1% (5,079) |

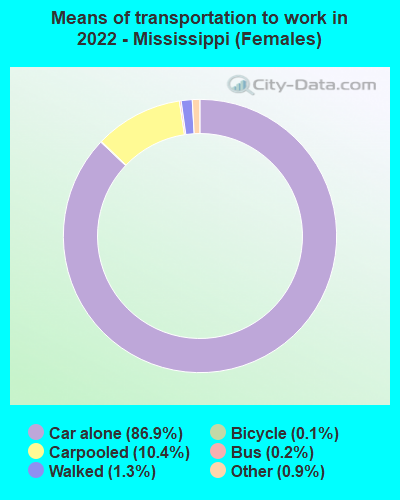
Drove car alone - Females:
| Philadelphia: | 79.5% (2,574) |
| Mississippi: | 86.9% (476,229) |
Carpooled - Females:
| Philadelphia: | 13.1% (423) |
| Mississippi: | 10.4% (57,245) |
Bus - Females:
| Philadelphia: | 0.9% (28) |
| Mississippi: | 0.2% (1,368) |
Walked - Females:
| Philadelphia: | 1.2% (40) |
| Mississippi: | 1.3% (7,350) |
Other means - Females:
| Philadelphia: | 5.4% (174) |
| Mississippi: | 0.9% (5,079) |
Private vehicle occupancy

Drove alone:
| Philadelphia: | 85.3% (1,971) |
| Mississippi: | 89.5% (1,024,151) |
In 2 person carpool:
| Philadelphia: | 11.4% (264) |
| Mississippi: | 7.6% (87,211) |
In 3 person carpool:
| Philadelphia: | 1.0% (23) |
| Mississippi: | 1.9% (21,370) |
In 4 person carpool:
| Philadelphia: | 2.3% (53) |
| Mississippi: | 0.7% (7,502) |

Drove alone:
| Philadelphia: | 88.1% (2,417) |
| Mississippi: | 84.0% (924,506) |
In 2 person carpool:
| Philadelphia: | 7.9% (217) |
| Mississippi: | 12.0% (131,637) |
In 3 person carpool:
| Philadelphia: | 3.2% (87) |
| Mississippi: | 2.4% (26,778) |
In 4 person carpool:
| Philadelphia: | 0.6% (16) |
| Mississippi: | 0.9% (10,226) |
In 5-6 person carpool:
| Philadelphia: | 0.3% (8) |
| Mississippi: | 0.4% (4,859) |
Class of workers
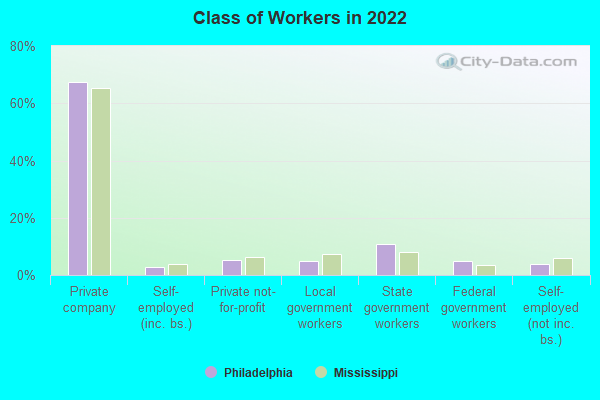
Employee of private company:
| Philadelphia: | 67.5% (1,837) |
| Mississippi: | 65.3% (821,247) |
Self-employed in own incorporated business:
| Philadelphia: | 2.8% (77) |
| Mississippi: | 3.8% (47,388) |
Private not-for-profit wage and salary workers:
| Philadelphia: | 5.3% (144) |
| Mississippi: | 6.2% (77,572) |
Local government workers:
| Philadelphia: | 4.9% (132) |
| Mississippi: | 7.2% (90,424) |
State government workers:
| Philadelphia: | 10.7% (292) |
| Mississippi: | 7.9% (98,947) |
Federal government workers:
| Philadelphia: | 5.0% (135) |
| Mississippi: | 3.5% (43,958) |
Self-employed workers in own not incorporated business:
| Philadelphia: | 3.8% (104) |
| Mississippi: | 6.0% (75,827) |

Employee of private company:
| Philadelphia: | 68.1% (1,991) |
| Mississippi: | 67.9% (796,519) |
Self-employed in own incorporated business:
| Philadelphia: | 3.5% (103) |
| Mississippi: | 3.0% (34,642) |
Private not-for-profit wage and salary workers:
| Philadelphia: | 4.9% (142) |
| Mississippi: | 4.8% (56,264) |
Local government workers:
| Philadelphia: | 7.6% (222) |
| Mississippi: | 6.0% (70,288) |
State government workers:
| Philadelphia: | 5.7% (168) |
| Mississippi: | 8.4% (98,464) |
Federal government workers:
| Philadelphia: | 5.0% (146) |
| Mississippi: | 3.2% (37,771) |
Self-employed workers in own not incorporated business:
| Philadelphia: | 5.1% (148) |
| Mississippi: | 6.4% (75,022) |
Unpaid family workers:
| Philadelphia: | 0.1% (4) |
| Mississippi: | 0.4% (4,344) |

Employee of private company - Males:
| Philadelphia: | 72.9% (911) |
| Mississippi: | 68.3% (437,426) |
Self-employed in own incorporated business - Males:
| Philadelphia: | 5.4% (68) |
| Mississippi: | 4.8% (30,659) |
Private not-for-profit wage and salary workers - Males:
| Philadelphia: | 0.8% (10) |
| Mississippi: | 4.1% (26,314) |
Local government workers - Males:
| Philadelphia: | 2.9% (36) |
| Mississippi: | 5.6% (35,801) |
State government workers - Males:
| Philadelphia: | 9.3% (116) |
| Mississippi: | 5.8% (37,319) |
Federal government workers - Males:
| Philadelphia: | 3.6% (45) |
| Mississippi: | 3.7% (23,587) |
Self-employed workers in own not incorporated business - Males:
| Philadelphia: | 5.1% (64) |
| Mississippi: | 7.5% (48,100) |

Employee of private company - Females:
| Philadelphia: | 62.9% (926) |
| Mississippi: | 62.2% (383,821) |
Self-employed in own incorporated business - Females:
| Philadelphia: | 0.6% (9) |
| Mississippi: | 2.7% (16,729) |
Private not-for-profit wage and salary workers - Females:
| Philadelphia: | 9.1% (134) |
| Mississippi: | 8.3% (51,258) |
Local government workers - Females:
| Philadelphia: | 6.5% (96) |
| Mississippi: | 8.8% (54,623) |
State government workers - Females:
| Philadelphia: | 11.9% (176) |
| Mississippi: | 10.0% (61,628) |
Federal government workers - Females:
| Philadelphia: | 6.1% (90) |
| Mississippi: | 3.3% (20,371) |
Self-employed workers in own not incorporated business - Females:
| Philadelphia: | 2.7% (40) |
| Mississippi: | 4.5% (27,727) |