Work and Jobs in Pinesdale, Montana (MT) Detailed Stats
Data:
Unemployment (%)
Unemployment (% change since 2000)
Unemployment (%) - White
Unemployment (% change since 2000) - White
Unemployment (%) - Black or African American
Unemployment (% change since 2000) - Black or African American
Unemployment (%) - Asian
Unemployment (% change since 2000) - Asian
Unemployment (%) - Hispanic or Latino
Unemployment (% change since 2000) - Hispanic or Latino
Unemployment (%) - American Indian and Alaska Native
Unemployment (% change since 2000) - American Indian and Alaska Native
Unemployment (%) - Multirace
Unemployment (% change since 2000) - Multirace
Unemployment (%) - Other Race
Unemployment (% change since 2000) - Other Race
Industry diversity
Most Common Industries - Agriculture, forestry, fishing and hunting, and mining (%)
Most Common Industries - Agriculture, forestry, fishing and hunting (%)
Most Common Industries - Mining, quarrying, and oil and gas extraction (%)
Most Common Industries - Construction (%)
Most Common Industries - Manufacturing (%)
Most Common Industries - Wholesale trade (%)
Most Common Industries - Retail trade (%)
Most Common Industries - Transportation and warehousing, and utilities (%)
Most Common Industries - Transportation and warehousing (%)
Most Common Industries - Utilities (%)
Most Common Industries - Information (%)
Most Common Industries - Finance and insurance, and real estate and rental and leasing (%)
Most Common Industries - Finance and insurance (%)
Most Common Industries - Real estate and rental and leasing (%)
Most Common Industries - Professional, scientific, and management, and administrative and waste management services (%)
Most Common Industries - Professional, scientific, and technical services (%)
Most Common Industries - Management of companies and enterprises (%)
Most Common Industries - Administrative and support and waste management services (%)
Most Common Industries - Educational services, and health care and social assistance (%)
Most Common Industries - Educational services (%)
Most Common Industries - Health care and social assistance (%)
Most Common Industries - Arts, entertainment, and recreation, and accommodation and food services (%)
Most Common Industries - Arts, entertainment, and recreation (%)
Most Common Industries - Accommodation and food services (%)
Most Common Industries - Other services, except public administration (%)
Most Common Industries - Public administration (%)
Occupation diversity
Most Common Occupations - Management, business, science, and arts occupations (%)
Most Common Occupations - Management, business, and financial occupations (%)
Most Common Occupations - Management occupations (%)
Most Common Occupations - Business and financial operations occupations (%)
Most Common Occupations - Computer, engineering, and science occupations (%)
Most Common Occupations - Computer and mathematical occupations (%)
Most Common Occupations - Architecture and engineering occupations (%)
Most Common Occupations - Life, physical, and social science occupations (%)
Most Common Occupations - Education, legal, community service, arts, and media occupations (%)
Most Common Occupations - Community and social service occupations (%)
Most Common Occupations - Legal occupations (%)
Most Common Occupations - Education, training, and library occupations (%)
Most Common Occupations - Arts, design, entertainment, sports, and media occupations (%)
Most Common Occupations - Healthcare practitioners and technical occupations (%)
Most Common Occupations - Health diagnosing and treating practitioners and other technical occupations (%)
Most Common Occupations - Health technologists and technicians (%)
Most Common Occupations - Service occupations (%)
Most Common Occupations - Healthcare support occupations (%)
Most Common Occupations - Protective service occupations (%)
Most Common Occupations - Fire fighting and prevention, and other protective service workers including supervisors (%)
Most Common Occupations - Law enforcement workers including supervisors (%)
Most Common Occupations - Food preparation and serving related occupations (%)
Most Common Occupations - Building and grounds cleaning and maintenance occupations (%)
Most Common Occupations - Personal care and service occupations (%)
Most Common Occupations - Sales and office occupations (%)
Most Common Occupations - Sales and related occupations (%)
Most Common Occupations - Office and administrative support occupations (%)
Most Common Occupations - Natural resources, construction, and maintenance occupations (%)
Most Common Occupations - Farming, fishing, and forestry occupations (%)
Most Common Occupations - Construction and extraction occupations (%)
Most Common Occupations - Installation, maintenance, and repair occupations (%)
Most Common Occupations - Production, transportation, and material moving occupations (%)
Most Common Occupations - Production occupations (%)
Most Common Occupations - Transportation occupations (%)
Most Common Occupations - Material moving occupations (%)
Private vehicle occupancy - Drove alone (% change since 2000)
Private vehicle occupancy - Carpooled (%)
Private vehicle occupancy - Carpooled (% change since 2000)
Private vehicle occupancy - In 2-person carpool (%)
Private vehicle occupancy - In 2-person carpool (% change since 2000)
Private vehicle occupancy - In 3-person carpool (%)
Private vehicle occupancy - In 3-person carpool (% change since 2000)
Private vehicle occupancy - In 4-person carpool (%)
Private vehicle occupancy - In 4-person carpool (% change since 2000)
Private vehicle occupancy - In 5- or 6-person carpool (%)
Private vehicle occupancy - In 5- or 6-person carpool (% change since 2000)
Private vehicle occupancy - In 7-or-more-person carpool (%)
Private vehicle occupancy - In 7-or-more-person carpool (% change since 2000)
Time Leaving Home To Go To Work - 12:00 a.m. to 4:59 a.m. (%)
Time Leaving Home To Go To Work - 12:00 a.m. to 4:59 a.m. (% change since 2000)
Time Leaving Home To Go To Work - 5:00 a.m. to 5:59 a.m. (%)
Time Leaving Home To Go To Work - 5:00 a.m. to 5:59 a.m. (% change since 2000)
Time Leaving Home To Go To Work - 6:00 a.m. to 6:59 a.m. (%)
Time Leaving Home To Go To Work - 6:00 a.m. to 6:59 a.m. (% change since 2000)
Time Leaving Home To Go To Work - 7:00 a.m. to 7:59 a.m. (%)
Time Leaving Home To Go To Work - 7:00 a.m. to 7:59 a.m. (% change since 2000)
Time Leaving Home To Go To Work - 8:00 a.m. to 8:59 a.m. (%)
Time Leaving Home To Go To Work - 8:00 a.m. to 8:59 a.m. (% change since 2000)
Time Leaving Home To Go To Work - 9:00 a.m. to 9:59 a.m. (%)
Time Leaving Home To Go To Work - 9:00 a.m. to 9:59 a.m. (% change since 2000)
Time Leaving Home To Go To Work - 10:00 a.m. to 10:59 a.m. (%)
Time Leaving Home To Go To Work - 10:00 a.m. to 10:59 a.m. (% change since 2000)
Time Leaving Home To Go To Work - 11:00 a.m. to 11:59 a.m. (%)
Time Leaving Home To Go To Work - 11:00 a.m. to 11:59 a.m. (% change since 2000)
Time Leaving Home To Go To Work - 12:00 p.m. to 3:59 p.m. (%)
Time Leaving Home To Go To Work - 12:00 p.m. to 3:59 p.m. (% change since 2000)
Time Leaving Home To Go To Work - 4:00 p.m. to 11:59 p.m. (%)
Time Leaving Home To Go To Work - 4:00 p.m. to 11:59 p.m. (% change since 2000)
Class of Workers - Employee of private company (%)
Class of Workers - Employee of private company (% change since 2000)
Class of Workers - Self-employed in own incorporated business (%)
Class of Workers - Self-employed in own incorporated business (% change since 2000)
Class of Workers - Private not-for-profit wage and salary workers (%)
Class of Workers - Private not-for-profit wage and salary workers (% change since 2000)
Class of Workers - Local government workers (%)
Class of Workers - Local government workers (% change since 2000)
Class of Workers - State government workers (%)
Class of Workers - State government workers (% change since 2000)
Class of Workers - Federal government workers (%)
Class of Workers - Federal government workers (% change since 2000)
Class of Workers - Self-employed workers in own not incorporated business and Unpaid family workers (%)
Class of Workers - Self-employed workers in own not incorporated business and Unpaid family workers (% change since 2000)
Means of transportation to work - Drove car alone (%)
Means of transportation to work - Drove car alone (% change since 2000)
Means of transportation to work - Carpooled (%)
Means of transportation to work - Carpooled (% change since 2000)
Means of transportation to work - Public transportation (%)
Means of transportation to work - Public transportation (% change since 2000)
Means of transportation to work - Bus or trolley bus (%)
Means of transportation to work - Bus or trolley bus (% change since 2000)
Means of transportation to work - Streetcar or trolley car (%)
Means of transportation to work - Streetcar or trolley car (% change since 2000)
Means of transportation to work - Subway or elevated (%)
Means of transportation to work - Subway or elevated (% change since 2000)
Means of transportation to work - Railroad (%)
Means of transportation to work - Railroad (% change since 2000)
Means of transportation to work - Ferryboat (%)
Means of transportation to work - Ferryboat (% change since 2000)
Means of transportation to work - Taxicab (%)
Means of transportation to work - Taxicab (% change since 2000)
Means of transportation to work - Motorcycle (%)
Means of transportation to work - Motorcycle (% change since 2000)
Means of transportation to work - Bicycle (%)
Means of transportation to work - Bicycle (% change since 2000)
Means of transportation to work - Walked (%)
Means of transportation to work - Walked (% change since 2000)
Means of transportation to work - Other means (%)
Means of transportation to work - Other means (% change since 2000)
Working at home (%)
Working at home (% change since 2000)
Travel time to work - Less than 5 minutes (%)
Travel time to work - Less than 5 minutes (% change since 2000)
Travel time to work - 5 to 9 minutes (%)
Travel time to work - 5 to 9 minutes (% change since 2000)
Travel time to work - 10 to 19 minutes (%)
Travel time to work - 10 to 19 minutes (% change since 2000)
Travel time to work - 20 to 29 minutes (%)
Travel time to work - 20 to 29 minutes (% change since 2000)
Travel time to work - 30 to 39 minutes (%)
Travel time to work - 30 to 39 minutes (% change since 2000)
Travel time to work - 40 to 59 minutes (%)
Travel time to work - 40 to 59 minutes (% change since 2000)
Travel time to work - 60 to 89 minutes (%)
Travel time to work - 60 to 89 minutes (% change since 2000)
Travel time to work - 90 or more minutes (%)
Travel time to work - 90 or more minutes (% change since 2000)
Latest news about work in Pinesdale, MT collected exclusively by city-data.com from local newspapers, TV, and radio stations
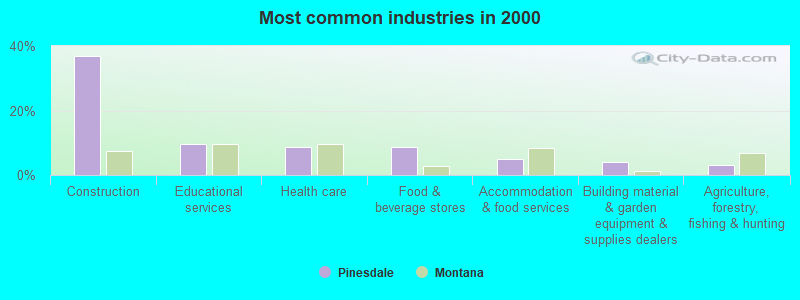
The most common industries in Pinesdale are: Construction (36.9% of civilian employees), Educational services (9.7% of civilian employees), Health care (8.8% of civilian employees). 91.7% of workers work in Ravalli County and 19.4% of all workers work at home. 68.5% of workers are employees of private companies, which is 14.2% greater than the rate of 58.8% across the entire state of Montana.
Whole page based on the data from 2000 / 2022 when the population of Pinesdale, Montana was 742 / 930
Most common industries
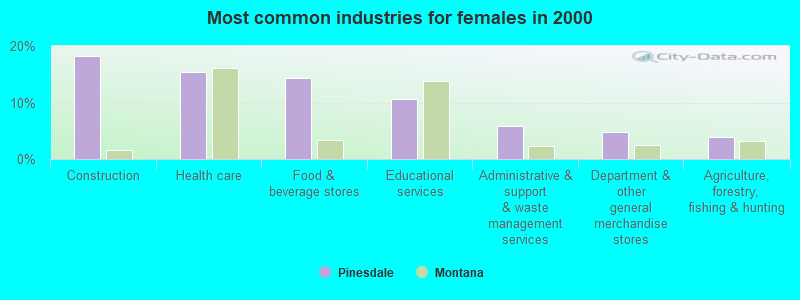
Most common industries Industry All Males Females
Construction 36.9% 54.0% 18.3% Educational services 9.7% 8.8% 10.6% Health care 8.8% 2.7% 15.4% Food and beverage stores 8.8% 3.5% 14.4% Accommodation and food services 5.1% 6.2% 3.8% Building material and garden equipment and supplies dealers 4.1% 5.3% 2.9% Agriculture, forestry, fishing and hunting 3.2% 2.7% 3.8% Administrative and support and waste management services 2.8% 0.0% 5.8% Department and other general merchandise stores 2.3% 0.0% 4.8% Social assistance 1.4% 0.0% 2.9% Apparel 1.4% 0.0% 2.9% Miscellaneous nondurable goods merchant wholesalers 1.4% 0.0% 2.9% Furniture and related product manufacturing 1.4% 2.7% 0.0% U. S. Postal service 1.4% 0.9% 1.9% Truck transportation 1.4% 2.7% 0.0% Used merchandise, gift, novelty, and souvenir, and other miscellaneous stores 0.9% 0.0% 1.9% Food 0.9% 1.8% 0.0% Fuel dealers 0.9% 1.8% 0.0% Miscellaneous manufacturing 0.9% 1.8% 0.0% Personal and laundry services 0.9% 0.0% 1.9% Private households 0.9% 0.0% 1.9% Public administration 0.9% 0.0% 1.9% Printing and related support activities 0.9% 1.8% 0.0% Lumber and other construction materials merchant wholesalers 0.5% 0.9% 0.0% Leather and allied products 0.5% 0.0% 1.0% Textile mills and textile products 0.5% 0.9% 0.0% Radio, TV, and computer stores 0.5% 0.9% 0.0% Furniture and home furnishings, and household appliance stores 0.5% 0.9% 0.0% Repair and maintenance 0.5% 0.0% 1.0%
Unemployment in Pinesdale Unemployment by race in 2022
Unemployment rate for White non-Hispanic residents 0.7% Males0.8% FemalesUnemployment rate for two or more race residents 48.8% MalesUnemployment rate for Hispanic or Latino residents 42.2% MalesUnemployment by race in 2000
Unemployment rate for White non-Hispanic residents 13.7% Males
Time leaving home to go to work 12:00 a.m. to 4:59 a.m.: Pinesdale:
2.7% (9)Montana:
4.4% (21,273)
5:00 a.m. to 5:29 a.m.: Pinesdale:
3.9% (14)Montana:
3.0% (14,350)
5:30 a.m. to 5:59 a.m.: Pinesdale:
3.9% (14)Montana:
4.0% (19,509)
6:00 a.m. to 6:29 a.m.: Pinesdale:
4.4% (16)Montana:
6.5% (31,368)
6:30 a.m. to 6:59 a.m.: Pinesdale:
12.4% (44)Montana:
10.1% (48,669)
7:00 a.m. to 7:29 a.m.: Pinesdale:
9.8% (35)Montana:
13.8% (66,446)
7:30 a.m. to 7:59 a.m.: Pinesdale:
19.5% (70)Montana:
19.2% (92,487)
8:00 a.m. to 8:29 a.m.: Pinesdale:
10.1% (36)Montana:
11.8% (56,678)
8:30 a.m. to 8:59 a.m.: Pinesdale:
13.6% (49)Montana:
5.8% (27,997)
9:00 a.m. to 9:59 a.m.: Pinesdale:
6.1% (22)Montana:
5.8% (28,040)
10:00 a.m. to 10:59 a.m.: Pinesdale:
5.8% (21)Montana:
3.4% (16,558)
11:00 a.m. to 11:59 a.m.: Pinesdale:
0.8% (3)Montana:
1.3% (6,408)
12:00 p.m. to 3:59 p.m.: Pinesdale:
1.4% (5)Montana:
5.7% (27,578)
4:00 p.m. to 11:59 p.m.: Pinesdale:
5.6% (20)Montana:
5.2% (24,909)
<5am: Pinesdale:
3.3% (7)Montana:
2.7% (11,262)
5:30am: Pinesdale:
1.4% (3)Montana:
1.8% (7,411)
6am: Pinesdale:
1.9% (4)Montana:
3.0% (12,480)
6:30am: Pinesdale:
0.5% (1)Montana:
5.1% (21,726)
7am: Pinesdale:
4.7% (10)Montana:
8.4% (35,518)
7:30am: Pinesdale:
9.3% (20)Montana:
13.3% (56,115)
8am: Pinesdale:
22.9% (49)Montana:
21.4% (90,201)
8:30am: Pinesdale:
21.0% (45)Montana:
11.7% (49,381)
9am: Pinesdale:
8.9% (19)Montana:
5.0% (20,912)
10am: Pinesdale:
4.7% (10)Montana:
5.3% (22,556)
11am: Pinesdale:
3.3% (7)Montana:
2.5% (10,541)
12pm: Pinesdale:
0.5% (1)Montana:
1.2% (5,136)
4pm: Pinesdale:
9.8% (21)Montana:
5.7% (24,245)
>4pm: Pinesdale:
0.9% (2)Montana:
6.6% (27,764)
12:00 a.m. to 4:59 a.m. - Males: Pinesdale:
2.3% (5)Montana:
5.5% (14,253)
5:00 a.m. to 5:29 a.m. - Males: Pinesdale:
7.2% (15)Montana:
4.2% (10,760)
5:30 a.m. to 5:59 a.m. - Males: Pinesdale:
7.7% (16)Montana:
5.5% (14,327)
6:00 a.m. to 6:29 a.m. - Males: Pinesdale:
3.5% (7)Montana:
7.1% (18,386)
6:30 a.m. to 6:59 a.m. - Males: Pinesdale:
19.4% (39)Montana:
12.5% (32,248)
7:00 a.m. to 7:29 a.m. - Males: Pinesdale:
15.0% (30)Montana:
13.0% (33,550)
7:30 a.m. to 7:59 a.m. - Males: Pinesdale:
26.2% (53)Montana:
16.2% (41,784)
8:00 a.m. to 8:29 a.m. - Males: Pinesdale:
8.2% (17)Montana:
11.6% (30,021)
8:30 a.m. to 8:59 a.m. - Males: Pinesdale:
5.6% (11)Montana:
4.4% (11,344)
12:00 p.m. to 3:59 p.m. - Males: Pinesdale:
1.2% (2)Montana:
6.4% (16,533)
4:00 p.m. to 11:59 p.m. - Males: Pinesdale:
3.9% (8)Montana:
4.9% (12,584)
12:00 a.m. to 4:59 a.m. - Females: Pinesdale:
3.3% (5)Montana:
3.1% (7,020)
6:00 a.m. to 6:29 a.m. - Females: Pinesdale:
6.0% (9)Montana:
5.8% (12,982)
6:30 a.m. to 6:59 a.m. - Females: Pinesdale:
4.2% (6)Montana:
7.3% (16,421)
7:00 a.m. to 7:29 a.m. - Females: Pinesdale:
2.1% (3)Montana:
14.7% (32,896)
7:30 a.m. to 7:59 a.m. - Females: Pinesdale:
9.6% (15)Montana:
22.6% (50,703)
8:00 a.m. to 8:29 a.m. - Females: Pinesdale:
12.5% (19)Montana:
11.9% (26,657)
8:30 a.m. to 8:59 a.m. - Females: Pinesdale:
25.0% (39)Montana:
7.4% (16,653)
9:00 a.m. to 9:59 a.m. - Females: Pinesdale:
13.5% (21)Montana:
6.4% (14,330)
10:00 a.m. to 10:59 a.m. - Females: Pinesdale:
13.4% (21)Montana:
4.6% (10,240)
11:00 a.m. to 11:59 a.m. - Females: Pinesdale:
2.1% (3)Montana:
1.7% (3,857)
12:00 p.m. to 3:59 p.m. - Females: Pinesdale:
1.7% (3)Montana:
4.9% (11,045)
4:00 p.m. to 11:59 p.m. - Females: Pinesdale:
7.9% (12)Montana:
5.5% (12,325)
Travel time to work Percentage of workers working in this county: 91.7%Number of people working at home: 87 (19.4% of all workers )
Less than 5 minutes: Pinesdale:
5.6% (12)Montana:
7.8% (33,091)
5 to 9 minutes: Pinesdale:
10.7% (23)Montana:
20.5% (86,585)
10 to 14 minutes: Pinesdale:
15.9% (34)Montana:
20.8% (87,855)
15 to 19 minutes: Pinesdale:
29.4% (63)Montana:
16.3% (68,642)
20 to 24 minutes: Pinesdale:
6.1% (13)Montana:
10.3% (43,356)
30 to 34 minutes: Pinesdale:
7.5% (16)Montana:
6.4% (27,044)
45 to 59 minutes: Pinesdale:
11.7% (25)Montana:
2.7% (11,349)
60 to 89 minutes: Pinesdale:
3.7% (8)Montana:
2.1% (8,715)
90 or more minutes: Pinesdale:
2.3% (5)Montana:
1.9% (7,814)
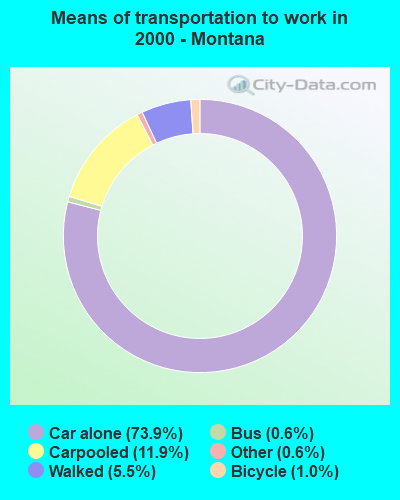
Means of transportation to work Drove car alone: Pinesdale:
82.9% (152)Montana:
79.3% (177,525)
Carpooled: Pinesdale:
10.3% (19)Montana:
12.5% (32,298)
Walked: Pinesdale:
6.9% (13)Montana:
5.0% (9,436)
Drove car alone: Pinesdale:
51.4% (110)Montana:
73.9% (311,872)
Carpooled: Pinesdale:
36.9% (79)Montana:
11.9% (50,192)
Walked: Pinesdale:
4.7% (10)Montana:
5.5% (23,336)
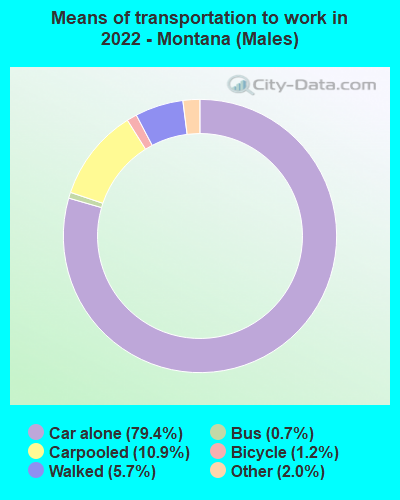
Drove car alone - Males: Pinesdale:
80.6% (91)Montana:
79.4% (177,525)
Carpooled - Males: Pinesdale:
11.1% (13)Montana:
10.9% (32,298)
Walked - Males: Pinesdale:
8.3% (9)Montana:
5.7% (9,436)
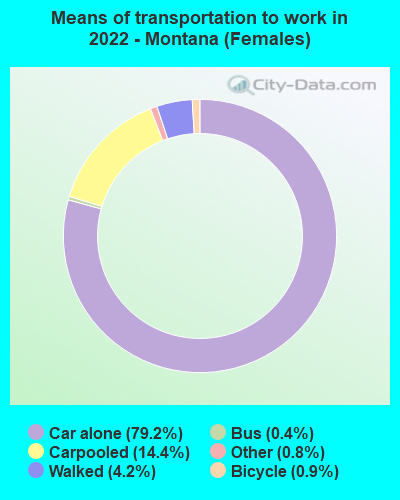
Drove car alone - Females: Pinesdale:
86.6% (61)Montana:
79.2% (177,525)
Carpooled - Females: Pinesdale:
9.0% (6)Montana:
14.4% (32,298)
Walked - Females: Pinesdale:
4.5% (3)Montana:
4.2% (9,436)
Private vehicle occupancy Drove alone: Pinesdale:
76.8% (264)Montana:
86.4% (382,804)
In 2 person carpool: Pinesdale:
11.3% (39)Montana:
9.4% (41,471)
In 3 person carpool: Pinesdale:
9.5% (33)Montana:
2.2% (9,877)
In 4 person carpool: Pinesdale:
2.4% (8)Montana:
1.4% (6,142)
Drove alone: Pinesdale:
58.2% (110)Montana:
86.1% (311,872)
In 2 person carpool: Pinesdale:
23.8% (45)Montana:
10.7% (38,849)
In 3 person carpool: Pinesdale:
9.5% (18)Montana:
2.1% (7,492)
In 4 person carpool: Pinesdale:
5.3% (10)Montana:
0.7% (2,420)
In 5-6 person carpool: Pinesdale:
3.2% (6)Montana:
0.3% (1,138)
Class of workers
Employee of private company: Pinesdale:
68.5% (320)Montana:
58.8% (328,992)
Self-employed in own incorporated business: Pinesdale:
7.4% (35)Montana:
6.0% (33,543)
Private not-for-profit wage and salary workers: Pinesdale:
7.0% (32)Montana:
10.3% (57,742)
Local government workers: Pinesdale:
3.8% (18)Montana:
7.1% (39,717)
State government workers: Pinesdale:
0.7% (3)Montana:
5.1% (28,287)
Federal government workers: Pinesdale:
2.9% (14)Montana:
3.4% (19,295)
Self-employed workers in own not incorporated business: Pinesdale:
8.3% (39)Montana:
8.9% (49,757)
Unpaid family workers: Pinesdale:
1.3% (6)Montana:
0.4% (2,271)
Employee of private company: Pinesdale:
71.4% (155)Montana:
56.0% (238,678)
Self-employed in own incorporated business: Pinesdale:
8.3% (18)Montana:
4.9% (20,821)
Private not-for-profit wage and salary workers: Pinesdale:
8.8% (19)Montana:
8.2% (35,132)
Local government workers: Pinesdale:
0.5% (1)Montana:
7.8% (33,240)
State government workers: Pinesdale:
1.4% (3)Montana:
6.2% (26,416)
Federal government workers: Pinesdale:
2.8% (6)Montana:
4.3% (18,467)
Self-employed workers in own not incorporated business: Pinesdale:
5.1% (11)Montana:
11.8% (50,112)
Unpaid family workers: Pinesdale:
1.8% (4)Montana:
0.7% (3,111)
Employee of private company - Males: Pinesdale:
70.5% (180)Montana:
62.5% (184,653)
Self-employed in own incorporated business - Males: Pinesdale:
8.2% (21)Montana:
7.8% (23,079)
Private not-for-profit wage and salary workers - Males: Pinesdale:
2.5% (6)Montana:
5.8% (17,031)
Local government workers - Males: Pinesdale:
5.7% (15)Montana:
5.1% (15,006)
State government workers - Males: Pinesdale:
1.2% (3)Montana:
4.9% (14,549)
Self-employed workers in own not incorporated business - Males: Pinesdale:
11.9% (30)Montana:
10.1% (29,812)
Employee of private company - Females: Pinesdale:
66.2% (139)Montana:
54.7% (144,339)
Self-employed in own incorporated business - Females: Pinesdale:
6.5% (14)Montana:
4.0% (10,464)
Private not-for-profit wage and salary workers - Females: Pinesdale:
12.4% (26)Montana:
15.4% (40,711)
Local government workers - Females: Pinesdale:
1.5% (3)Montana:
9.4% (24,711)
Federal government workers - Females: Pinesdale:
6.5% (14)Montana:
3.6% (9,567)
Self-employed workers in own not incorporated business - Females: Pinesdale:
4.0% (8)Montana:
7.6% (19,945)
Unpaid family workers - Females: Pinesdale:
3.0% (6)Montana:
0.2% (590)