Work and Jobs in Porter Heights, Texas (TX) Detailed Stats
Occupations, Industries, Unemployment, Workers, Commute
Settings
X


Discuss Porter Heights, Texas work on our local forum with over 2,400,000 registered users
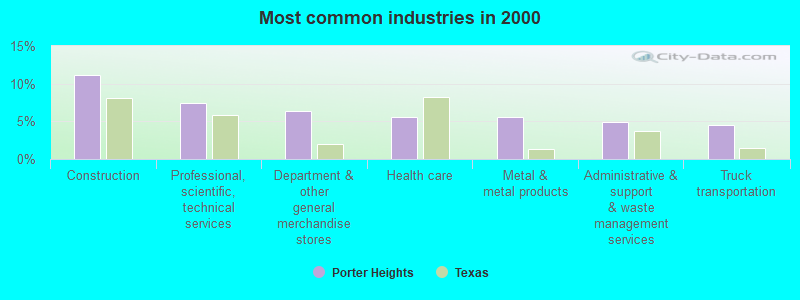
The most common industries in Porter Heights are: Construction (11.2% of civilian employees), Professional, scientific, technical services (7.4% of civilian employees), Department & other general merchandise stores (6.3% of civilian employees). 65.2% of workers work in Montgomery County and 2.2% of all workers work at home. 93.5% of workers are employees of private companies, which is 25.6% greater than the rate of 69.6% across the entire state of Texas.
Whole page based on the data from 2000 / 2022 when the population of Porter Heights, Texas was 1,490 / 1,078
Whole page based on the data from 2000 / 2022 when the population of Porter Heights, Texas was 1,490 / 1,078
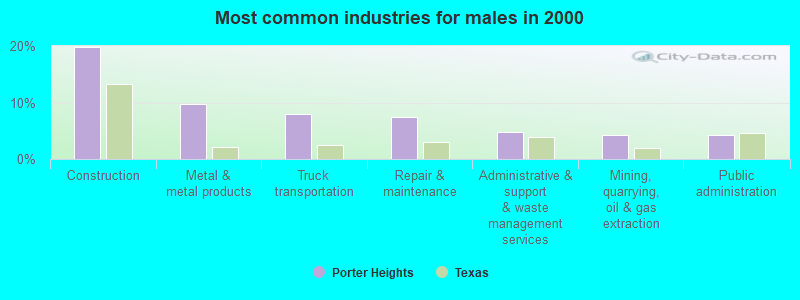
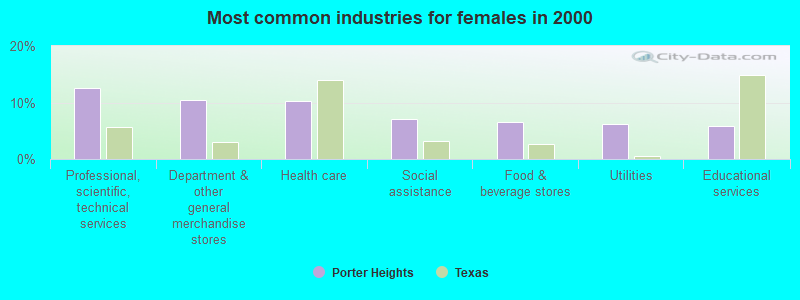
Most common industries
Most common industries | |||
|---|---|---|---|
Industry | All | Males | Females |
| Construction | 11.2% (83) | 19.9% (83) | 0.0% (0) |
| Professional, scientific, and technical services | 7.4% (55) | 3.3% (14) | 12.7% (41) |
| Department and other general merchandise stores | 6.3% (47) | 3.1% (13) | 10.5% (34) |
| Health care | 5.5% (41) | 1.9% (8) | 10.2% (33) |
| Metal and metal products | 5.5% (41) | 9.8% (41) | 0.0% (0) |
| Administrative and support and waste management services | 4.9% (36) | 4.8% (20) | 4.9% (16) |
| Truck transportation | 4.4% (33) | 7.9% (33) | 0.0% (0) |
| Public administration | 4.3% (32) | 4.3% (18) | 4.3% (14) |
| Repair and maintenance | 4.2% (31) | 7.4% (31) | 0.0% (0) |
| Food and beverage stores | 3.9% (29) | 1.9% (8) | 6.5% (21) |
| Educational services | 3.2% (24) | 1.2% (5) | 5.9% (19) |
| Social assistance | 3.1% (23) | 0.0% (0) | 7.1% (23) |
| Utilities | 2.7% (20) | 0.0% (0) | 6.2% (20) |
| Mining, quarrying, and oil and gas extraction | 2.4% (18) | 4.3% (18) | 0.0% (0) |
| Broadcasting and telecommunications | 2.4% (18) | 0.0% (0) | 5.6% (18) |
| Professional and commercial equipment and supplies merchant wholesalers | 2.3% (17) | 4.1% (17) | 0.0% (0) |
| Private households | 2.3% (17) | 0.0% (0) | 5.2% (17) |
| Lumber and other construction materials merchant wholesalers | 2.0% (15) | 1.9% (8) | 2.2% (7) |
| Arts, entertainment, and recreation | 1.9% (14) | 3.3% (14) | 0.0% (0) |
| Warehousing and storage | 1.9% (14) | 0.0% (0) | 4.3% (14) |
| Transportation equipment | 1.5% (11) | 2.6% (11) | 0.0% (0) |
| Finance and insurance | 1.3% (10) | 0.0% (0) | 3.1% (10) |
| Air transportation | 1.3% (10) | 2.4% (10) | 0.0% (0) |
| Motor vehicle and parts dealers | 1.1% (8) | 1.9% (8) | 0.0% (0) |
| Metals and minerals, except petroleum, merchant wholesalers | 1.1% (8) | 0.0% (0) | 2.5% (8) |
| Real estate and rental and leasing | 1.1% (8) | 1.9% (8) | 0.0% (0) |
| Personal and laundry services | 1.1% (8) | 0.0% (0) | 2.5% (8) |
| Wood products | 0.9% (7) | 1.7% (7) | 0.0% (0) |
| Pharmacies and drug stores | 0.9% (7) | 1.7% (7) | 0.0% (0) |
| Gasoline stations | 0.9% (7) | 0.0% (0) | 2.2% (7) |
| Computer and electronic products | 0.9% (7) | 0.0% (0) | 2.2% (7) |
| U. S. Postal service | 0.9% (7) | 1.7% (7) | 0.0% (0) |
| Accommodation and food services | 0.9% (7) | 0.0% (0) | 2.2% (7) |
| Miscellaneous nondurable goods merchant wholesalers | 0.8% (6) | 1.4% (6) | 0.0% (0) |
| Used merchandise, gift, novelty, and souvenir, and other miscellaneous stores | 0.8% (6) | 1.4% (6) | 0.0% (0) |
| Machinery | 0.8% (6) | 1.4% (6) | 0.0% (0) |
| Nonmetallic mineral products | 0.8% (6) | 1.4% (6) | 0.0% (0) |
| Building material and garden equipment and supplies dealers | 0.7% (5) | 1.2% (5) | 0.0% (0) |
Unemployment in Porter Heights
- Unemployment by race in 2000
- Unemployment rate for White non-Hispanic residents
- 3.8%Males
- 8.1%Females
Time leaving home to go to work

12:00 a.m. to 4:59 a.m.:
| Porter Heights: | 17.3% (110) |
| Texas: | 5.5% (678,264) |
5:00 a.m. to 5:29 a.m.:
| Porter Heights: | 9.8% (62) |
| Texas: | 4.3% (525,841) |
6:00 a.m. to 6:29 a.m.:
| Porter Heights: | 9.5% (60) |
| Texas: | 9.4% (1,155,020) |
6:30 a.m. to 6:59 a.m.:
| Porter Heights: | 3.7% (23) |
| Texas: | 9.3% (1,152,822) |
7:00 a.m. to 7:29 a.m.:
| Porter Heights: | 6.1% (39) |
| Texas: | 15.3% (1,885,477) |
8:00 a.m. to 8:29 a.m.:
| Porter Heights: | 38.0% (241) |
| Texas: | 11.3% (1,400,175) |
10:00 a.m. to 10:59 a.m.:
| Porter Heights: | 9.5% (60) |
| Texas: | 3.2% (390,354) |
4:00 p.m. to 11:59 p.m.:
| Porter Heights: | 5.8% (37) |
| Texas: | 6.3% (777,072) |

<5am:
| Porter Heights: | 5.7% (41) |
| Texas: | 3.1% (281,361) |
5:30am:
| Porter Heights: | 14.6% (105) |
| Texas: | 2.9% (262,060) |
6am:
| Porter Heights: | 2.9% (21) |
| Texas: | 4.4% (403,423) |
6:30am:
| Porter Heights: | 12.2% (88) |
| Texas: | 8.8% (808,876) |
7am:
| Porter Heights: | 9.7% (70) |
| Texas: | 10.7% (976,557) |
7:30am:
| Porter Heights: | 12.3% (89) |
| Texas: | 16.4% (1,500,904) |
8am:
| Porter Heights: | 13.5% (97) |
| Texas: | 16.8% (1,536,308) |
8:30am:
| Porter Heights: | 2.2% (16) |
| Texas: | 10.0% (913,601) |
10am:
| Porter Heights: | 1.8% (13) |
| Texas: | 5.2% (472,592) |
11am:
| Porter Heights: | 1.2% (9) |
| Texas: | 2.2% (197,844) |
12pm:
| Porter Heights: | 2.8% (20) |
| Texas: | 0.9% (86,997) |
4pm:
| Porter Heights: | 9.3% (67) |
| Texas: | 5.5% (503,565) |
>4pm:
| Porter Heights: | 8.3% (60) |
| Texas: | 6.1% (563,107) |

5:00 a.m. to 5:29 a.m. - Males:
| Porter Heights: | 14.9% (63) |
| Texas: | 5.8% (394,876) |
6:00 a.m. to 6:29 a.m. - Males:
| Porter Heights: | 14.0% (59) |
| Texas: | 10.9% (751,118) |
8:00 a.m. to 8:29 a.m. - Males:
| Porter Heights: | 56.5% (237) |
| Texas: | 10.6% (729,041) |
10:00 a.m. to 10:59 a.m. - Males:
| Porter Heights: | 10.6% (45) |
| Texas: | 2.7% (186,469) |
4:00 p.m. to 11:59 p.m. - Males:
| Porter Heights: | 8.7% (36) |
| Texas: | 6.4% (435,950) |

12:00 a.m. to 4:59 a.m. - Females:
| Porter Heights: | 77.2% (165) |
| Texas: | 3.7% (200,980) |
6:30 a.m. to 6:59 a.m. - Females:
| Porter Heights: | 11.0% (23) |
| Texas: | 9.1% (500,516) |
7:00 a.m. to 7:29 a.m. - Females:
| Porter Heights: | 18.7% (40) |
| Texas: | 16.7% (914,879) |
10:00 a.m. to 10:59 a.m. - Females:
| Porter Heights: | 8.9% (19) |
| Texas: | 3.7% (203,885) |
Travel time to work
Percentage of workers working in this county: 65.2%
Number of people working at home: 15 (2.2% of all workers)
Number of people working at home: 15 (2.2% of all workers)


Less than 5 minutes:
| Porter Heights: | 1.4% (10) |
| Texas: | 3.0% (277,642) |
5 to 9 minutes:
| Porter Heights: | 3.3% (24) |
| Texas: | 10.3% (942,891) |
10 to 14 minutes:
| Porter Heights: | 3.3% (24) |
| Texas: | 14.4% (1,317,555) |
15 to 19 minutes:
| Porter Heights: | 9.0% (65) |
| Texas: | 16.0% (1,467,945) |
20 to 24 minutes:
| Porter Heights: | 8.9% (64) |
| Texas: | 13.9% (1,276,781) |
25 to 29 minutes:
| Porter Heights: | 4.6% (33) |
| Texas: | 5.3% (482,838) |
30 to 34 minutes:
| Porter Heights: | 10.5% (76) |
| Texas: | 14.3% (1,309,699) |
35 to 39 minutes:
| Porter Heights: | 12.1% (87) |
| Texas: | 2.4% (219,873) |
40 to 44 minutes:
| Porter Heights: | 3.6% (26) |
| Texas: | 3.1% (280,916) |
45 to 59 minutes:
| Porter Heights: | 25.5% (184) |
| Texas: | 7.6% (692,006) |
60 to 89 minutes:
| Porter Heights: | 11.0% (79) |
| Texas: | 4.6% (418,905) |
90 or more minutes:
| Porter Heights: | 3.3% (24) |
| Texas: | 2.4% (218,800) |
Means of transportation to work


Drove car alone:
| Porter Heights: | 81.8% (590) |
| Texas: | 77.7% (7,115,590) |
Carpooled:
| Porter Heights: | 13.2% (95) |
| Texas: | 14.5% (1,326,012) |
Other means:
| Porter Heights: | 1.5% (11) |
| Texas: | 0.9% (86,692) |
Private vehicle occupancy

Drove alone:
| Porter Heights: | 99.1% (623) |
| Texas: | 87.6% (10,283,021) |

Drove alone:
| Porter Heights: | 86.1% (590) |
| Texas: | 84.3% (7,115,590) |
In 2 person carpool:
| Porter Heights: | 13.1% (90) |
| Texas: | 11.6% (982,994) |
In 3 person carpool:
| Porter Heights: | 0.7% (5) |
| Texas: | 2.4% (201,602) |
Class of workers

Employee of private company:
| Porter Heights: | 93.5% (647) |
| Texas: | 69.6% (10,139,666) |
Local government workers:
| Porter Heights: | 6.5% (45) |
| Texas: | 7.6% (1,109,799) |

Employee of private company:
| Porter Heights: | 77.1% (572) |
| Texas: | 69.6% (6,425,274) |
Self-employed in own incorporated business:
| Porter Heights: | 4.3% (32) |
| Texas: | 2.7% (250,864) |
Private not-for-profit wage and salary workers:
| Porter Heights: | 5.3% (39) |
| Texas: | 5.7% (526,631) |
Local government workers:
| Porter Heights: | 4.4% (33) |
| Texas: | 6.6% (608,479) |
State government workers:
| Porter Heights: | 2.4% (18) |
| Texas: | 5.4% (501,082) |
Federal government workers:
| Porter Heights: | 2.4% (18) |
| Texas: | 2.6% (237,177) |
Self-employed workers in own not incorporated business:
| Porter Heights: | 4.0% (30) |
| Texas: | 7.1% (653,527) |

Employee of private company - Males:
| Porter Heights: | 100.0% (465) |
| Texas: | 73.1% (5,788,450) |

Employee of private company - Females:
| Porter Heights: | 80.1% (181) |
| Texas: | 65.4% (4,351,216) |
Local government workers - Females:
| Porter Heights: | 19.9% (45) |
| Texas: | 10.6% (704,332) |