Work and Jobs in Portola Valley, California (CA) Detailed Stats
Data:
Unemployment (%)
Unemployment (% change since 2000)
Unemployment (%) - White
Unemployment (% change since 2000) - White
Unemployment (%) - Black or African American
Unemployment (% change since 2000) - Black or African American
Unemployment (%) - Asian
Unemployment (% change since 2000) - Asian
Unemployment (%) - Hispanic or Latino
Unemployment (% change since 2000) - Hispanic or Latino
Unemployment (%) - American Indian and Alaska Native
Unemployment (% change since 2000) - American Indian and Alaska Native
Unemployment (%) - Multirace
Unemployment (% change since 2000) - Multirace
Unemployment (%) - Other Race
Unemployment (% change since 2000) - Other Race
Industry diversity
Most Common Industries - Agriculture, forestry, fishing and hunting, and mining (%)
Most Common Industries - Agriculture, forestry, fishing and hunting (%)
Most Common Industries - Mining, quarrying, and oil and gas extraction (%)
Most Common Industries - Construction (%)
Most Common Industries - Manufacturing (%)
Most Common Industries - Wholesale trade (%)
Most Common Industries - Retail trade (%)
Most Common Industries - Transportation and warehousing, and utilities (%)
Most Common Industries - Transportation and warehousing (%)
Most Common Industries - Utilities (%)
Most Common Industries - Information (%)
Most Common Industries - Finance and insurance, and real estate and rental and leasing (%)
Most Common Industries - Finance and insurance (%)
Most Common Industries - Real estate and rental and leasing (%)
Most Common Industries - Professional, scientific, and management, and administrative and waste management services (%)
Most Common Industries - Professional, scientific, and technical services (%)
Most Common Industries - Management of companies and enterprises (%)
Most Common Industries - Administrative and support and waste management services (%)
Most Common Industries - Educational services, and health care and social assistance (%)
Most Common Industries - Educational services (%)
Most Common Industries - Health care and social assistance (%)
Most Common Industries - Arts, entertainment, and recreation, and accommodation and food services (%)
Most Common Industries - Arts, entertainment, and recreation (%)
Most Common Industries - Accommodation and food services (%)
Most Common Industries - Other services, except public administration (%)
Most Common Industries - Public administration (%)
Occupation diversity
Most Common Occupations - Management, business, science, and arts occupations (%)
Most Common Occupations - Management, business, and financial occupations (%)
Most Common Occupations - Management occupations (%)
Most Common Occupations - Business and financial operations occupations (%)
Most Common Occupations - Computer, engineering, and science occupations (%)
Most Common Occupations - Computer and mathematical occupations (%)
Most Common Occupations - Architecture and engineering occupations (%)
Most Common Occupations - Life, physical, and social science occupations (%)
Most Common Occupations - Education, legal, community service, arts, and media occupations (%)
Most Common Occupations - Community and social service occupations (%)
Most Common Occupations - Legal occupations (%)
Most Common Occupations - Education, training, and library occupations (%)
Most Common Occupations - Arts, design, entertainment, sports, and media occupations (%)
Most Common Occupations - Healthcare practitioners and technical occupations (%)
Most Common Occupations - Health diagnosing and treating practitioners and other technical occupations (%)
Most Common Occupations - Health technologists and technicians (%)
Most Common Occupations - Service occupations (%)
Most Common Occupations - Healthcare support occupations (%)
Most Common Occupations - Protective service occupations (%)
Most Common Occupations - Fire fighting and prevention, and other protective service workers including supervisors (%)
Most Common Occupations - Law enforcement workers including supervisors (%)
Most Common Occupations - Food preparation and serving related occupations (%)
Most Common Occupations - Building and grounds cleaning and maintenance occupations (%)
Most Common Occupations - Personal care and service occupations (%)
Most Common Occupations - Sales and office occupations (%)
Most Common Occupations - Sales and related occupations (%)
Most Common Occupations - Office and administrative support occupations (%)
Most Common Occupations - Natural resources, construction, and maintenance occupations (%)
Most Common Occupations - Farming, fishing, and forestry occupations (%)
Most Common Occupations - Construction and extraction occupations (%)
Most Common Occupations - Installation, maintenance, and repair occupations (%)
Most Common Occupations - Production, transportation, and material moving occupations (%)
Most Common Occupations - Production occupations (%)
Most Common Occupations - Transportation occupations (%)
Most Common Occupations - Material moving occupations (%)
Private vehicle occupancy - Drove alone (% change since 2000)
Private vehicle occupancy - Carpooled (%)
Private vehicle occupancy - Carpooled (% change since 2000)
Private vehicle occupancy - In 2-person carpool (%)
Private vehicle occupancy - In 2-person carpool (% change since 2000)
Private vehicle occupancy - In 3-person carpool (%)
Private vehicle occupancy - In 3-person carpool (% change since 2000)
Private vehicle occupancy - In 4-person carpool (%)
Private vehicle occupancy - In 4-person carpool (% change since 2000)
Private vehicle occupancy - In 5- or 6-person carpool (%)
Private vehicle occupancy - In 5- or 6-person carpool (% change since 2000)
Private vehicle occupancy - In 7-or-more-person carpool (%)
Private vehicle occupancy - In 7-or-more-person carpool (% change since 2000)
Time Leaving Home To Go To Work - 12:00 a.m. to 4:59 a.m. (%)
Time Leaving Home To Go To Work - 12:00 a.m. to 4:59 a.m. (% change since 2000)
Time Leaving Home To Go To Work - 5:00 a.m. to 5:59 a.m. (%)
Time Leaving Home To Go To Work - 5:00 a.m. to 5:59 a.m. (% change since 2000)
Time Leaving Home To Go To Work - 6:00 a.m. to 6:59 a.m. (%)
Time Leaving Home To Go To Work - 6:00 a.m. to 6:59 a.m. (% change since 2000)
Time Leaving Home To Go To Work - 7:00 a.m. to 7:59 a.m. (%)
Time Leaving Home To Go To Work - 7:00 a.m. to 7:59 a.m. (% change since 2000)
Time Leaving Home To Go To Work - 8:00 a.m. to 8:59 a.m. (%)
Time Leaving Home To Go To Work - 8:00 a.m. to 8:59 a.m. (% change since 2000)
Time Leaving Home To Go To Work - 9:00 a.m. to 9:59 a.m. (%)
Time Leaving Home To Go To Work - 9:00 a.m. to 9:59 a.m. (% change since 2000)
Time Leaving Home To Go To Work - 10:00 a.m. to 10:59 a.m. (%)
Time Leaving Home To Go To Work - 10:00 a.m. to 10:59 a.m. (% change since 2000)
Time Leaving Home To Go To Work - 11:00 a.m. to 11:59 a.m. (%)
Time Leaving Home To Go To Work - 11:00 a.m. to 11:59 a.m. (% change since 2000)
Time Leaving Home To Go To Work - 12:00 p.m. to 3:59 p.m. (%)
Time Leaving Home To Go To Work - 12:00 p.m. to 3:59 p.m. (% change since 2000)
Time Leaving Home To Go To Work - 4:00 p.m. to 11:59 p.m. (%)
Time Leaving Home To Go To Work - 4:00 p.m. to 11:59 p.m. (% change since 2000)
Class of Workers - Employee of private company (%)
Class of Workers - Employee of private company (% change since 2000)
Class of Workers - Self-employed in own incorporated business (%)
Class of Workers - Self-employed in own incorporated business (% change since 2000)
Class of Workers - Private not-for-profit wage and salary workers (%)
Class of Workers - Private not-for-profit wage and salary workers (% change since 2000)
Class of Workers - Local government workers (%)
Class of Workers - Local government workers (% change since 2000)
Class of Workers - State government workers (%)
Class of Workers - State government workers (% change since 2000)
Class of Workers - Federal government workers (%)
Class of Workers - Federal government workers (% change since 2000)
Class of Workers - Self-employed workers in own not incorporated business and Unpaid family workers (%)
Class of Workers - Self-employed workers in own not incorporated business and Unpaid family workers (% change since 2000)
Means of transportation to work - Drove car alone (%)
Means of transportation to work - Drove car alone (% change since 2000)
Means of transportation to work - Carpooled (%)
Means of transportation to work - Carpooled (% change since 2000)
Means of transportation to work - Public transportation (%)
Means of transportation to work - Public transportation (% change since 2000)
Means of transportation to work - Bus or trolley bus (%)
Means of transportation to work - Bus or trolley bus (% change since 2000)
Means of transportation to work - Streetcar or trolley car (%)
Means of transportation to work - Streetcar or trolley car (% change since 2000)
Means of transportation to work - Subway or elevated (%)
Means of transportation to work - Subway or elevated (% change since 2000)
Means of transportation to work - Railroad (%)
Means of transportation to work - Railroad (% change since 2000)
Means of transportation to work - Ferryboat (%)
Means of transportation to work - Ferryboat (% change since 2000)
Means of transportation to work - Taxicab (%)
Means of transportation to work - Taxicab (% change since 2000)
Means of transportation to work - Motorcycle (%)
Means of transportation to work - Motorcycle (% change since 2000)
Means of transportation to work - Bicycle (%)
Means of transportation to work - Bicycle (% change since 2000)
Means of transportation to work - Walked (%)
Means of transportation to work - Walked (% change since 2000)
Means of transportation to work - Other means (%)
Means of transportation to work - Other means (% change since 2000)
Working at home (%)
Working at home (% change since 2000)
Travel time to work - Less than 5 minutes (%)
Travel time to work - Less than 5 minutes (% change since 2000)
Travel time to work - 5 to 9 minutes (%)
Travel time to work - 5 to 9 minutes (% change since 2000)
Travel time to work - 10 to 19 minutes (%)
Travel time to work - 10 to 19 minutes (% change since 2000)
Travel time to work - 20 to 29 minutes (%)
Travel time to work - 20 to 29 minutes (% change since 2000)
Travel time to work - 30 to 39 minutes (%)
Travel time to work - 30 to 39 minutes (% change since 2000)
Travel time to work - 40 to 59 minutes (%)
Travel time to work - 40 to 59 minutes (% change since 2000)
Travel time to work - 60 to 89 minutes (%)
Travel time to work - 60 to 89 minutes (% change since 2000)
Travel time to work - 90 or more minutes (%)
Travel time to work - 90 or more minutes (% change since 2000)
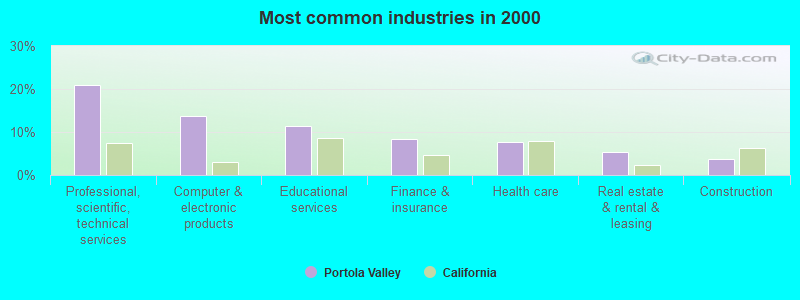
The most common industries in Portola Valley are: Professional, scientific, technical services (20.8% of civilian employees), Computer & electronic products (13.8% of civilian employees), Educational services (11.5% of civilian employees). 65.8% of workers work in San Mateo County and 51.3% of all workers work at home. 61.4% of workers are employees of private companies, which is 8.2% less than the rate of 66.5% across the entire state of California.
Whole page based on the data from 2000 / 2022 when the population of Portola Valley, California was 4,462 / 4,251
Most common industries
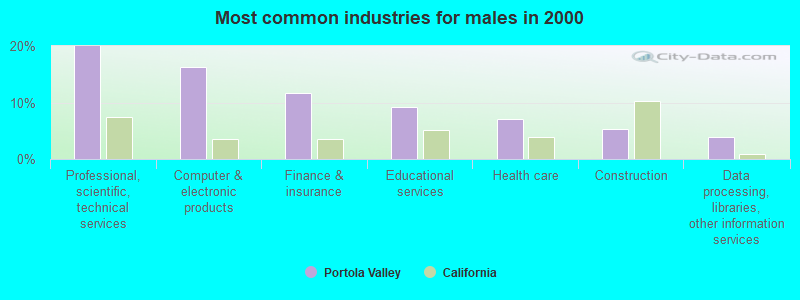
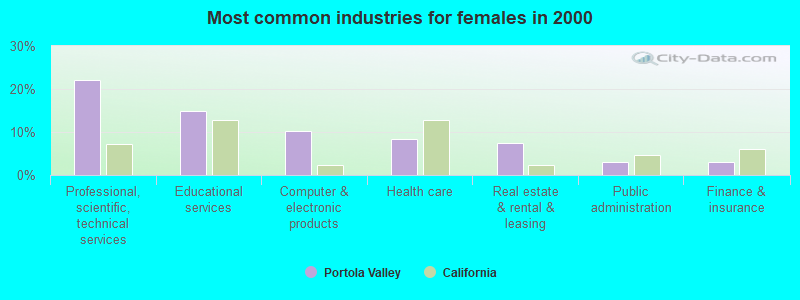
Most common industries Industry All Males Females
Professional, scientific, and technical services 20.8% 19.9% 22.1% Computer and electronic products 13.8% 16.3% 10.1% Educational services 11.5% 9.3% 14.8% Finance and insurance 8.3% 11.8% 3.1% Health care 7.6% 7.1% 8.4% Real estate and rental and leasing 5.3% 3.8% 7.5% Construction 3.7% 5.3% 1.2% Public administration 3.1% 3.1% 3.1% Data processing, libraries, and other information services 2.8% 3.9% 1.2% Religious, grantmaking, civic, professional, and similar organizations 2.4% 2.2% 2.8% Broadcasting and telecommunications 1.9% 1.8% 2.2% Administrative and support and waste management services 1.4% 0.9% 2.1% Air transportation 1.2% 1.3% 1.2% Arts, entertainment, and recreation 1.2% 0.8% 1.9% Private households 1.1% 0.0% 2.8% Publishing, and motion picture and sound recording industries 1.1% 0.0% 2.7% Electronic shopping and mail-order houses 1.1% 1.8% 0.0% Chemicals 1.1% 1.2% 1.0% Repair and maintenance 1.0% 0.9% 1.1% Other direct selling establishments 0.9% 1.6% 0.0% Motor vehicles, parts and supplies merchant wholesalers 0.8% 0.7% 1.0% Building material and garden equipment and supplies dealers 0.7% 0.6% 1.0% Electrical and electronic goods merchant wholesalers 0.7% 0.4% 1.1% Accommodation and food services 0.6% 0.0% 1.6% Food and beverage stores 0.6% 0.7% 0.5% Printing and related support activities 0.5% 0.9% 0.0% Used merchandise, gift, novelty, and souvenir, and other miscellaneous stores 0.4% 0.8% 0.0% Beverage and tobacco products 0.4% 0.0% 1.0% Utilities 0.4% 0.7% 0.0% Personal and laundry services 0.4% 0.7% 0.0% Miscellaneous manufacturing 0.4% 0.7% 0.0% Social assistance 0.4% 0.0% 1.0% Professional and commercial equipment and supplies merchant wholesalers 0.4% 0.7% 0.0% Truck transportation 0.3% 0.6% 0.0% Metal and metal products 0.3% 0.0% 0.9% Miscellaneous nondurable goods merchant wholesalers 0.3% 0.0% 0.9% Drugs, sundries, and chemical and allied products merchant wholesalers 0.3% 0.0% 0.9% Apparel, fabrics, and notions merchant wholesalers 0.2% 0.0% 0.6%
Unemployment in Portola Valley Unemployment by race in 2022
Unemployment rate for White non-Hispanic residents 1.5% MalesUnemployment rate for American Indian and Alaska Native residents 100.0% FemalesUnemployment rate for other race residents 100.0% FemalesUnemployment rate for Hispanic or Latino residents 8.6% FemalesUnemployment by race in 2000
Unemployment rate for White non-Hispanic residents 1.3% Males1.9% Females
Time leaving home to go to work 5:00 a.m. to 5:29 a.m.: Portola Valley:
2.1% (13)California:
4.5% (692,772)
6:00 a.m. to 6:29 a.m.: Portola Valley:
7.1% (45)California:
8.3% (1,273,588)
6:30 a.m. to 6:59 a.m.: Portola Valley:
7.2% (46)California:
7.5% (1,156,338)
7:00 a.m. to 7:29 a.m.: Portola Valley:
15.9% (101)California:
13.2% (2,027,702)
7:30 a.m. to 7:59 a.m.: Portola Valley:
11.4% (73)California:
10.1% (1,550,402)
8:00 a.m. to 8:29 a.m.: Portola Valley:
16.1% (103)California:
12.7% (1,953,986)
8:30 a.m. to 8:59 a.m.: Portola Valley:
20.8% (133)California:
5.8% (890,950)
9:00 a.m. to 9:59 a.m.: Portola Valley:
18.2% (116)California:
8.4% (1,288,499)
11:00 a.m. to 11:59 a.m.: Portola Valley:
2.2% (14)California:
1.8% (280,975)
<5am: Portola Valley:
0.5% (10)California:
4.2% (606,086)
5:30am: Portola Valley:
1.0% (19)California:
3.6% (523,209)
6am: Portola Valley:
1.1% (22)California:
4.8% (692,256)
6:30am: Portola Valley:
3.0% (59)California:
8.4% (1,216,867)
7am: Portola Valley:
5.7% (113)California:
9.4% (1,362,830)
7:30am: Portola Valley:
10.6% (210)California:
13.8% (2,006,950)
8am: Portola Valley:
15.3% (302)California:
13.7% (1,986,831)
8:30am: Portola Valley:
22.5% (445)California:
10.9% (1,577,815)
9am: Portola Valley:
6.5% (128)California:
5.4% (778,152)
10am: Portola Valley:
11.6% (229)California:
6.7% (972,355)
11am: Portola Valley:
4.1% (81)California:
2.9% (414,479)
12pm: Portola Valley:
1.2% (24)California:
1.3% (189,005)
4pm: Portola Valley:
3.9% (77)California:
6.0% (865,284)
>4pm: Portola Valley:
1.8% (35)California:
5.3% (776,167)
5:00 a.m. to 5:29 a.m. - Males: Portola Valley:
3.1% (12)California:
6.0% (509,420)
6:00 a.m. to 6:29 a.m. - Males: Portola Valley:
11.4% (46)California:
9.8% (842,941)
6:30 a.m. to 6:59 a.m. - Males: Portola Valley:
5.7% (23)California:
7.7% (657,557)
7:00 a.m. to 7:29 a.m. - Males: Portola Valley:
9.6% (39)California:
12.4% (1,058,532)
7:30 a.m. to 7:59 a.m. - Males: Portola Valley:
14.7% (59)California:
8.2% (702,727)
8:00 a.m. to 8:29 a.m. - Males: Portola Valley:
20.6% (83)California:
11.5% (984,538)
8:30 a.m. to 8:59 a.m. - Males: Portola Valley:
12.7% (51)California:
4.8% (414,815)
9:00 a.m. to 9:59 a.m. - Males: Portola Valley:
18.3% (73)California:
7.7% (655,038)
11:00 a.m. to 11:59 a.m. - Males: Portola Valley:
3.1% (13)California:
1.7% (141,620)
6:30 a.m. to 6:59 a.m. - Females: Portola Valley:
9.3% (22)California:
7.3% (498,781)
7:00 a.m. to 7:29 a.m. - Females: Portola Valley:
25.5% (61)California:
14.1% (969,170)
7:30 a.m. to 7:59 a.m. - Females: Portola Valley:
4.7% (11)California:
12.4% (847,675)
8:00 a.m. to 8:29 a.m. - Females: Portola Valley:
9.8% (23)California:
14.1% (969,448)
8:30 a.m. to 8:59 a.m. - Females: Portola Valley:
34.9% (83)California:
6.9% (476,135)
9:00 a.m. to 9:59 a.m. - Females: Portola Valley:
17.0% (40)California:
9.2% (633,461)
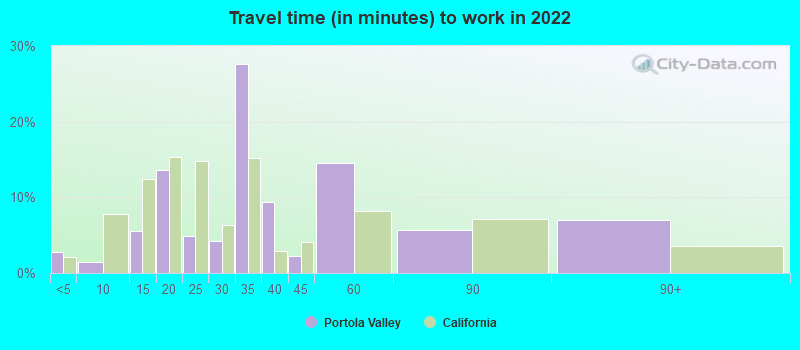
Travel time to work Percentage of workers working in this county: 65.8%Number of people working at home: 730 (51.3% of all workers )
Less than 5 minutes: Portola Valley:
2.8% (36)California:
2.1% (323,064)
5 to 9 minutes: Portola Valley:
1.5% (19)California:
7.8% (1,208,682)
10 to 14 minutes: Portola Valley:
5.6% (73)California:
12.4% (1,917,610)
15 to 19 minutes: Portola Valley:
13.7% (178)California:
15.3% (2,367,483)
20 to 24 minutes: Portola Valley:
4.9% (63)California:
14.8% (2,279,693)
25 to 29 minutes: Portola Valley:
4.2% (55)California:
6.4% (981,997)
30 to 34 minutes: Portola Valley:
27.6% (360)California:
15.2% (2,339,223)
35 to 39 minutes: Portola Valley:
9.4% (122)California:
2.9% (453,226)
40 to 44 minutes: Portola Valley:
2.2% (29)California:
4.1% (637,781)
45 to 59 minutes: Portola Valley:
14.6% (190)California:
8.2% (1,259,482)
60 to 89 minutes: Portola Valley:
5.7% (75)California:
7.2% (1,111,698)
90 or more minutes: Portola Valley:
7.0% (91)California:
3.6% (552,805)
Less than 5 minutes: Portola Valley:
4.1% (81)California:
2.2% (324,703)
5 to 9 minutes: Portola Valley:
5.4% (106)California:
8.8% (1,280,443)
10 to 14 minutes: Portola Valley:
8.1% (160)California:
13.3% (1,930,263)
15 to 19 minutes: Portola Valley:
11.9% (234)California:
14.9% (2,157,970)
20 to 24 minutes: Portola Valley:
17.9% (353)California:
13.8% (2,004,060)
25 to 29 minutes: Portola Valley:
5.7% (113)California:
5.4% (782,241)
30 to 34 minutes: Portola Valley:
15.5% (305)California:
13.9% (2,025,657)
35 to 39 minutes: Portola Valley:
3.2% (63)California:
2.5% (366,487)
40 to 44 minutes: Portola Valley:
4.0% (79)California:
3.6% (528,043)
45 to 59 minutes: Portola Valley:
9.7% (191)California:
7.9% (1,151,598)
60 to 89 minutes: Portola Valley:
2.2% (43)California:
6.4% (933,123)
90 or more minutes: Portola Valley:
1.3% (26)California:
3.3% (483,698)
5 to 9 minutes - Males: Portola Valley:
3.3% (20)California:
6.8% (580,822)
10 to 14 minutes - Males: Portola Valley:
6.7% (40)California:
11.4% (974,497)
15 to 19 minutes - Males: Portola Valley:
1.8% (11)California:
14.5% (1,239,386)
20 to 24 minutes - Males: Portola Valley:
6.8% (41)California:
14.3% (1,223,429)
25 to 29 minutes - Males: Portola Valley:
3.1% (18)California:
6.4% (545,844)
30 to 34 minutes - Males: Portola Valley:
25.3% (152)California:
15.8% (1,352,210)
35 to 39 minutes - Males: Portola Valley:
6.0% (36)California:
3.0% (253,732)
45 to 59 minutes - Males: Portola Valley:
25.6% (153)California:
8.9% (762,659)
60 to 89 minutes - Males: Portola Valley:
9.3% (56)California:
8.3% (711,394)
90 or more minutes - Males: Portola Valley:
9.0% (54)California:
4.4% (378,954)
Less than 5 minutes - Females: Portola Valley:
5.1% (36)California:
2.2% (149,461)
10 to 14 minutes - Females: Portola Valley:
4.6% (33)California:
13.7% (943,113)
15 to 19 minutes - Females: Portola Valley:
22.9% (162)California:
16.4% (1,128,097)
20 to 24 minutes - Females: Portola Valley:
3.1% (22)California:
15.4% (1,056,264)
25 to 29 minutes - Females: Portola Valley:
5.6% (40)California:
6.4% (436,153)
30 to 34 minutes - Females: Portola Valley:
29.5% (209)California:
14.4% (987,013)
35 to 39 minutes - Females: Portola Valley:
11.4% (81)California:
2.9% (199,494)
40 to 44 minutes - Females: Portola Valley:
4.0% (28)California:
3.8% (261,637)
45 to 59 minutes - Females: Portola Valley:
5.5% (39)California:
7.2% (496,823)
60 to 89 minutes - Females: Portola Valley:
2.7% (19)California:
5.8% (400,304)
90 or more minutes - Females: Portola Valley:
5.3% (37)California:
2.5% (173,851)
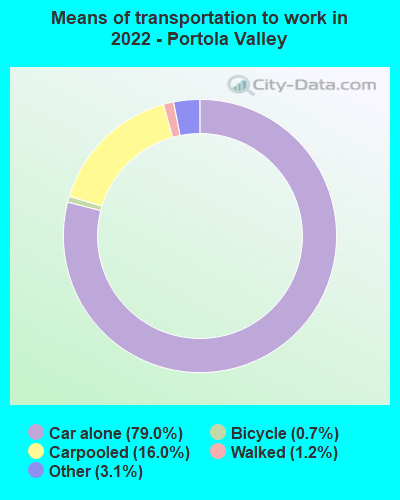
Means of transportation to work Drove car alone: Portola Valley:
79.0% (1,097)California:
79.1% (5,345,368)
Carpooled: Portola Valley:
16.0% (222)California:
11.9% (878,699)
Bicycle: Portola Valley:
0.7% (10)California:
0.9% (39,197)
Walked: Portola Valley:
1.2% (17)California:
2.9% (218,374)
Other means: Portola Valley:
3.1% (43)California:
2.1% (137,489)
Drove car alone: Portola Valley:
79.8% (1,576)California:
71.8% (10,432,462)
Carpooled: Portola Valley:
5.5% (109)California:
14.5% (2,113,313)
Walked: Portola Valley:
3.5% (69)California:
2.9% (414,581)
Drove car alone - Males: Portola Valley:
67.7% (436)California:
80.0% (5,345,368)
Carpooled - Males: Portola Valley:
30.8% (198)California:
11.1% (878,699)
Bicycle - Males: Portola Valley:
1.5% (10)California:
1.1% (39,197)
Drove car alone - Females: Portola Valley:
88.8% (663)California:
77.9% (5,345,368)
Carpooled - Females: Portola Valley:
3.1% (23)California:
12.8% (878,699)
Walked - Females: Portola Valley:
2.3% (17)California:
3.2% (218,374)
Other means - Females: Portola Valley:
5.8% (43)California:
2.0% (137,489)
Private vehicle occupancy Drove alone: Portola Valley:
98.7% (561)California:
86.9% (12,187,486)
Drove alone: Portola Valley:
93.5% (1,576)California:
83.2% (10,432,462)
In 2 person carpool: Portola Valley:
6.5% (109)California:
12.5% (1,564,905)
Class of workers
Employee of private company: Portola Valley:
61.4% (879)California:
66.5% (12,596,030)
Self-employed in own incorporated business: Portola Valley:
11.0% (158)California:
4.1% (784,709)
Private not-for-profit wage and salary workers: Portola Valley:
8.2% (118)California:
7.5% (1,417,407)
State government workers: Portola Valley:
1.1% (16)California:
4.1% (780,915)
Federal government workers: Portola Valley:
1.1% (15)California:
2.0% (369,858)
Self-employed workers in own not incorporated business: Portola Valley:
15.7% (224)California:
7.4% (1,410,735)
Unpaid family workers: Portola Valley:
1.4% (20)California:
0.2% (36,267)
Employee of private company: Portola Valley:
59.3% (1,191)California:
68.0% (10,009,465)
Self-employed in own incorporated business: Portola Valley:
5.4% (109)California:
2.7% (402,392)
Private not-for-profit wage and salary workers: Portola Valley:
13.5% (271)California:
5.7% (845,536)
Local government workers: Portola Valley:
3.4% (69)California:
8.3% (1,218,764)
State government workers: Portola Valley:
2.5% (51)California:
4.0% (594,953)
Federal government workers: Portola Valley:
2.3% (46)California:
2.3% (344,354)
Self-employed workers in own not incorporated business: Portola Valley:
13.1% (264)California:
8.5% (1,249,530)
Unpaid family workers: Portola Valley:
0.3% (7)California:
0.4% (53,934)
Employee of private company - Males: Portola Valley:
66.0% (584)California:
70.3% (7,191,252)
Self-employed in own incorporated business - Males: Portola Valley:
12.8% (113)California:
4.9% (504,764)
Private not-for-profit wage and salary workers - Males: Portola Valley:
9.0% (79)California:
5.2% (529,122)
State government workers - Males: Portola Valley:
1.8% (16)California:
3.4% (343,636)
Self-employed workers in own not incorporated business - Males: Portola Valley:
10.4% (92)California:
8.1% (824,359)
Employee of private company - Females: Portola Valley:
54.0% (295)California:
62.0% (5,404,778)
Self-employed in own incorporated business - Females: Portola Valley:
8.2% (45)California:
3.2% (279,945)
Private not-for-profit wage and salary workers - Females: Portola Valley:
7.0% (38)California:
10.2% (888,285)
Federal government workers - Females: Portola Valley:
2.8% (15)California:
1.8% (159,984)
Self-employed workers in own not incorporated business - Females: Portola Valley:
24.2% (132)California:
6.7% (586,376)
Unpaid family workers - Females: Portola Valley:
3.7% (20)California:
0.2% (18,345)