Work and Jobs in Preston, Idaho (ID) Detailed Stats
Occupations, Industries, Unemployment, Workers, Commute
Settings
X


Recent posts about work in Preston, Idaho on our local forum with over 2,400,000 registered users:
 | Coeur d’Alene vs. Hailey vs. Wallace (61 replies) |
| Is Idaho conservative and welcoming ? (43 replies) |
| Looking to move from DFW Texas to Idaho (27 replies) |
| Moving to Idaho as a Democrat? (50 replies) |
| Official Discussion on the Mormon/LDS influence in Idaho (404 replies) |
| Proposal: Coeur D'Alene Sub Forum (40 replies) |
Latest news about work in Preston, ID collected exclusively by city-data.com from local newspapers, TV, and radio stations
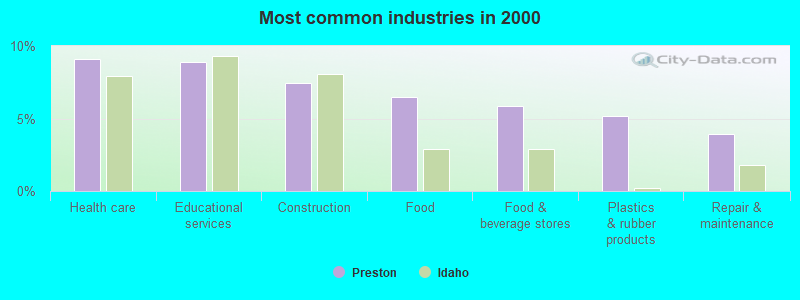
The most common industries in Preston are: Health care (9.1% of civilian employees), Educational services (8.9% of civilian employees), Construction (7.4% of civilian employees). 56.6% of workers work in Franklin County and 5.1% of all workers work at home. 74.4% of workers are employees of private companies, which is 12.0% greater than the rate of 65.4% across the entire state of Idaho.
Whole page based on the data from 2000 / 2022 when the population of Preston, Idaho was 4,682 / 5,928
Whole page based on the data from 2000 / 2022 when the population of Preston, Idaho was 4,682 / 5,928
Most common industries
Most common industries | |||
|---|---|---|---|
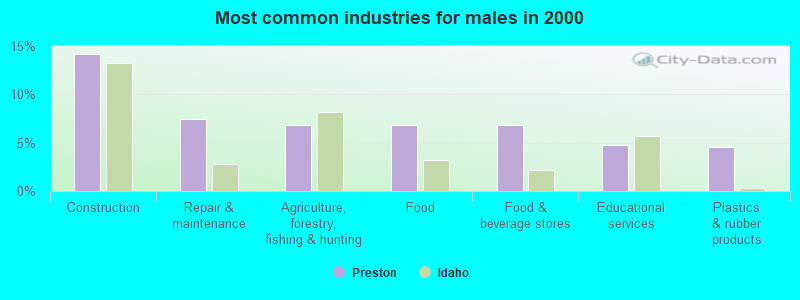
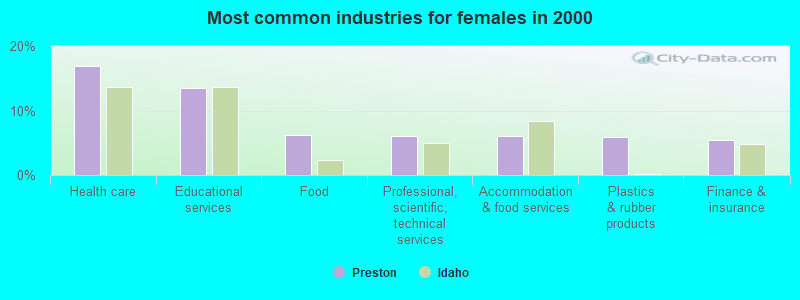
Industry | All | Males | Females |
| Health care | 9.1% (188) | 1.9% (21) | 17.0% (167) |
| Educational services | 8.9% (185) | 4.8% (52) | 13.5% (133) |
| Construction | 7.4% (154) | 14.2% (154) | 0.0% (0) |
| Food | 6.5% (135) | 6.8% (74) | 6.2% (61) |
| Food and beverage stores | 5.8% (121) | 6.8% (74) | 4.8% (47) |
| Plastics and rubber products | 5.2% (107) | 4.5% (49) | 5.9% (58) |
| Repair and maintenance | 3.9% (81) | 7.4% (81) | 0.0% (0) |
| Agriculture, forestry, fishing and hunting | 3.8% (79) | 6.8% (74) | 0.5% (5) |
| Accommodation and food services | 3.8% (79) | 1.8% (20) | 6.0% (59) |
| Professional, scientific, and technical services | 3.6% (74) | 1.4% (15) | 6.0% (59) |
| Finance and insurance | 3.5% (72) | 1.7% (19) | 5.4% (53) |
| Building material and garden equipment and supplies dealers | 3.1% (65) | 4.0% (44) | 2.1% (21) |
| Miscellaneous manufacturing | 3.0% (62) | 4.1% (45) | 1.7% (17) |
| Transportation equipment | 2.8% (59) | 4.3% (47) | 1.2% (12) |
| Personal and laundry services | 2.6% (54) | 1.8% (20) | 3.5% (34) |
| Public administration | 2.1% (43) | 2.0% (22) | 2.1% (21) |
| Printing and related support activities | 2.0% (42) | 0.6% (6) | 3.7% (36) |
| Administrative and support and waste management services | 1.8% (38) | 0.9% (10) | 2.8% (28) |
| Motor vehicle and parts dealers | 1.8% (38) | 2.2% (24) | 1.4% (14) |
| Arts, entertainment, and recreation | 1.8% (38) | 2.3% (25) | 1.3% (13) |
| Chemicals | 1.5% (32) | 2.9% (32) | 0.0% (0) |
| Computer and electronic products | 1.4% (29) | 0.9% (10) | 1.9% (19) |
| Real estate and rental and leasing | 1.3% (27) | 1.1% (12) | 1.5% (15) |
| Religious, grantmaking, civic, professional, and similar organizations | 1.3% (26) | 1.5% (16) | 1.0% (10) |
| Department and other general merchandise stores | 1.1% (23) | 1.0% (11) | 1.2% (12) |
| Social assistance | 1.1% (23) | 0.0% (0) | 2.3% (23) |
| Groceries and related products merchant wholesalers | 0.9% (18) | 1.0% (11) | 0.7% (7) |
| Other direct selling establishments | 0.9% (18) | 0.0% (0) | 1.8% (18) |
| Furniture and related product manufacturing | 0.8% (17) | 1.6% (17) | 0.0% (0) |
| Gasoline stations | 0.8% (17) | 0.0% (0) | 1.7% (17) |
| Machinery, equipment, and supplies merchant wholesalers | 0.7% (15) | 1.4% (15) | 0.0% (0) |
| Publishing, and motion picture and sound recording industries | 0.6% (13) | 0.0% (0) | 1.3% (13) |
| Motor vehicles, parts and supplies merchant wholesalers | 0.6% (13) | 1.2% (13) | 0.0% (0) |
| Utilities | 0.6% (13) | 1.2% (13) | 0.0% (0) |
| Metal and metal products | 0.6% (12) | 1.1% (12) | 0.0% (0) |
| Data processing, libraries, and other information services | 0.5% (10) | 0.9% (10) | 0.0% (0) |
| Radio, TV, and computer stores | 0.4% (9) | 0.8% (9) | 0.0% (0) |
| Miscellaneous nondurable goods merchant wholesalers | 0.4% (8) | 0.0% (0) | 0.8% (8) |
| Farm supplies merchant wholesalers | 0.3% (7) | 0.6% (7) | 0.0% (0) |
| Mining, quarrying, and oil and gas extraction | 0.2% (5) | 0.5% (5) | 0.0% (0) |
| Furniture and home furnishings, and household appliance stores | 0.2% (5) | 0.5% (5) | 0.0% (0) |
| Wood products | 0.2% (5) | 0.5% (5) | 0.0% (0) |
| Nonmetallic mineral products | 0.2% (4) | 0.0% (0) | 0.4% (4) |
| Sporting goods, camera, and hobby and toy stores | 0.2% (4) | 0.4% (4) | 0.0% (0) |
| Truck transportation | 0.1% (3) | 0.3% (3) | 0.0% (0) |
| Lumber and other construction materials merchant wholesalers | 0.1% (2) | 0.2% (2) | 0.0% (0) |
Unemployment in Preston
- Unemployment by race in 2022
- Unemployment rate for White non-Hispanic residents
- 0.9%Males
- Unemployment by race in 2000
- Unemployment rate for White non-Hispanic residents
- 6.7%Males
- 8.6%Females
- Unemployment rate for other race residents
- 20.5%Males
- Unemployment rate for Hispanic or Latino residents
- 16.0%Males
- 7.0%Females
Time leaving home to go to work

12:00 a.m. to 4:59 a.m.:
| Preston: | 8.7% (208) |
| Idaho: | 4.9% (38,486) |
5:00 a.m. to 5:29 a.m.:
| Preston: | 7.1% (169) |
| Idaho: | 3.6% (28,482) |
5:30 a.m. to 5:59 a.m.:
| Preston: | 9.2% (220) |
| Idaho: | 5.2% (40,793) |
6:00 a.m. to 6:29 a.m.:
| Preston: | 8.6% (205) |
| Idaho: | 7.2% (56,913) |
6:30 a.m. to 6:59 a.m.:
| Preston: | 10.2% (243) |
| Idaho: | 10.5% (82,939) |
7:00 a.m. to 7:29 a.m.:
| Preston: | 9.7% (232) |
| Idaho: | 15.1% (119,470) |
7:30 a.m. to 7:59 a.m.:
| Preston: | 8.5% (203) |
| Idaho: | 14.1% (111,311) |
8:00 a.m. to 8:29 a.m.:
| Preston: | 7.7% (184) |
| Idaho: | 10.4% (82,555) |
8:30 a.m. to 8:59 a.m.:
| Preston: | 1.5% (35) |
| Idaho: | 5.7% (45,319) |
9:00 a.m. to 9:59 a.m.:
| Preston: | 3.7% (89) |
| Idaho: | 6.7% (53,417) |
10:00 a.m. to 10:59 a.m.:
| Preston: | 0.1% (2) |
| Idaho: | 3.0% (24,048) |
11:00 a.m. to 11:59 a.m.:
| Preston: | 0.9% (20) |
| Idaho: | 1.3% (10,034) |
12:00 p.m. to 3:59 p.m.:
| Preston: | 11.5% (275) |
| Idaho: | 6.2% (49,251) |
4:00 p.m. to 11:59 p.m.:
| Preston: | 12.4% (295) |
| Idaho: | 6.2% (48,708) |

<5am:
| Preston: | 4.9% (100) |
| Idaho: | 3.0% (17,746) |
5:30am:
| Preston: | 5.3% (108) |
| Idaho: | 2.6% (15,758) |
6am:
| Preston: | 7.3% (147) |
| Idaho: | 3.9% (23,486) |
6:30am:
| Preston: | 9.2% (186) |
| Idaho: | 6.7% (40,014) |
7am:
| Preston: | 5.4% (110) |
| Idaho: | 9.9% (58,652) |
7:30am:
| Preston: | 10.9% (221) |
| Idaho: | 13.7% (81,453) |
8am:
| Preston: | 14.2% (287) |
| Idaho: | 17.8% (106,105) |
8:30am:
| Preston: | 9.2% (186) |
| Idaho: | 10.2% (60,766) |
9am:
| Preston: | 4.2% (84) |
| Idaho: | 5.1% (30,303) |
10am:
| Preston: | 5.9% (120) |
| Idaho: | 5.1% (30,263) |
11am:
| Preston: | 2.8% (56) |
| Idaho: | 2.4% (14,138) |
12pm:
| Preston: | 1.2% (24) |
| Idaho: | 1.3% (7,838) |
4pm:
| Preston: | 7.1% (143) |
| Idaho: | 6.4% (38,225) |
>4pm:
| Preston: | 8.9% (179) |
| Idaho: | 7.0% (41,894) |

12:00 a.m. to 4:59 a.m. - Males:
| Preston: | 13.0% (182) |
| Idaho: | 6.4% (27,941) |
5:00 a.m. to 5:29 a.m. - Males:
| Preston: | 6.0% (85) |
| Idaho: | 4.4% (19,142) |
5:30 a.m. to 5:59 a.m. - Males:
| Preston: | 11.3% (159) |
| Idaho: | 6.7% (29,205) |
6:00 a.m. to 6:29 a.m. - Males:
| Preston: | 13.4% (188) |
| Idaho: | 9.0% (39,233) |
6:30 a.m. to 6:59 a.m. - Males:
| Preston: | 7.5% (106) |
| Idaho: | 10.9% (47,476) |
7:00 a.m. to 7:29 a.m. - Males:
| Preston: | 10.0% (141) |
| Idaho: | 15.4% (67,430) |
7:30 a.m. to 7:59 a.m. - Males:
| Preston: | 7.4% (104) |
| Idaho: | 12.0% (52,388) |
8:00 a.m. to 8:29 a.m. - Males:
| Preston: | 8.5% (119) |
| Idaho: | 10.2% (44,680) |
9:00 a.m. to 9:59 a.m. - Males:
| Preston: | 6.4% (90) |
| Idaho: | 5.7% (25,145) |
11:00 a.m. to 11:59 a.m. - Males:
| Preston: | 1.3% (18) |
| Idaho: | 0.8% (3,676) |
12:00 p.m. to 3:59 p.m. - Males:
| Preston: | 7.4% (104) |
| Idaho: | 6.1% (26,742) |
4:00 p.m. to 11:59 p.m. - Males:
| Preston: | 8.4% (118) |
| Idaho: | 5.9% (25,707) |

12:00 a.m. to 4:59 a.m. - Females:
| Preston: | 3.2% (31) |
| Idaho: | 3.0% (10,545) |
5:00 a.m. to 5:29 a.m. - Females:
| Preston: | 9.3% (91) |
| Idaho: | 2.6% (9,340) |
5:30 a.m. to 5:59 a.m. - Females:
| Preston: | 6.3% (61) |
| Idaho: | 3.3% (11,588) |
6:00 a.m. to 6:29 a.m. - Females:
| Preston: | 1.7% (17) |
| Idaho: | 5.0% (17,680) |
6:30 a.m. to 6:59 a.m. - Females:
| Preston: | 14.1% (138) |
| Idaho: | 10.0% (35,463) |
7:00 a.m. to 7:29 a.m. - Females:
| Preston: | 9.4% (91) |
| Idaho: | 14.7% (52,040) |
7:30 a.m. to 7:59 a.m. - Females:
| Preston: | 10.0% (97) |
| Idaho: | 16.6% (58,923) |
8:00 a.m. to 8:29 a.m. - Females:
| Preston: | 6.6% (65) |
| Idaho: | 10.7% (37,875) |
8:30 a.m. to 8:59 a.m. - Females:
| Preston: | 3.8% (38) |
| Idaho: | 7.5% (26,717) |
10:00 a.m. to 10:59 a.m. - Females:
| Preston: | 0.2% (2) |
| Idaho: | 3.9% (13,906) |
12:00 p.m. to 3:59 p.m. - Females:
| Preston: | 16.9% (165) |
| Idaho: | 6.4% (22,509) |
4:00 p.m. to 11:59 p.m. - Females:
| Preston: | 18.1% (176) |
| Idaho: | 6.5% (23,001) |
Travel time to work
Percentage of workers working in this county: 56.6%
Number of people working at home: 132 (5.1% of all workers)
Number of people working at home: 132 (5.1% of all workers)

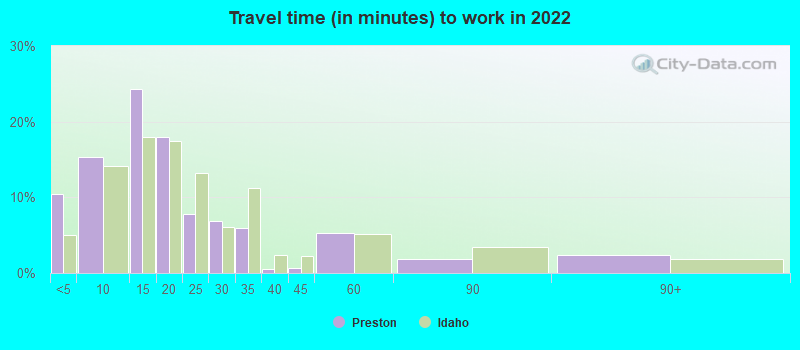

Less than 5 minutes:
| Preston: | 10.4% (277) |
| Idaho: | 5.0% (38,660) |
5 to 9 minutes:
| Preston: | 15.3% (406) |
| Idaho: | 14.1% (109,464) |
10 to 14 minutes:
| Preston: | 24.3% (643) |
| Idaho: | 18.0% (139,208) |
15 to 19 minutes:
| Preston: | 17.9% (475) |
| Idaho: | 17.4% (134,712) |
20 to 24 minutes:
| Preston: | 7.8% (207) |
| Idaho: | 13.2% (102,311) |
25 to 29 minutes:
| Preston: | 6.9% (182) |
| Idaho: | 6.1% (47,344) |
30 to 34 minutes:
| Preston: | 6.0% (158) |
| Idaho: | 11.2% (86,445) |
35 to 39 minutes:
| Preston: | 0.6% (15) |
| Idaho: | 2.3% (17,950) |
40 to 44 minutes:
| Preston: | 0.6% (16) |
| Idaho: | 2.2% (16,968) |
45 to 59 minutes:
| Preston: | 5.3% (140) |
| Idaho: | 5.2% (40,109) |
60 to 89 minutes:
| Preston: | 1.9% (50) |
| Idaho: | 3.4% (26,161) |
90 or more minutes:
| Preston: | 2.4% (64) |
| Idaho: | 1.9% (14,591) |


Less than 5 minutes:
| Preston: | 12.1% (244) |
| Idaho: | 5.6% (33,498) |
5 to 9 minutes:
| Preston: | 26.8% (542) |
| Idaho: | 16.5% (97,904) |
10 to 14 minutes:
| Preston: | 11.9% (240) |
| Idaho: | 19.2% (114,280) |
15 to 19 minutes:
| Preston: | 4.1% (82) |
| Idaho: | 16.6% (98,780) |
20 to 24 minutes:
| Preston: | 4.8% (96) |
| Idaho: | 12.7% (75,542) |
25 to 29 minutes:
| Preston: | 3.9% (79) |
| Idaho: | 4.2% (25,171) |
30 to 34 minutes:
| Preston: | 13.1% (264) |
| Idaho: | 8.8% (52,220) |
35 to 39 minutes:
| Preston: | 2.1% (43) |
| Idaho: | 1.3% (7,971) |
40 to 44 minutes:
| Preston: | 2.9% (59) |
| Idaho: | 1.8% (10,637) |
45 to 59 minutes:
| Preston: | 9.9% (201) |
| Idaho: | 4.0% (23,525) |
60 to 89 minutes:
| Preston: | 1.4% (29) |
| Idaho: | 2.7% (16,010) |
90 or more minutes:
| Preston: | 3.6% (72) |
| Idaho: | 1.9% (11,103) |

Less than 5 minutes - Males:
| Preston: | 11.7% (163) |
| Idaho: | 5.1% (21,549) |
5 to 9 minutes - Males:
| Preston: | 11.7% (163) |
| Idaho: | 12.4% (52,683) |
10 to 14 minutes - Males:
| Preston: | 27.3% (380) |
| Idaho: | 16.1% (68,663) |
15 to 19 minutes - Males:
| Preston: | 14.7% (205) |
| Idaho: | 17.8% (75,582) |
20 to 24 minutes - Males:
| Preston: | 6.1% (85) |
| Idaho: | 12.9% (54,832) |
25 to 29 minutes - Males:
| Preston: | 4.2% (58) |
| Idaho: | 5.9% (24,923) |
30 to 34 minutes - Males:
| Preston: | 9.0% (125) |
| Idaho: | 12.3% (52,425) |
40 to 44 minutes - Males:
| Preston: | 1.1% (15) |
| Idaho: | 2.1% (9,026) |
45 to 59 minutes - Males:
| Preston: | 5.0% (69) |
| Idaho: | 6.2% (26,423) |
60 to 89 minutes - Males:
| Preston: | 3.8% (53) |
| Idaho: | 4.5% (19,346) |
90 or more minutes - Males:
| Preston: | 4.1% (57) |
| Idaho: | 2.2% (9,414) |

Less than 5 minutes - Females:
| Preston: | 9.0% (114) |
| Idaho: | 4.9% (17,111) |
5 to 9 minutes - Females:
| Preston: | 19.5% (246) |
| Idaho: | 16.3% (56,781) |
10 to 14 minutes - Females:
| Preston: | 20.1% (253) |
| Idaho: | 20.2% (70,545) |
15 to 19 minutes - Females:
| Preston: | 21.1% (266) |
| Idaho: | 17.0% (59,130) |
20 to 24 minutes - Females:
| Preston: | 9.9% (124) |
| Idaho: | 13.6% (47,479) |
25 to 29 minutes - Females:
| Preston: | 9.9% (125) |
| Idaho: | 6.4% (22,421) |
30 to 34 minutes - Females:
| Preston: | 2.8% (35) |
| Idaho: | 9.8% (34,020) |
35 to 39 minutes - Females:
| Preston: | 1.1% (14) |
| Idaho: | 2.1% (7,428) |
45 to 59 minutes - Females:
| Preston: | 5.3% (67) |
| Idaho: | 3.9% (13,686) |
60 to 89 minutes - Females:
| Preston: | 0.1% (1) |
| Idaho: | 2.0% (6,815) |
90 or more minutes - Females:
| Preston: | 0.3% (4) |
| Idaho: | 1.5% (5,177) |
Means of transportation to work
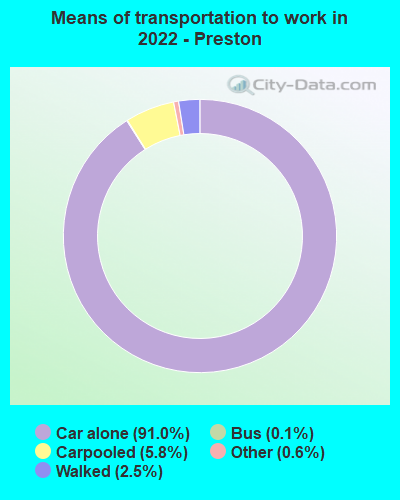

Drove car alone:
| Preston: | 91.0% (2,476) |
| Idaho: | 83.1% (288,170) |
Carpooled:
| Preston: | 5.8% (157) |
| Idaho: | 10.3% (38,208) |
Bus:
| Preston: | 0.1% (3) |
| Idaho: | 0.6% (1,985) |
Walked:
| Preston: | 2.5% (69) |
| Idaho: | 3.4% (13,096) |
Other means:
| Preston: | 0.6% (17) |
| Idaho: | 1.6% (4,296) |

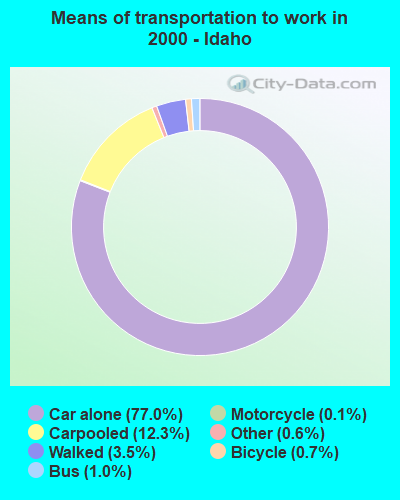
Drove car alone:
| Preston: | 77.3% (1,562) |
| Idaho: | 77.0% (457,986) |
Carpooled:
| Preston: | 13.7% (277) |
| Idaho: | 12.3% (73,273) |
Bicycle:
| Preston: | 0.8% (17) |
| Idaho: | 0.7% (3,942) |
Walked:
| Preston: | 4.7% (95) |
| Idaho: | 3.5% (20,747) |

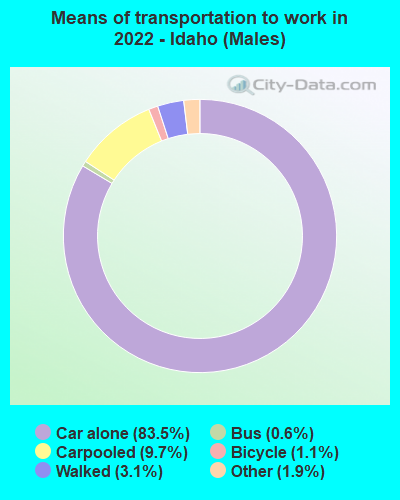
Drove car alone - Males:
| Preston: | 91.3% (1,304) |
| Idaho: | 83.5% (288,170) |
Carpooled - Males:
| Preston: | 7.4% (106) |
| Idaho: | 9.7% (38,208) |
Bus - Males:
| Preston: | 0.2% (3) |
| Idaho: | 0.6% (1,985) |
Walked - Males:
| Preston: | 0.1% (1) |
| Idaho: | 3.1% (13,096) |
Other means - Males:
| Preston: | 1.0% (14) |
| Idaho: | 1.9% (4,296) |


Drove car alone - Females:
| Preston: | 90.5% (1,172) |
| Idaho: | 82.7% (288,170) |
Carpooled - Females:
| Preston: | 4.0% (51) |
| Idaho: | 11.0% (38,208) |
Walked - Females:
| Preston: | 5.3% (68) |
| Idaho: | 3.8% (13,096) |
Other means - Females:
| Preston: | 0.2% (3) |
| Idaho: | 1.2% (4,296) |
Private vehicle occupancy

Drove alone:
| Preston: | 93.3% (2,129) |
| Idaho: | 89.2% (659,710) |
In 2 person carpool:
| Preston: | 5.0% (114) |
| Idaho: | 7.6% (56,069) |
In 4 person carpool:
| Preston: | 1.6% (37) |
| Idaho: | 0.7% (4,987) |

Drove alone:
| Preston: | 84.9% (1,562) |
| Idaho: | 86.2% (457,986) |
In 2 person carpool:
| Preston: | 10.0% (184) |
| Idaho: | 10.9% (57,673) |
In 3 person carpool:
| Preston: | 4.3% (79) |
| Idaho: | 1.9% (10,359) |
In 4 person carpool:
| Preston: | 0.5% (9) |
| Idaho: | 0.6% (3,259) |
In 5-6 person carpool:
| Preston: | 0.3% (5) |
| Idaho: | 0.2% (1,320) |
Class of workers

Employee of private company:
| Preston: | 74.4% (1,912) |
| Idaho: | 65.4% (602,553) |
Self-employed in own incorporated business:
| Preston: | 5.0% (128) |
| Idaho: | 5.1% (46,572) |
Private not-for-profit wage and salary workers:
| Preston: | 7.2% (186) |
| Idaho: | 7.4% (68,554) |
Local government workers:
| Preston: | 9.1% (234) |
| Idaho: | 7.2% (66,734) |
State government workers:
| Preston: | 3.7% (96) |
| Idaho: | 4.7% (43,034) |
Federal government workers:
| Preston: | 0.0% (1) |
| Idaho: | 2.5% (22,697) |
Self-employed workers in own not incorporated business:
| Preston: | 0.6% (15) |
| Idaho: | 7.5% (69,152) |

Employee of private company:
| Preston: | 71.4% (1,480) |
| Idaho: | 64.3% (385,183) |
Self-employed in own incorporated business:
| Preston: | 2.6% (53) |
| Idaho: | 3.8% (22,846) |
Private not-for-profit wage and salary workers:
| Preston: | 3.0% (62) |
| Idaho: | 5.8% (34,500) |
Local government workers:
| Preston: | 9.8% (204) |
| Idaho: | 6.5% (39,078) |
State government workers:
| Preston: | 3.1% (65) |
| Idaho: | 6.7% (40,017) |
Self-employed workers in own not incorporated business:
| Preston: | 10.0% (208) |
| Idaho: | 9.3% (56,018) |

Employee of private company - Males:
| Preston: | 87.5% (1,311) |
| Idaho: | 69.5% (346,347) |
Self-employed in own incorporated business - Males:
| Preston: | 3.6% (54) |
| Idaho: | 6.1% (30,431) |
Private not-for-profit wage and salary workers - Males:
| Preston: | 2.0% (31) |
| Idaho: | 5.1% (25,377) |
Local government workers - Males:
| Preston: | 3.4% (52) |
| Idaho: | 5.2% (25,672) |
State government workers - Males:
| Preston: | 3.4% (51) |
| Idaho: | 3.5% (17,440) |
Federal government workers - Males:
| Preston: | 0.1% (1) |
| Idaho: | 2.8% (13,794) |

Employee of private company - Females:
| Preston: | 56.0% (601) |
| Idaho: | 60.6% (256,206) |
Self-employed in own incorporated business - Females:
| Preston: | 6.9% (74) |
| Idaho: | 3.8% (16,141) |
Private not-for-profit wage and salary workers - Females:
| Preston: | 14.5% (155) |
| Idaho: | 10.2% (43,177) |
Local government workers - Females:
| Preston: | 17.0% (182) |
| Idaho: | 9.7% (41,062) |
State government workers - Females:
| Preston: | 4.2% (45) |
| Idaho: | 6.1% (25,594) |
Self-employed workers in own not incorporated business - Females:
| Preston: | 1.4% (15) |
| Idaho: | 7.2% (30,590) |