Work and Jobs in Princeton, New Jersey (NJ) Detailed Stats
Occupations, Industries, Unemployment, Workers, Commute
Settings
X


Recent posts about work in Princeton, New Jersey on our local forum with over 2,400,000 registered users:

Latest news about work in Princeton, NJ collected exclusively by city-data.com from local newspapers, TV, and radio stations
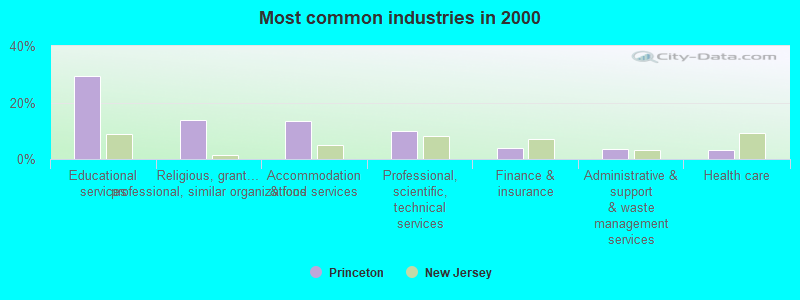
The most common industries in Princeton are: Educational services (29.5% of civilian employees), Religious, grantmaking, civic, professional, similar organizations (13.9% of civilian employees), Accommodation & food services (13.5% of civilian employees). 76.2% of workers work in Mercer County and 30.5% of all workers work at home. 52.8% of workers are employees of private companies, which is 30.3% less than the rate of 68.8% across the entire state of New Jersey.
Whole page based on the data from 2000 / 2022 when the population of Princeton, New Jersey was 14,203 / 30,208
Whole page based on the data from 2000 / 2022 when the population of Princeton, New Jersey was 14,203 / 30,208
Most common industries
Most common industries | |||
|---|---|---|---|
Industry | All | Males | Females |
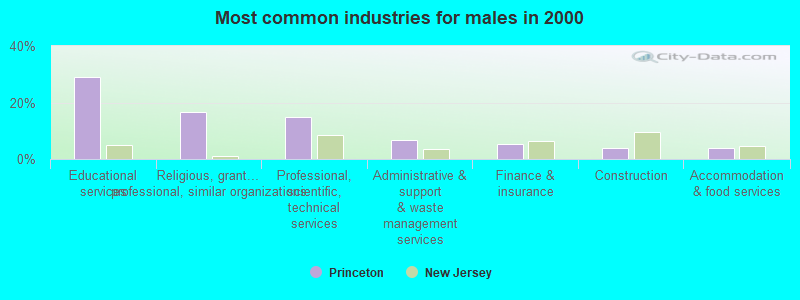
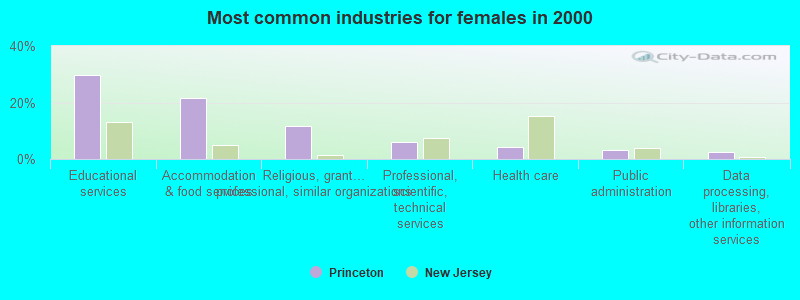
| Educational services | 29.5% (1,700) | 29.1% (774) | 29.8% (926) |
| Religious, grantmaking, civic, professional, and similar organizations | 13.9% (802) | 16.6% (441) | 11.6% (361) |
| Accommodation and food services | 13.5% (776) | 4.0% (106) | 21.6% (670) |
| Professional, scientific, and technical services | 10.0% (574) | 14.7% (392) | 5.9% (182) |
| Finance and insurance | 3.7% (215) | 5.5% (146) | 2.2% (69) |
| Administrative and support and waste management services | 3.7% (213) | 6.8% (180) | 1.1% (33) |
| Health care | 3.3% (193) | 2.1% (56) | 4.4% (137) |
| Public administration | 2.3% (134) | 1.4% (36) | 3.2% (98) |
| Construction | 2.0% (113) | 4.0% (106) | 0.2% (7) |
| Arts, entertainment, and recreation | 1.9% (109) | 1.3% (35) | 2.4% (74) |
| Data processing, libraries, and other information services | 1.8% (101) | 0.7% (19) | 2.6% (82) |
| Publishing, and motion picture and sound recording industries | 1.7% (97) | 2.7% (72) | 0.8% (25) |
| Chemicals | 1.5% (85) | 1.8% (47) | 1.2% (38) |
| Broadcasting and telecommunications | 1.1% (62) | 1.6% (43) | 0.6% (19) |
| Social assistance | 1.0% (55) | 0.5% (13) | 1.4% (42) |
| Machinery | 0.7% (43) | 0.0% (0) | 1.4% (43) |
| Private households | 0.7% (42) | 0.0% (0) | 1.4% (42) |
| Real estate and rental and leasing | 0.7% (38) | 0.7% (18) | 0.6% (20) |
| Food and beverage stores | 0.7% (38) | 0.7% (19) | 0.6% (19) |
| Used merchandise, gift, novelty, and souvenir, and other miscellaneous stores | 0.6% (33) | 0.0% (0) | 1.1% (33) |
| Personal and laundry services | 0.6% (32) | 0.0% (0) | 1.0% (32) |
| Clothing and accessories, including shoe, stores | 0.5% (27) | 0.0% (0) | 0.9% (27) |
| Sporting goods, camera, and hobby and toy stores | 0.4% (23) | 0.0% (0) | 0.7% (23) |
| Furniture and home furnishings, and household appliance stores | 0.3% (20) | 0.3% (8) | 0.4% (12) |
| Food | 0.3% (19) | 0.7% (19) | 0.0% (0) |
| Agriculture, forestry, fishing and hunting | 0.3% (17) | 0.0% (0) | 0.5% (17) |
| Miscellaneous nondurable goods merchant wholesalers | 0.3% (17) | 0.6% (17) | 0.0% (0) |
| Repair and maintenance | 0.3% (17) | 0.6% (17) | 0.0% (0) |
| Computer and electronic products | 0.3% (15) | 0.2% (5) | 0.3% (10) |
| Drugs, sundries, and chemical and allied products merchant wholesalers | 0.2% (14) | 0.0% (0) | 0.5% (14) |
| Beverage and tobacco products | 0.2% (14) | 0.5% (14) | 0.0% (0) |
| Printing and related support activities | 0.2% (13) | 0.4% (10) | 0.1% (3) |
| Radio, TV, and computer stores | 0.2% (13) | 0.0% (1) | 0.4% (12) |
| Electrical equipment, appliances, and components | 0.2% (12) | 0.5% (12) | 0.0% (0) |
| Book stores and news dealers | 0.2% (11) | 0.4% (11) | 0.0% (0) |
| Miscellaneous manufacturing | 0.2% (11) | 0.4% (10) | 0.0% (1) |
| Pharmacies and drug stores | 0.2% (11) | 0.4% (11) | 0.0% (0) |
| Apparel, fabrics, and notions merchant wholesalers | 0.2% (10) | 0.0% (0) | 0.3% (10) |
| Farm supplies merchant wholesalers | 0.2% (10) | 0.0% (0) | 0.3% (10) |
| Retail florists | 0.2% (9) | 0.3% (9) | 0.0% (0) |
| Building material and garden equipment and supplies dealers | 0.1% (7) | 0.3% (7) | 0.0% (0) |
| Petroleum and petroleum products merchant wholesalers | 0.1% (6) | 0.0% (0) | 0.2% (6) |
| Electronic shopping and mail-order houses | 0.1% (5) | 0.2% (5) | 0.0% (0) |
| Other transportation, and support activities, and couriers | 0.1% (4) | 0.2% (4) | 0.0% (0) |
Unemployment in Princeton
- Unemployment by race in 2022
- Unemployment rate for White non-Hispanic residents
- 1.6%Males
- 4.0%Females
- Unemployment rate for Black residents
- 1.3%Males
- 2.3%Females
- Unemployment rate for American Indian and Alaska Native residents
- 0.3%Males
- 77.3%Females
- Unemployment rate for Asian residents
- 4.5%Males
- 8.2%Females
- Unemployment rate for two or more race residents
- 2.7%Males
- 3.4%Females
- Unemployment rate for Hispanic or Latino residents
- 6.5%Males
- 11.2%Females
- Unemployment by race in 2000
- Unemployment rate for White non-Hispanic residents
- 49.3%Males
- 30.0%Females
- Unemployment rate for Black residents
- 72.3%Males
- 39.3%Females
- Unemployment rate for Asian residents
- 72.0%Males
- 63.0%Females
- Unemployment rate for other race residents
- 4.1%Males
- Unemployment rate for two or more race residents
- 38.7%Males
- 41.5%Females
- Unemployment rate for Hispanic or Latino residents
- 13.3%Males
- 30.0%Females
Time leaving home to go to work

12:00 a.m. to 4:59 a.m.:
| Princeton: | 0.7% (69) |
| New Jersey: | 3.8% (147,155) |
5:00 a.m. to 5:29 a.m.:
| Princeton: | 1.4% (134) |
| New Jersey: | 2.8% (107,136) |
5:30 a.m. to 5:59 a.m.:
| Princeton: | 0.9% (86) |
| New Jersey: | 4.0% (154,533) |
6:00 a.m. to 6:29 a.m.:
| Princeton: | 2.5% (236) |
| New Jersey: | 7.9% (305,654) |
6:30 a.m. to 6:59 a.m.:
| Princeton: | 4.6% (446) |
| New Jersey: | 8.9% (340,440) |
7:00 a.m. to 7:29 a.m.:
| Princeton: | 8.2% (791) |
| New Jersey: | 13.9% (534,088) |
7:30 a.m. to 7:59 a.m.:
| Princeton: | 12.9% (1,242) |
| New Jersey: | 12.3% (471,489) |
8:00 a.m. to 8:29 a.m.:
| Princeton: | 20.0% (1,919) |
| New Jersey: | 14.1% (542,061) |
8:30 a.m. to 8:59 a.m.:
| Princeton: | 12.9% (1,237) |
| New Jersey: | 7.7% (295,841) |
9:00 a.m. to 9:59 a.m.:
| Princeton: | 16.8% (1,611) |
| New Jersey: | 8.2% (315,306) |
10:00 a.m. to 10:59 a.m.:
| Princeton: | 3.7% (355) |
| New Jersey: | 3.2% (121,390) |
11:00 a.m. to 11:59 a.m.:
| Princeton: | 4.4% (420) |
| New Jersey: | 1.5% (56,797) |
12:00 p.m. to 3:59 p.m.:
| Princeton: | 6.8% (657) |
| New Jersey: | 6.2% (238,009) |
4:00 p.m. to 11:59 p.m.:
| Princeton: | 5.3% (508) |
| New Jersey: | 5.6% (215,268) |

<5am:
| Princeton: | 0.6% (36) |
| New Jersey: | 2.4% (92,776) |
5:30am:
| Princeton: | 0.6% (36) |
| New Jersey: | 2.1% (83,147) |
6am:
| Princeton: | 0.4% (25) |
| New Jersey: | 3.2% (124,191) |
6:30am:
| Princeton: | 2.3% (132) |
| New Jersey: | 7.7% (297,494) |
7am:
| Princeton: | 4.4% (252) |
| New Jersey: | 9.5% (369,088) |
7:30am:
| Princeton: | 7.2% (412) |
| New Jersey: | 14.4% (558,435) |
8am:
| Princeton: | 10.3% (589) |
| New Jersey: | 15.3% (592,839) |
8:30am:
| Princeton: | 11.8% (678) |
| New Jersey: | 14.0% (541,137) |
9am:
| Princeton: | 10.0% (571) |
| New Jersey: | 7.6% (295,834) |
10am:
| Princeton: | 11.0% (631) |
| New Jersey: | 6.4% (246,745) |
11am:
| Princeton: | 3.3% (187) |
| New Jersey: | 2.4% (92,391) |
12pm:
| Princeton: | 1.3% (75) |
| New Jersey: | 1.1% (43,997) |
4pm:
| Princeton: | 8.9% (511) |
| New Jersey: | 5.5% (213,079) |
>4pm:
| Princeton: | 21.9% (1,254) |
| New Jersey: | 5.6% (218,724) |

12:00 a.m. to 4:59 a.m. - Males:
| Princeton: | 2.1% (114) |
| New Jersey: | 4.9% (100,687) |
5:00 a.m. to 5:29 a.m. - Males:
| Princeton: | 0.8% (44) |
| New Jersey: | 4.0% (82,885) |
5:30 a.m. to 5:59 a.m. - Males:
| Princeton: | 1.3% (72) |
| New Jersey: | 5.1% (104,431) |
6:00 a.m. to 6:29 a.m. - Males:
| Princeton: | 3.0% (164) |
| New Jersey: | 9.7% (200,451) |
6:30 a.m. to 6:59 a.m. - Males:
| Princeton: | 4.5% (245) |
| New Jersey: | 9.3% (191,368) |
7:00 a.m. to 7:29 a.m. - Males:
| Princeton: | 9.3% (507) |
| New Jersey: | 14.0% (288,907) |
7:30 a.m. to 7:59 a.m. - Males:
| Princeton: | 15.6% (849) |
| New Jersey: | 10.9% (224,409) |
8:00 a.m. to 8:29 a.m. - Males:
| Princeton: | 22.0% (1,201) |
| New Jersey: | 12.2% (251,968) |
8:30 a.m. to 8:59 a.m. - Males:
| Princeton: | 13.7% (748) |
| New Jersey: | 6.5% (133,460) |
9:00 a.m. to 9:59 a.m. - Males:
| Princeton: | 15.5% (845) |
| New Jersey: | 7.2% (148,957) |
10:00 a.m. to 10:59 a.m. - Males:
| Princeton: | 3.6% (196) |
| New Jersey: | 2.8% (58,200) |
11:00 a.m. to 11:59 a.m. - Males:
| Princeton: | 3.6% (195) |
| New Jersey: | 1.4% (29,175) |
12:00 p.m. to 3:59 p.m. - Males:
| Princeton: | 5.1% (278) |
| New Jersey: | 6.2% (126,671) |
4:00 p.m. to 11:59 p.m. - Males:
| Princeton: | 2.6% (140) |
| New Jersey: | 5.7% (117,720) |

5:00 a.m. to 5:29 a.m. - Females:
| Princeton: | 2.1% (86) |
| New Jersey: | 1.4% (24,251) |
5:30 a.m. to 5:59 a.m. - Females:
| Princeton: | 0.1% (4) |
| New Jersey: | 2.8% (50,102) |
6:00 a.m. to 6:29 a.m. - Females:
| Princeton: | 1.6% (68) |
| New Jersey: | 5.9% (105,203) |
6:30 a.m. to 6:59 a.m. - Females:
| Princeton: | 4.9% (202) |
| New Jersey: | 8.3% (149,072) |
7:00 a.m. to 7:29 a.m. - Females:
| Princeton: | 6.9% (287) |
| New Jersey: | 13.7% (245,181) |
7:30 a.m. to 7:59 a.m. - Females:
| Princeton: | 10.5% (433) |
| New Jersey: | 13.8% (247,080) |
8:00 a.m. to 8:29 a.m. - Females:
| Princeton: | 18.3% (757) |
| New Jersey: | 16.2% (290,093) |
8:30 a.m. to 8:59 a.m. - Females:
| Princeton: | 12.4% (512) |
| New Jersey: | 9.1% (162,381) |
9:00 a.m. to 9:59 a.m. - Females:
| Princeton: | 17.1% (705) |
| New Jersey: | 9.3% (166,349) |
10:00 a.m. to 10:59 a.m. - Females:
| Princeton: | 3.3% (136) |
| New Jersey: | 3.5% (63,190) |
11:00 a.m. to 11:59 a.m. - Females:
| Princeton: | 5.0% (208) |
| New Jersey: | 1.5% (27,622) |
12:00 p.m. to 3:59 p.m. - Females:
| Princeton: | 9.5% (391) |
| New Jersey: | 6.2% (111,338) |
4:00 p.m. to 11:59 p.m. - Females:
| Princeton: | 8.6% (354) |
| New Jersey: | 5.5% (97,548) |
Travel time to work
Percentage of workers working in this county: 76.2%
Number of people working at home: 4,392 (30.5% of all workers)
Daytime population change due to commuting: +17,538 (+123.5%)
Workers who live and work in this borough: 2,181 (38.1%)
Number of people working at home: 4,392 (30.5% of all workers)
Daytime population change due to commuting: +17,538 (+123.5%)
Workers who live and work in this borough: 2,181 (38.1%)

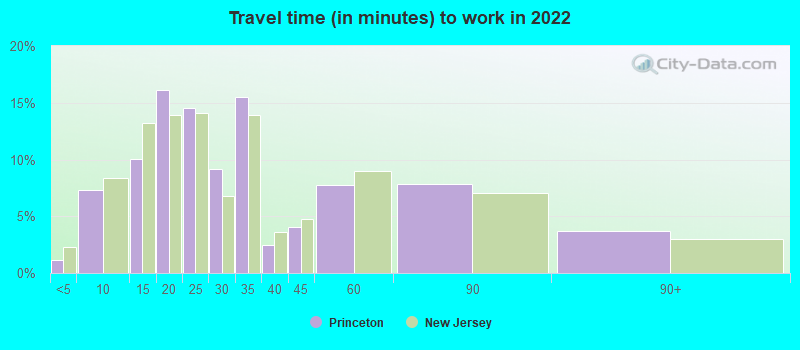

Less than 5 minutes:
| Princeton: | 1.2% (294) |
| New Jersey: | 2.3% (81,825) |
5 to 9 minutes:
| Princeton: | 7.3% (1,838) |
| New Jersey: | 8.3% (298,192) |
10 to 14 minutes:
| Princeton: | 10.1% (2,542) |
| New Jersey: | 13.3% (473,288) |
15 to 19 minutes:
| Princeton: | 16.1% (4,064) |
| New Jersey: | 13.9% (498,065) |
20 to 24 minutes:
| Princeton: | 14.5% (3,666) |
| New Jersey: | 14.1% (502,432) |
25 to 29 minutes:
| Princeton: | 9.2% (2,318) |
| New Jersey: | 6.8% (242,857) |
30 to 34 minutes:
| Princeton: | 15.5% (3,909) |
| New Jersey: | 13.9% (496,723) |
35 to 39 minutes:
| Princeton: | 2.5% (619) |
| New Jersey: | 3.6% (130,069) |
40 to 44 minutes:
| Princeton: | 4.0% (1,012) |
| New Jersey: | 4.7% (168,760) |
45 to 59 minutes:
| Princeton: | 7.7% (1,953) |
| New Jersey: | 9.0% (320,422) |
60 to 89 minutes:
| Princeton: | 7.8% (1,975) |
| New Jersey: | 7.1% (252,432) |
90 or more minutes:
| Princeton: | 3.7% (940) |
| New Jersey: | 3.0% (106,190) |


Less than 5 minutes:
| Princeton: | 12.9% (738) |
| New Jersey: | 2.6% (99,241) |
5 to 9 minutes:
| Princeton: | 18.2% (1,041) |
| New Jersey: | 9.0% (347,598) |
10 to 14 minutes:
| Princeton: | 19.2% (1,101) |
| New Jersey: | 12.5% (482,988) |
15 to 19 minutes:
| Princeton: | 9.9% (564) |
| New Jersey: | 13.2% (510,571) |
20 to 24 minutes:
| Princeton: | 7.4% (422) |
| New Jersey: | 12.8% (497,467) |
25 to 29 minutes:
| Princeton: | 6.5% (371) |
| New Jersey: | 5.4% (210,226) |
30 to 34 minutes:
| Princeton: | 7.1% (409) |
| New Jersey: | 12.7% (492,539) |
35 to 39 minutes:
| Princeton: | 1.1% (64) |
| New Jersey: | 2.8% (109,571) |
40 to 44 minutes:
| Princeton: | 1.7% (96) |
| New Jersey: | 4.0% (156,148) |
45 to 59 minutes:
| Princeton: | 2.6% (149) |
| New Jersey: | 9.1% (352,609) |
60 to 89 minutes:
| Princeton: | 2.8% (158) |
| New Jersey: | 8.7% (335,777) |
90 or more minutes:
| Princeton: | 4.8% (276) |
| New Jersey: | 4.5% (175,142) |

Less than 5 minutes - Males:
| Princeton: | 1.4% (179) |
| New Jersey: | 2.3% (44,228) |
5 to 9 minutes - Males:
| Princeton: | 7.5% (946) |
| New Jersey: | 7.0% (133,825) |
10 to 14 minutes - Males:
| Princeton: | 8.1% (1,023) |
| New Jersey: | 11.3% (215,430) |
15 to 19 minutes - Males:
| Princeton: | 18.3% (2,305) |
| New Jersey: | 13.4% (254,987) |
20 to 24 minutes - Males:
| Princeton: | 14.7% (1,848) |
| New Jersey: | 13.8% (262,577) |
25 to 29 minutes - Males:
| Princeton: | 6.3% (793) |
| New Jersey: | 6.3% (119,569) |
30 to 34 minutes - Males:
| Princeton: | 16.4% (2,064) |
| New Jersey: | 14.4% (275,270) |
35 to 39 minutes - Males:
| Princeton: | 2.3% (285) |
| New Jersey: | 4.0% (76,254) |
40 to 44 minutes - Males:
| Princeton: | 2.8% (349) |
| New Jersey: | 5.2% (99,982) |
45 to 59 minutes - Males:
| Princeton: | 8.0% (1,008) |
| New Jersey: | 9.9% (187,910) |
60 to 89 minutes - Males:
| Princeton: | 10.6% (1,336) |
| New Jersey: | 8.8% (167,057) |
90 or more minutes - Males:
| Princeton: | 2.8% (356) |
| New Jersey: | 3.7% (70,611) |

Less than 5 minutes - Females:
| Princeton: | 0.8% (104) |
| New Jersey: | 2.3% (37,597) |
5 to 9 minutes - Females:
| Princeton: | 7.0% (889) |
| New Jersey: | 9.9% (164,367) |
10 to 14 minutes - Females:
| Princeton: | 12.0% (1,520) |
| New Jersey: | 15.5% (257,858) |
15 to 19 minutes - Females:
| Princeton: | 14.1% (1,783) |
| New Jersey: | 14.6% (243,078) |
20 to 24 minutes - Females:
| Princeton: | 14.4% (1,817) |
| New Jersey: | 14.4% (239,855) |
25 to 29 minutes - Females:
| Princeton: | 12.7% (1,607) |
| New Jersey: | 7.4% (123,288) |
30 to 34 minutes - Females:
| Princeton: | 14.5% (1,828) |
| New Jersey: | 13.3% (221,453) |
35 to 39 minutes - Females:
| Princeton: | 2.6% (331) |
| New Jersey: | 3.2% (53,815) |
40 to 44 minutes - Females:
| Princeton: | 4.7% (601) |
| New Jersey: | 4.1% (68,778) |
45 to 59 minutes - Females:
| Princeton: | 7.4% (942) |
| New Jersey: | 8.0% (132,512) |
60 to 89 minutes - Females:
| Princeton: | 5.1% (648) |
| New Jersey: | 5.1% (85,375) |
90 or more minutes - Females:
| Princeton: | 4.5% (569) |
| New Jersey: | 2.1% (35,579) |
Means of transportation to work
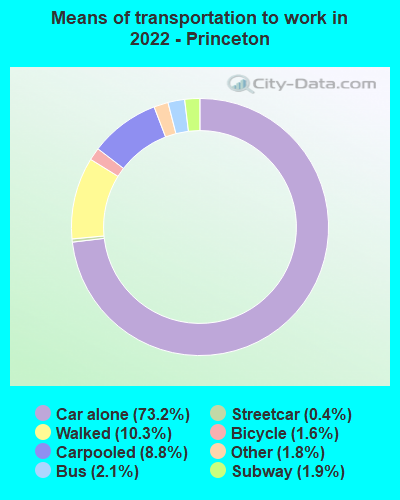

Drove car alone:
| Princeton: | 73.2% (18,977) |
| New Jersey: | 78.3% (1,290,804) |
Carpooled:
| Princeton: | 8.8% (2,271) |
| New Jersey: | 10.5% (178,194) |
Bus:
| Princeton: | 2.1% (534) |
| New Jersey: | 2.6% (51,576) |
Subway or elevated rail:
| Princeton: | 0.4% (107) |
| New Jersey: | 0.7% (10,397) |
Long-distance train or commuter rail:
| Princeton: | 1.9% (495) |
| New Jersey: | 0.6% (9,716) |
Bicycle:
| Princeton: | 1.6% (425) |
| New Jersey: | 0.4% (2,821) |
Walked:
| Princeton: | 10.3% (2,661) |
| New Jersey: | 3.8% (65,269) |
Other means:
| Princeton: | 1.8% (455) |
| New Jersey: | 2.8% (49,284) |

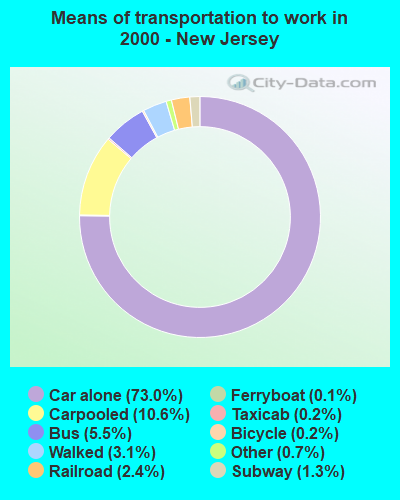
Drove car alone:
| Princeton: | 42.3% (2,418) |
| New Jersey: | 73.0% (2,828,303) |
Carpooled:
| Princeton: | 8.3% (475) |
| New Jersey: | 10.6% (412,299) |
Bus or trolley bus:
| Princeton: | 1.1% (64) |
| New Jersey: | 5.5% (213,067) |
Subway or elevated:
| Princeton: | 0.1% (5) |
| New Jersey: | 1.3% (50,279) |
Railroad:
| Princeton: | 3.6% (205) |
| New Jersey: | 2.4% (93,864) |
Ferryboat:
| Princeton: | 0.1% (4) |
| New Jersey: | 0.1% (4,904) |
Motorcycle:
| Princeton: | 0.2% (10) |
| New Jersey: | 0.0% (1,830) |
Bicycle:
| Princeton: | 2.6% (151) |
| New Jersey: | 0.2% (9,142) |
Walked:
| Princeton: | 35.6% (2,037) |
| New Jersey: | 3.1% (121,305) |
Other means:
| Princeton: | 0.3% (20) |
| New Jersey: | 0.7% (25,484) |

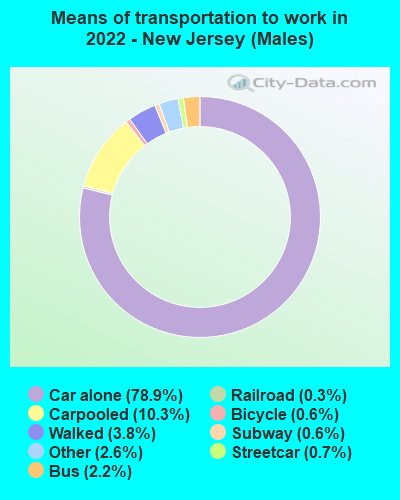
Drove car alone - Males:
| Princeton: | 73.9% (9,515) |
| New Jersey: | 78.9% (1,290,804) |
Carpooled - Males:
| Princeton: | 8.4% (1,078) |
| New Jersey: | 10.3% (178,194) |
Bus - Males:
| Princeton: | 1.6% (206) |
| New Jersey: | 2.2% (51,576) |
Long-distance train or commuter rail - Males:
| Princeton: | 0.9% (115) |
| New Jersey: | 0.6% (9,716) |
Bicycle - Males:
| Princeton: | 2.6% (340) |
| New Jersey: | 0.6% (2,821) |
Walked - Males:
| Princeton: | 11.3% (1,454) |
| New Jersey: | 3.8% (65,269) |
Other means - Males:
| Princeton: | 1.3% (171) |
| New Jersey: | 2.6% (49,284) |


Drove car alone - Females:
| Princeton: | 72.5% (9,465) |
| New Jersey: | 77.6% (1,290,804) |
Carpooled - Females:
| Princeton: | 9.1% (1,194) |
| New Jersey: | 10.7% (178,194) |
Bus - Females:
| Princeton: | 2.5% (329) |
| New Jersey: | 3.1% (51,576) |
Subway or elevated rail - Females:
| Princeton: | 0.8% (107) |
| New Jersey: | 0.6% (10,397) |
Long-distance train or commuter rail - Females:
| Princeton: | 2.9% (381) |
| New Jersey: | 0.6% (9,716) |
Bicycle - Females:
| Princeton: | 0.6% (85) |
| New Jersey: | 0.2% (2,821) |
Walked - Females:
| Princeton: | 9.2% (1,205) |
| New Jersey: | 3.9% (65,269) |
Other means - Females:
| Princeton: | 2.2% (285) |
| New Jersey: | 3.0% (49,284) |
Private vehicle occupancy

Drove alone:
| Princeton: | 91.0% (4,824) |
| New Jersey: | 88.1% (2,840,182) |
In 2 person carpool:
| Princeton: | 7.6% (403) |
| New Jersey: | 8.5% (274,126) |
In 3 person carpool:
| Princeton: | 0.4% (20) |
| New Jersey: | 1.9% (62,756) |
In 4 person carpool:
| Princeton: | 0.7% (37) |
| New Jersey: | 0.9% (27,905) |
In 7+ person carpool:
| Princeton: | 0.3% (18) |
| New Jersey: | 0.2% (6,421) |

Drove alone:
| Princeton: | 83.6% (2,418) |
| New Jersey: | 87.3% (2,828,303) |
In 2 person carpool:
| Princeton: | 10.9% (315) |
| New Jersey: | 9.6% (311,146) |
In 3 person carpool:
| Princeton: | 0.6% (16) |
| New Jersey: | 1.7% (55,192) |
In 4 person carpool:
| Princeton: | 4.0% (115) |
| New Jersey: | 0.7% (21,516) |
In 7+ person carpool:
| Princeton: | 1.0% (29) |
| New Jersey: | 0.4% (11,482) |
Class of workers

Employee of private company:
| Princeton: | 52.8% (7,996) |
| New Jersey: | 68.8% (3,236,727) |
Self-employed in own incorporated business:
| Princeton: | 4.6% (693) |
| New Jersey: | 4.0% (187,817) |
Private not-for-profit wage and salary workers:
| Princeton: | 28.0% (4,238) |
| New Jersey: | 7.9% (369,959) |
Local government workers:
| Princeton: | 3.0% (448) |
| New Jersey: | 8.4% (397,465) |
State government workers:
| Princeton: | 4.7% (716) |
| New Jersey: | 4.1% (190,835) |
Federal government workers:
| Princeton: | 0.7% (100) |
| New Jersey: | 2.0% (94,493) |
Self-employed workers in own not incorporated business:
| Princeton: | 6.3% (957) |
| New Jersey: | 4.7% (223,359) |

Employee of private company:
| Princeton: | 51.0% (2,940) |
| New Jersey: | 70.6% (2,789,718) |
Self-employed in own incorporated business:
| Princeton: | 2.8% (161) |
| New Jersey: | 3.8% (149,548) |
Private not-for-profit wage and salary workers:
| Princeton: | 32.5% (1,872) |
| New Jersey: | 6.4% (254,203) |
Local government workers:
| Princeton: | 4.0% (231) |
| New Jersey: | 7.9% (311,080) |
State government workers:
| Princeton: | 5.2% (300) |
| New Jersey: | 3.8% (151,067) |
Federal government workers:
| Princeton: | 0.6% (32) |
| New Jersey: | 2.2% (88,294) |
Self-employed workers in own not incorporated business:
| Princeton: | 4.0% (232) |
| New Jersey: | 5.0% (197,664) |

Employee of private company - Males:
| Princeton: | 57.6% (4,768) |
| New Jersey: | 72.0% (1,792,593) |
Self-employed in own incorporated business - Males:
| Princeton: | 5.3% (439) |
| New Jersey: | 5.0% (125,798) |
Private not-for-profit wage and salary workers - Males:
| Princeton: | 23.3% (1,931) |
| New Jersey: | 5.5% (135,866) |
Local government workers - Males:
| Princeton: | 2.1% (171) |
| New Jersey: | 6.3% (156,104) |
State government workers - Males:
| Princeton: | 3.9% (325) |
| New Jersey: | 3.5% (86,712) |
Federal government workers - Males:
| Princeton: | 0.8% (68) |
| New Jersey: | 2.4% (59,437) |
Self-employed workers in own not incorporated business - Males:
| Princeton: | 6.9% (572) |
| New Jersey: | 5.3% (132,027) |

Employee of private company - Females:
| Princeton: | 47.0% (3,228) |
| New Jersey: | 65.2% (1,444,134) |
Self-employed in own incorporated business - Females:
| Princeton: | 3.7% (254) |
| New Jersey: | 2.8% (62,019) |
Private not-for-profit wage and salary workers - Females:
| Princeton: | 33.6% (2,308) |
| New Jersey: | 10.6% (234,093) |
Local government workers - Females:
| Princeton: | 4.0% (277) |
| New Jersey: | 10.9% (241,361) |
State government workers - Females:
| Princeton: | 5.7% (391) |
| New Jersey: | 4.7% (104,123) |
Federal government workers - Females:
| Princeton: | 0.5% (32) |
| New Jersey: | 1.6% (35,056) |
Self-employed workers in own not incorporated business - Females:
| Princeton: | 5.6% (385) |
| New Jersey: | 4.1% (91,332) |