Work and Jobs in Redford, Michigan (MI) Detailed Stats
Occupations, Industries, Unemployment, Workers, Commute

Recent posts about work in Redford, Michigan on our local forum with over 2,400,000 registered users:
 | Redford not safe (14 replies) |
| Can Detroit ever make a comeback??? (88 replies) |
| Planning first trip to Detroit Michigan (13 replies) |
| Do Detroit's suburbs suffer from Detroit's reputation? (68 replies) |
| What Suburbs Are On The Rise? (70 replies) |
| Detroit suburbs (63 replies) |
Latest news about work in Redford, MI collected exclusively by city-data.com from local newspapers, TV, and radio stations
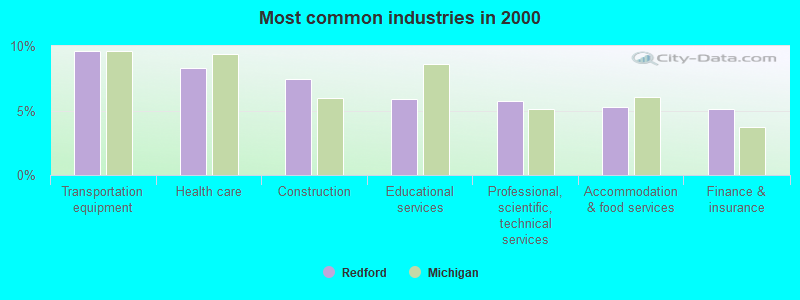
The most common industries in Redford are: Transportation equipment (9.6% of civilian employees), Health care (8.3% of civilian employees), Construction (7.4% of civilian employees). 79.2% of workers are employees of private companies, which is 9.1% greater than the rate of 71.9% across the entire state of Michigan.
Most common industries
Most common industries | |||
|---|---|---|---|
Industry | All | Males | Females |
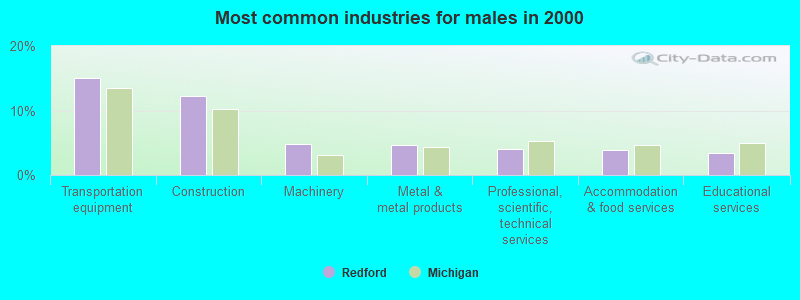
| Transportation equipment | 9.6% (2,427) | 15.0% (2,063) | 3.2% (364) |
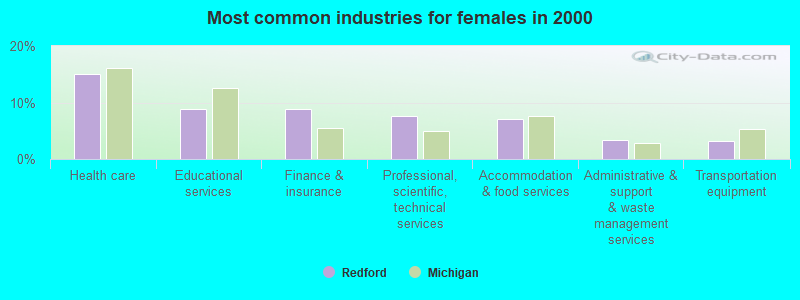
| Health care | 8.3% (2,096) | 2.8% (383) | 15.0% (1,713) |
| Construction | 7.4% (1,864) | 12.2% (1,673) | 1.7% (191) |
| Educational services | 5.9% (1,478) | 3.3% (459) | 8.9% (1,019) |
| Professional, scientific, and technical services | 5.7% (1,440) | 4.1% (561) | 7.7% (879) |
| Accommodation and food services | 5.3% (1,328) | 3.8% (523) | 7.0% (805) |
| Finance and insurance | 5.2% (1,297) | 2.1% (291) | 8.8% (1,006) |
| Metal and metal products | 3.3% (833) | 4.7% (646) | 1.6% (187) |
| Machinery | 3.2% (797) | 4.9% (666) | 1.1% (131) |
| Administrative and support and waste management services | 3.0% (750) | 2.7% (372) | 3.3% (378) |
| Food and beverage stores | 2.6% (654) | 2.6% (351) | 2.6% (303) |
| Public administration | 2.6% (644) | 2.2% (299) | 3.0% (345) |
| Real estate and rental and leasing | 2.0% (500) | 1.7% (234) | 2.3% (266) |
| Personal and laundry services | 1.9% (474) | 1.2% (159) | 2.8% (315) |
| Department and other general merchandise stores | 1.6% (400) | 1.1% (152) | 2.2% (248) |
| Repair and maintenance | 1.6% (395) | 2.7% (372) | 0.2% (23) |
| Motor vehicle and parts dealers | 1.4% (359) | 2.2% (307) | 0.5% (52) |
| Miscellaneous manufacturing | 1.4% (357) | 1.6% (224) | 1.2% (133) |
| Religious, grantmaking, civic, professional, and similar organizations | 1.4% (350) | 0.9% (130) | 1.9% (220) |
| Truck transportation | 1.4% (348) | 2.3% (320) | 0.2% (28) |
| Broadcasting and telecommunications | 1.3% (334) | 1.3% (177) | 1.4% (157) |
| Building material and garden equipment and supplies dealers | 1.3% (332) | 1.5% (209) | 1.1% (123) |
| Arts, entertainment, and recreation | 1.3% (328) | 1.2% (166) | 1.4% (162) |
| Social assistance | 1.3% (319) | 0.3% (36) | 2.5% (283) |
| Other transportation, and support activities, and couriers | 1.1% (270) | 1.0% (142) | 1.1% (128) |
| Publishing, and motion picture and sound recording industries | 1.0% (252) | 0.9% (130) | 1.1% (122) |
| Machinery, equipment, and supplies merchant wholesalers | 1.0% (248) | 1.0% (139) | 1.0% (109) |
| U. S. Postal service | 1.0% (242) | 1.0% (141) | 0.9% (101) |
| Used merchandise, gift, novelty, and souvenir, and other miscellaneous stores | 1.0% (240) | 1.0% (131) | 1.0% (109) |
| Pharmacies and drug stores | 0.8% (212) | 0.6% (83) | 1.1% (129) |
| Plastics and rubber products | 0.8% (211) | 0.9% (122) | 0.8% (89) |
| Furniture and home furnishings, and household appliance stores | 0.7% (178) | 0.8% (103) | 0.7% (75) |
| Groceries and related products merchant wholesalers | 0.7% (167) | 0.9% (130) | 0.3% (37) |
| Utilities | 0.6% (163) | 0.9% (118) | 0.4% (45) |
| Air transportation | 0.6% (155) | 0.7% (97) | 0.5% (58) |
| Printing and related support activities | 0.6% (147) | 0.7% (101) | 0.4% (46) |
| Computer and electronic products | 0.6% (141) | 0.8% (106) | 0.3% (35) |
| Motor vehicles, parts and supplies merchant wholesalers | 0.5% (137) | 0.8% (107) | 0.3% (30) |
| Other direct selling establishments | 0.5% (131) | 0.3% (47) | 0.7% (84) |
| Radio, TV, and computer stores | 0.5% (130) | 0.5% (65) | 0.6% (65) |
| Chemicals | 0.5% (125) | 0.7% (98) | 0.2% (27) |
| Miscellaneous nondurable goods merchant wholesalers | 0.4% (113) | 0.6% (80) | 0.3% (33) |
| Data processing, libraries, and other information services | 0.4% (113) | 0.4% (61) | 0.5% (52) |
| Retail florists | 0.4% (107) | 0.2% (28) | 0.7% (79) |
| Electrical and electronic goods merchant wholesalers | 0.4% (94) | 0.4% (56) | 0.3% (38) |
| Food | 0.4% (89) | 0.5% (69) | 0.2% (20) |
| Clothing and accessories, including shoe, stores | 0.3% (84) | 0.1% (20) | 0.6% (64) |
| Gasoline stations | 0.3% (81) | 0.3% (44) | 0.3% (37) |
| Nonmetallic mineral products | 0.3% (79) | 0.3% (47) | 0.3% (32) |
| Hardware, plumbing and heating equipment, and supplies merchant wholesalers | 0.3% (73) | 0.5% (73) | 0.0% (0) |
| Office supplies and stationery stores | 0.3% (69) | 0.2% (31) | 0.3% (38) |
| Miscellaneous durable goods merchant wholesalers | 0.3% (68) | 0.2% (24) | 0.4% (44) |
| Lumber and other construction materials merchant wholesalers | 0.2% (59) | 0.3% (46) | 0.1% (13) |
| Health and personal care, except drug, stores | 0.2% (57) | 0.1% (12) | 0.4% (45) |
| Book stores and news dealers | 0.2% (57) | 0.2% (23) | 0.3% (34) |
| Private households | 0.2% (53) | 0.0% (3) | 0.4% (50) |
| Sporting goods, camera, and hobby and toy stores | 0.2% (47) | 0.2% (26) | 0.2% (21) |
| Paper | 0.2% (45) | 0.3% (40) | 0.0% (5) |
| Warehousing and storage | 0.2% (40) | 0.2% (34) | 0.1% (6) |
| Furniture and home furnishing merchant wholesalers | 0.2% (38) | 0.3% (38) | 0.0% (0) |
| Furniture and related product manufacturing | 0.1% (35) | 0.3% (35) | 0.0% (0) |
| Drugs, sundries, and chemical and allied products merchant wholesalers | 0.1% (34) | 0.0% (0) | 0.3% (34) |
| Petroleum and petroleum products merchant wholesalers | 0.1% (34) | 0.1% (12) | 0.2% (22) |
| Jewelry, luggage, and leather goods stores | 0.1% (33) | 0.0% (4) | 0.3% (29) |
| Rail transportation | 0.1% (33) | 0.2% (33) | 0.0% (0) |
| Music stores | 0.1% (33) | 0.2% (28) | 0.0% (5) |
| Electrical equipment, appliances, and components | 0.1% (32) | 0.2% (32) | 0.0% (0) |
| Paper and paper products merchant wholesalers | 0.1% (32) | 0.2% (23) | 0.1% (9) |
| Professional and commercial equipment and supplies merchant wholesalers | 0.1% (31) | 0.1% (14) | 0.1% (17) |
| Alcoholic beverages merchant wholesalers | 0.1% (31) | 0.2% (31) | 0.0% (0) |
| Textile mills and textile products | 0.1% (20) | 0.1% (20) | 0.0% (0) |
| Mining, quarrying, and oil and gas extraction | 0.1% (20) | 0.1% (20) | 0.0% (0) |
Unemployment in Redford
- Unemployment by race in 2000
- Unemployment rate for White non-Hispanic residents
- 4.2%Males
- 2.5%Females
- Unemployment rate for Black residents
- 3.8%Males
- 8.5%Females
- Unemployment rate for Asian residents
- 8.1%Males
- Unemployment rate for other race residents
- 8.0%Males
- 7.3%Females
- Unemployment rate for two or more race residents
- 4.4%Males
- 3.8%Females
- Unemployment rate for Hispanic or Latino residents
- 9.6%Males
- 8.2%Females
Time leaving home to go to work

<5am:
| Redford: | 3.5% (873) |
| Michigan: | 3.4% (156,327) |
5:30am:
| Redford: | 3.0% (734) |
| Michigan: | 3.1% (139,699) |
6am:
| Redford: | 4.8% (1,177) |
| Michigan: | 4.7% (211,446) |
6:30am:
| Redford: | 6.9% (1,697) |
| Michigan: | 7.7% (349,878) |
7am:
| Redford: | 11.2% (2,761) |
| Michigan: | 9.8% (446,636) |
7:30am:
| Redford: | 12.3% (3,036) |
| Michigan: | 13.2% (597,402) |
8am:
| Redford: | 15.4% (3,815) |
| Michigan: | 15.3% (692,901) |
8:30am:
| Redford: | 11.3% (2,794) |
| Michigan: | 9.9% (448,050) |
9am:
| Redford: | 6.7% (1,653) |
| Michigan: | 5.2% (235,689) |
10am:
| Redford: | 5.4% (1,326) |
| Michigan: | 5.1% (233,210) |
11am:
| Redford: | 2.7% (670) |
| Michigan: | 2.2% (98,395) |
12pm:
| Redford: | 1.0% (241) |
| Michigan: | 1.1% (50,205) |
4pm:
| Redford: | 7.6% (1,875) |
| Michigan: | 8.6% (391,612) |
>4pm:
| Redford: | 7.1% (1,755) |
| Michigan: | 8.0% (361,157) |
Travel time to work
Daytime population change due to commuting: -9,330 (-18.1%)
Workers who live and work in this place: 2,700 (10.9%)
Workers who live and work in this place: 2,700 (10.9%)


Less than 5 minutes:
| Redford: | 1.5% (360) |
| Michigan: | 3.5% (158,315) |
5 to 9 minutes:
| Redford: | 7.2% (1,767) |
| Michigan: | 11.2% (507,653) |
10 to 14 minutes:
| Redford: | 13.0% (3,207) |
| Michigan: | 15.0% (681,990) |
15 to 19 minutes:
| Redford: | 17.4% (4,294) |
| Michigan: | 15.6% (708,036) |
20 to 24 minutes:
| Redford: | 19.4% (4,791) |
| Michigan: | 14.9% (675,865) |
25 to 29 minutes:
| Redford: | 8.8% (2,185) |
| Michigan: | 6.4% (291,938) |
30 to 34 minutes:
| Redford: | 16.3% (4,030) |
| Michigan: | 12.0% (546,870) |
35 to 39 minutes:
| Redford: | 3.3% (817) |
| Michigan: | 2.8% (126,158) |
40 to 44 minutes:
| Redford: | 3.3% (809) |
| Michigan: | 3.3% (147,930) |
45 to 59 minutes:
| Redford: | 4.8% (1,182) |
| Michigan: | 6.7% (304,785) |
60 to 89 minutes:
| Redford: | 2.3% (558) |
| Michigan: | 3.8% (171,403) |
90 or more minutes:
| Redford: | 1.6% (407) |
| Michigan: | 2.0% (91,664) |
Means of transportation to work

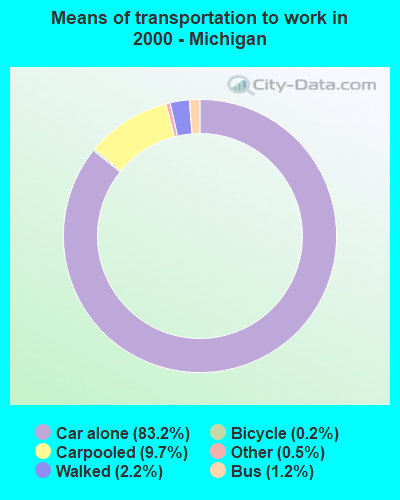
Drove car alone:
| Redford: | 88.4% (21,820) |
| Michigan: | 83.2% (3,776,535) |
Carpooled:
| Redford: | 8.4% (2,082) |
| Michigan: | 9.7% (440,606) |
Bus or trolley bus:
| Redford: | 0.6% (138) |
| Michigan: | 1.2% (54,423) |
Motorcycle:
| Redford: | 0.1% (17) |
| Michigan: | 0.0% (1,698) |
Bicycle:
| Redford: | 0.1% (17) |
| Michigan: | 0.2% (10,034) |
Walked:
| Redford: | 1.1% (275) |
| Michigan: | 2.2% (101,506) |
Other means:
| Redford: | 0.2% (58) |
| Michigan: | 0.5% (21,691) |
Private vehicle occupancy

Drove alone:
| Redford: | 91.3% (21,820) |
| Michigan: | 89.6% (3,776,535) |
In 2 person carpool:
| Redford: | 7.9% (1,895) |
| Michigan: | 8.5% (358,473) |
In 3 person carpool:
| Redford: | 0.5% (122) |
| Michigan: | 1.3% (53,301) |
In 4 person carpool:
| Redford: | 0.1% (16) |
| Michigan: | 0.4% (16,740) |
In 5-6 person carpool:
| Redford: | 0.1% (34) |
| Michigan: | 0.2% (8,051) |
In 7+ person carpool:
| Redford: | 0.1% (15) |
| Michigan: | 0.1% (4,041) |
Class of workers
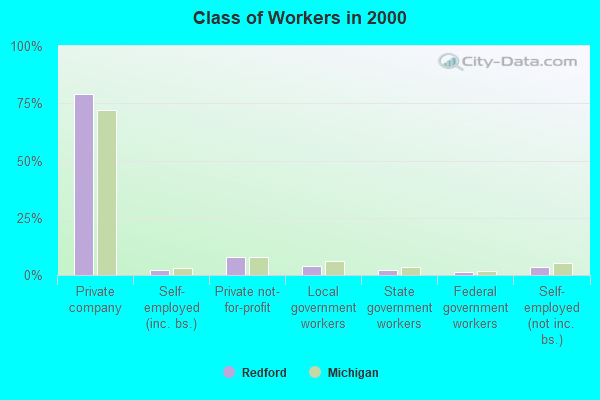
Employee of private company:
| Redford: | 79.2% (19,918) |
| Michigan: | 71.9% (3,336,174) |
Self-employed in own incorporated business:
| Redford: | 2.0% (513) |
| Michigan: | 3.1% (145,931) |
Private not-for-profit wage and salary workers:
| Redford: | 7.8% (1,953) |
| Michigan: | 8.0% (370,593) |
Local government workers:
| Redford: | 4.0% (999) |
| Michigan: | 6.2% (285,684) |
State government workers:
| Redford: | 2.0% (511) |
| Michigan: | 3.7% (170,984) |
Federal government workers:
| Redford: | 1.5% (380) |
| Michigan: | 1.5% (71,533) |
Self-employed workers in own not incorporated business:
| Redford: | 3.4% (867) |
| Michigan: | 5.2% (243,300) |
Unpaid family workers:
| Redford: | 0.1% (20) |
| Michigan: | 0.3% (13,262) |

Employee of private company - Males:
| Redford: | 82.4% (11,296) |
| Michigan: | 75.9% (1,867,177) |
Self-employed in own incorporated business - Males:
| Redford: | 3.1% (430) |
| Michigan: | 4.4% (108,798) |
Private not-for-profit wage and salary workers - Males:
| Redford: | 4.1% (565) |
| Michigan: | 4.5% (110,148) |
Local government workers - Males:
| Redford: | 3.1% (431) |
| Michigan: | 4.7% (115,439) |
State government workers - Males:
| Redford: | 1.8% (244) |
| Michigan: | 3.0% (73,106) |
Federal government workers - Males:
| Redford: | 1.5% (199) |
| Michigan: | 1.4% (34,122) |
Self-employed workers in own not incorporated business - Males:
| Redford: | 3.9% (532) |
| Michigan: | 5.9% (144,398) |
Unpaid family workers - Males:
| Redford: | 0.1% (13) |
| Michigan: | 0.3% (6,159) |

Employee of private company - Females:
| Redford: | 75.3% (8,622) |
| Michigan: | 67.4% (1,468,997) |
Self-employed in own incorporated business - Females:
| Redford: | 0.7% (83) |
| Michigan: | 1.7% (37,133) |
Private not-for-profit wage and salary workers - Females:
| Redford: | 12.1% (1,388) |
| Michigan: | 12.0% (260,445) |
Local government workers - Females:
| Redford: | 5.0% (568) |
| Michigan: | 7.8% (170,245) |
State government workers - Females:
| Redford: | 2.3% (267) |
| Michigan: | 4.5% (97,878) |
Federal government workers - Females:
| Redford: | 1.6% (181) |
| Michigan: | 1.7% (37,411) |
Self-employed workers in own not incorporated business - Females:
| Redford: | 2.9% (335) |
| Michigan: | 4.5% (98,902) |
Unpaid family workers - Females:
| Redford: | 0.1% (7) |
| Michigan: | 0.3% (7,103) |