Work and Jobs in Renningers, Pennsylvania (PA) Detailed Stats
Occupations, Industries, Unemployment, Workers, Commute
Settings
X


Recent posts about work in Renningers, Pennsylvania on our local forum with over 2,400,000 registered users:
 | New faculty at Kutztown University - finding a place to live (47 replies) |
| Living in the Hamburg, PA? (12 replies) |
| Great country drives (2 replies) |
Latest news about work in Renningers, PA collected exclusively by city-data.com from local newspapers, TV, and radio stations
The most common industries in Renningers are: Educational services (18.0% of civilian employees), Health care (12.6% of civilian employees), Accommodation & food services (12.6% of civilian employees). 41.5% of workers work in Schuylkill County. 68.1% of workers are employees of private companies, which is about the same as the rate of 67.7% across the entire state of Pennsylvania.
Whole page based on the data from 2000 / 2022 when the population of Renningers, Pennsylvania was 380 / 551
Whole page based on the data from 2000 / 2022 when the population of Renningers, Pennsylvania was 380 / 551
Most common industries
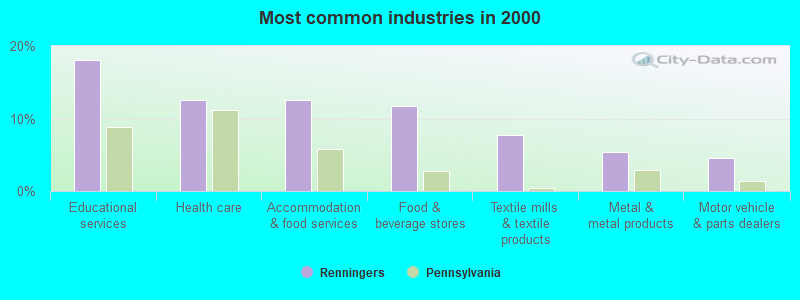
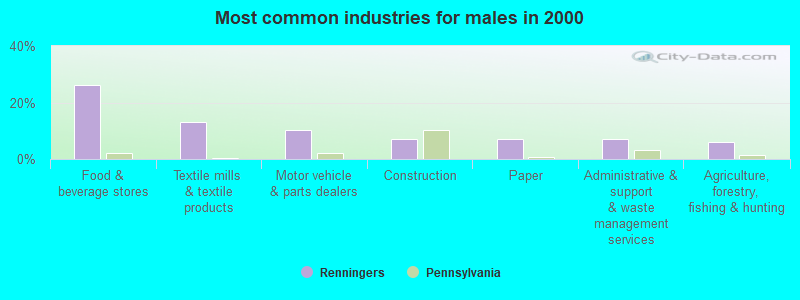
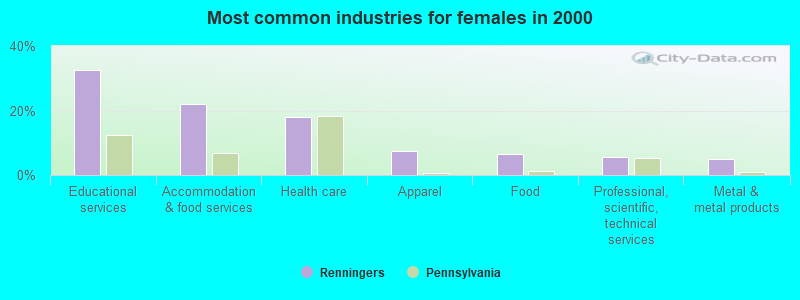
Most common industries | |||
|---|---|---|---|
Industry | All | Males | Females |
| Educational services | 18.0% (40) | 0.0% (0) | 32.5% (40) |
| Health care | 12.6% (28) | 6.1% (6) | 17.9% (22) |
| Accommodation and food services | 12.6% (28) | 1.0% (1) | 22.0% (27) |
| Food and beverage stores | 11.7% (26) | 26.3% (26) | 0.0% (0) |
| Textile mills and textile products | 7.7% (17) | 13.1% (13) | 3.3% (4) |
| Metal and metal products | 5.4% (12) | 6.1% (6) | 4.9% (6) |
| Motor vehicle and parts dealers | 4.5% (10) | 10.1% (10) | 0.0% (0) |
| Apparel | 4.1% (9) | 0.0% (0) | 7.3% (9) |
| Food | 3.6% (8) | 0.0% (0) | 6.5% (8) |
| Paper | 3.2% (7) | 7.1% (7) | 0.0% (0) |
| Construction | 3.2% (7) | 7.1% (7) | 0.0% (0) |
| Professional, scientific, and technical services | 3.2% (7) | 0.0% (0) | 5.7% (7) |
| Administrative and support and waste management services | 3.2% (7) | 7.1% (7) | 0.0% (0) |
| Agriculture, forestry, fishing and hunting | 2.7% (6) | 6.1% (6) | 0.0% (0) |
| Nonmetallic mineral products | 2.7% (6) | 6.1% (6) | 0.0% (0) |
| Repair and maintenance | 1.8% (4) | 4.0% (4) | 0.0% (0) |
Unemployment in Renningers
- Unemployment by race in 2000
- Unemployment rate for White non-Hispanic residents
- 20.2%Males
- 16.3%Females
Time leaving home to go to work
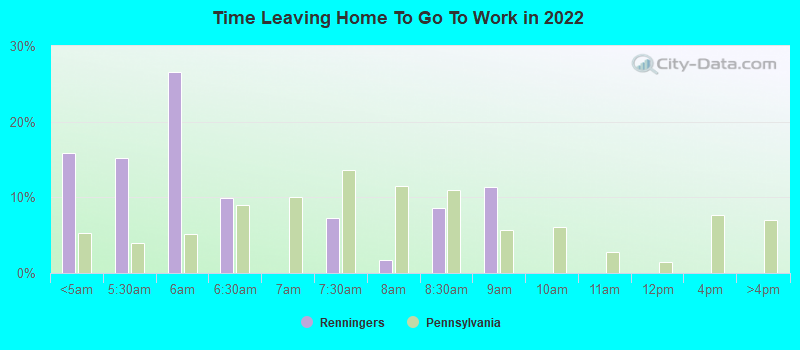
12:00 a.m. to 4:59 a.m.:
| Renningers: | 15.8% (39) |
| Pennsylvania: | 5.2% (278,903) |
5:00 a.m. to 5:29 a.m.:
| Renningers: | 15.2% (38) |
| Pennsylvania: | 3.9% (210,362) |
5:30 a.m. to 5:59 a.m.:
| Renningers: | 26.6% (66) |
| Pennsylvania: | 5.1% (274,242) |
6:00 a.m. to 6:29 a.m.:
| Renningers: | 9.9% (25) |
| Pennsylvania: | 9.0% (480,402) |
7:00 a.m. to 7:29 a.m.:
| Renningers: | 7.2% (18) |
| Pennsylvania: | 13.6% (726,980) |
7:30 a.m. to 7:59 a.m.:
| Renningers: | 1.8% (4) |
| Pennsylvania: | 11.5% (611,627) |
8:00 a.m. to 8:29 a.m.:
| Renningers: | 8.7% (22) |
| Pennsylvania: | 11.0% (585,665) |
8:30 a.m. to 8:59 a.m.:
| Renningers: | 11.4% (28) |
| Pennsylvania: | 5.7% (302,857) |

<5am:
| Renningers: | 14.9% (29) |
| Pennsylvania: | 3.1% (172,304) |
6:30am:
| Renningers: | 11.9% (23) |
| Pennsylvania: | 8.6% (478,636) |
7am:
| Renningers: | 16.0% (31) |
| Pennsylvania: | 10.8% (599,808) |
7:30am:
| Renningers: | 17.5% (34) |
| Pennsylvania: | 13.7% (759,372) |
8:30am:
| Renningers: | 3.1% (6) |
| Pennsylvania: | 10.6% (588,440) |
9am:
| Renningers: | 3.1% (6) |
| Pennsylvania: | 5.5% (304,765) |
11am:
| Renningers: | 3.6% (7) |
| Pennsylvania: | 2.1% (114,676) |
4pm:
| Renningers: | 22.2% (43) |
| Pennsylvania: | 7.3% (404,775) |
>4pm:
| Renningers: | 7.7% (15) |
| Pennsylvania: | 7.3% (408,070) |

12:00 a.m. to 4:59 a.m. - Males:
| Renningers: | 10.7% (15) |
| Pennsylvania: | 7.2% (203,028) |
5:00 a.m. to 5:29 a.m. - Males:
| Renningers: | 23.8% (34) |
| Pennsylvania: | 5.6% (157,829) |
5:30 a.m. to 5:59 a.m. - Males:
| Renningers: | 53.8% (77) |
| Pennsylvania: | 6.4% (180,791) |
6:00 a.m. to 6:29 a.m. - Males:
| Renningers: | 14.2% (20) |
| Pennsylvania: | 10.5% (296,669) |

12:00 a.m. to 4:59 a.m. - Females:
| Renningers: | 21.2% (22) |
| Pennsylvania: | 3.0% (75,875) |
7:00 a.m. to 7:29 a.m. - Females:
| Renningers: | 17.3% (18) |
| Pennsylvania: | 14.8% (370,723) |
7:30 a.m. to 7:59 a.m. - Females:
| Renningers: | 4.3% (5) |
| Pennsylvania: | 13.7% (342,732) |
8:00 a.m. to 8:29 a.m. - Females:
| Renningers: | 20.5% (22) |
| Pennsylvania: | 12.4% (310,699) |
8:30 a.m. to 8:59 a.m. - Females:
| Renningers: | 31.2% (33) |
| Pennsylvania: | 6.6% (165,487) |
Travel time to work
Percentage of workers working in this county: 41.5%


Less than 5 minutes:
| Renningers: | 2.6% (5) |
| Pennsylvania: | 3.5% (196,492) |
5 to 9 minutes:
| Renningers: | 13.9% (27) |
| Pennsylvania: | 11.1% (615,919) |
10 to 14 minutes:
| Renningers: | 19.1% (37) |
| Pennsylvania: | 14.9% (825,199) |
15 to 19 minutes:
| Renningers: | 22.2% (43) |
| Pennsylvania: | 15.0% (836,006) |
20 to 24 minutes:
| Renningers: | 5.2% (10) |
| Pennsylvania: | 14.1% (782,790) |
30 to 34 minutes:
| Renningers: | 27.3% (53) |
| Pennsylvania: | 11.8% (655,811) |
35 to 39 minutes:
| Renningers: | 2.6% (5) |
| Pennsylvania: | 2.7% (148,906) |
45 to 59 minutes:
| Renningers: | 7.2% (14) |
| Pennsylvania: | 7.3% (407,516) |
Means of transportation to work


Drove car alone:
| Renningers: | 84.0% (163) |
| Pennsylvania: | 76.5% (4,247,836) |
Carpooled:
| Renningers: | 16.0% (31) |
| Pennsylvania: | 10.4% (577,364) |
Private vehicle occupancy

Drove alone:
| Renningers: | 100.0% (243) |
| Pennsylvania: | 90.2% (4,322,003) |

Drove alone:
| Renningers: | 84.0% (163) |
| Pennsylvania: | 88.0% (4,247,836) |
In 2 person carpool:
| Renningers: | 12.9% (25) |
| Pennsylvania: | 9.7% (470,174) |
In 5-6 person carpool:
| Renningers: | 3.1% (6) |
| Pennsylvania: | 0.2% (9,833) |
Class of workers
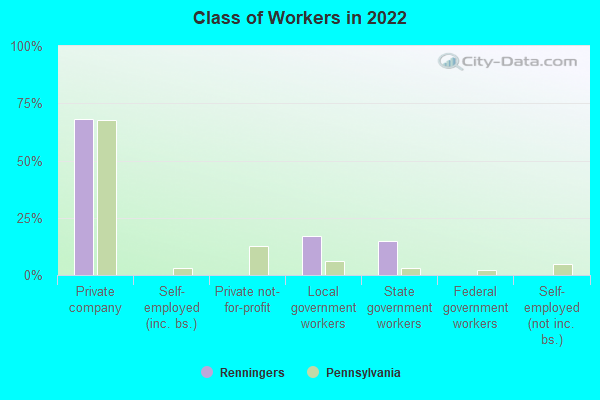
Employee of private company:
| Renningers: | 68.1% (170) |
| Pennsylvania: | 67.7% (4,333,849) |
Local government workers:
| Renningers: | 16.9% (42) |
| Pennsylvania: | 6.2% (397,120) |
State government workers:
| Renningers: | 14.9% (37) |
| Pennsylvania: | 3.0% (193,490) |

Employee of private company:
| Renningers: | 74.3% (165) |
| Pennsylvania: | 69.7% (3,942,119) |
Self-employed in own incorporated business:
| Renningers: | 3.2% (7) |
| Pennsylvania: | 2.4% (134,871) |
Private not-for-profit wage and salary workers:
| Renningers: | 18.0% (40) |
| Pennsylvania: | 10.3% (580,382) |
Self-employed workers in own not incorporated business:
| Renningers: | 2.7% (6) |
| Pennsylvania: | 6.0% (339,631) |
Unpaid family workers:
| Renningers: | 1.8% (4) |
| Pennsylvania: | 0.3% (17,409) |

Employee of private company - Males:
| Renningers: | 61.3% (88) |
| Pennsylvania: | 71.5% (2,388,579) |
Local government workers - Males:
| Renningers: | 12.7% (18) |
| Pennsylvania: | 5.0% (168,310) |
State government workers - Males:
| Renningers: | 26.1% (37) |
| Pennsylvania: | 2.9% (97,540) |

Employee of private company - Females:
| Renningers: | 77.4% (83) |
| Pennsylvania: | 63.5% (1,945,270) |
Local government workers - Females:
| Renningers: | 22.6% (24) |
| Pennsylvania: | 7.5% (228,810) |