Work and Jobs in Ross Valley, California (CA) Detailed Stats
Occupations, Industries, Unemployment, Workers, Commute
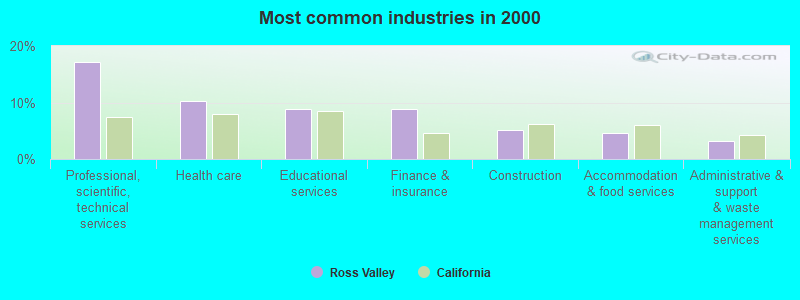
The most common industries in Ross Valley are: Professional, scientific, technical services (17.1% of civilian employees), Health care (10.2% of civilian employees), Educational services (8.9% of civilian employees). 55.7% of workers are employees of private companies, which is 22.0% less than the rate of 68.0% across the entire state of California.
Most common industries
Most common industries | |||
|---|---|---|---|
Industry | All | Males | Females |
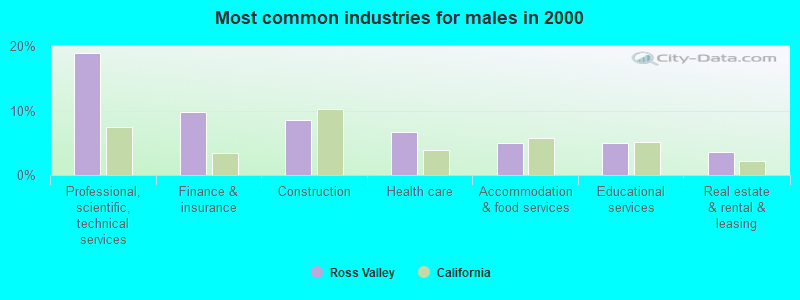
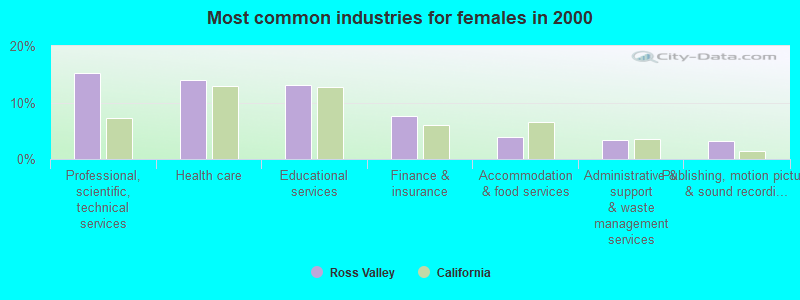
| Professional, scientific, and technical services | 17.1% (4,949) | 18.9% (2,838) | 15.2% (2,111) |
| Health care | 10.2% (2,944) | 6.7% (1,006) | 13.9% (1,938) |
| Educational services | 8.9% (2,582) | 5.0% (751) | 13.2% (1,831) |
| Finance and insurance | 8.8% (2,534) | 9.8% (1,472) | 7.6% (1,062) |
| Construction | 5.0% (1,459) | 8.6% (1,291) | 1.2% (168) |
| Accommodation and food services | 4.5% (1,307) | 5.0% (755) | 4.0% (552) |
| Administrative and support and waste management services | 3.3% (945) | 3.2% (473) | 3.4% (472) |
| Arts, entertainment, and recreation | 3.1% (896) | 3.0% (453) | 3.2% (443) |
| Real estate and rental and leasing | 3.0% (878) | 3.5% (530) | 2.5% (348) |
| Publishing, and motion picture and sound recording industries | 2.8% (819) | 2.5% (375) | 3.2% (444) |
| Public administration | 2.7% (772) | 3.2% (480) | 2.1% (292) |
| Social assistance | 1.9% (554) | 0.8% (121) | 3.1% (433) |
| Religious, grantmaking, civic, professional, and similar organizations | 1.8% (518) | 1.4% (217) | 2.2% (301) |
| Broadcasting and telecommunications | 1.6% (472) | 1.8% (274) | 1.4% (198) |
| Personal and laundry services | 1.6% (454) | 0.7% (98) | 2.6% (356) |
| Data processing, libraries, and other information services | 1.5% (434) | 1.5% (225) | 1.5% (209) |
| Food and beverage stores | 1.4% (412) | 1.9% (288) | 0.9% (124) |
| Radio, TV, and computer stores | 1.3% (369) | 1.9% (292) | 0.6% (77) |
| Used merchandise, gift, novelty, and souvenir, and other miscellaneous stores | 1.2% (350) | 0.7% (106) | 1.8% (244) |
| Computer and electronic products | 1.0% (303) | 1.4% (216) | 0.6% (87) |
| Repair and maintenance | 1.0% (284) | 1.5% (227) | 0.4% (57) |
| Furniture and home furnishings, and household appliance stores | 0.9% (251) | 0.8% (125) | 0.9% (126) |
| Electronic shopping and mail-order houses | 0.8% (243) | 0.8% (113) | 0.9% (130) |
| Other transportation, and support activities, and couriers | 0.8% (217) | 0.9% (142) | 0.5% (75) |
| Clothing and accessories, including shoe, stores | 0.7% (212) | 0.5% (71) | 1.0% (141) |
| Miscellaneous manufacturing | 0.7% (211) | 1.1% (161) | 0.4% (50) |
| Other direct selling establishments | 0.7% (208) | 0.4% (58) | 1.1% (150) |
| Building material and garden equipment and supplies dealers | 0.7% (207) | 1.0% (152) | 0.4% (55) |
| Air transportation | 0.7% (201) | 0.6% (83) | 0.8% (118) |
| Department and other general merchandise stores | 0.7% (200) | 0.1% (17) | 1.3% (183) |
| Private households | 0.7% (196) | 0.1% (12) | 1.3% (184) |
| Motor vehicle and parts dealers | 0.5% (154) | 0.9% (139) | 0.1% (15) |
| Sporting goods, camera, and hobby and toy stores | 0.5% (152) | 0.5% (73) | 0.6% (79) |
| Food | 0.4% (127) | 0.5% (75) | 0.4% (52) |
| Groceries and related products merchant wholesalers | 0.4% (116) | 0.3% (42) | 0.5% (74) |
| Apparel | 0.4% (113) | 0.3% (48) | 0.5% (65) |
| Miscellaneous nondurable goods merchant wholesalers | 0.4% (111) | 0.5% (68) | 0.3% (43) |
| Printing and related support activities | 0.3% (95) | 0.5% (76) | 0.1% (19) |
| Professional and commercial equipment and supplies merchant wholesalers | 0.3% (90) | 0.3% (48) | 0.3% (42) |
| Furniture and related product manufacturing | 0.3% (80) | 0.5% (72) | 0.1% (8) |
| Drugs, sundries, and chemical and allied products merchant wholesalers | 0.3% (78) | 0.3% (51) | 0.2% (27) |
| Chemicals | 0.3% (78) | 0.2% (31) | 0.3% (47) |
| Agriculture, forestry, fishing and hunting | 0.3% (75) | 0.5% (75) | 0.0% (0) |
| U. S. Postal service | 0.2% (71) | 0.3% (46) | 0.2% (25) |
| Jewelry, luggage, and leather goods stores | 0.2% (68) | 0.0% (6) | 0.4% (62) |
| Book stores and news dealers | 0.2% (63) | 0.1% (16) | 0.3% (47) |
| Plastics and rubber products | 0.2% (63) | 0.3% (52) | 0.1% (11) |
| Miscellaneous durable goods merchant wholesalers | 0.2% (62) | 0.3% (40) | 0.2% (22) |
| Machinery, equipment, and supplies merchant wholesalers | 0.2% (54) | 0.3% (43) | 0.1% (11) |
| Utilities | 0.2% (54) | 0.1% (21) | 0.2% (33) |
| Apparel, fabrics, and notions merchant wholesalers | 0.2% (52) | 0.2% (35) | 0.1% (17) |
| Pharmacies and drug stores | 0.2% (51) | 0.1% (14) | 0.3% (37) |
| Office supplies and stationery stores | 0.2% (47) | 0.1% (14) | 0.2% (33) |
| Textile mills and textile products | 0.2% (47) | 0.3% (40) | 0.1% (7) |
| Alcoholic beverages merchant wholesalers | 0.2% (45) | 0.2% (32) | 0.1% (13) |
| Water transportation | 0.1% (42) | 0.2% (36) | 0.0% (6) |
| Electrical and electronic goods merchant wholesalers | 0.1% (42) | 0.2% (37) | 0.0% (5) |
| Machinery | 0.1% (36) | 0.2% (31) | 0.0% (5) |
| Transportation equipment | 0.1% (35) | 0.2% (35) | 0.0% (0) |
| Warehousing and storage | 0.1% (33) | 0.2% (24) | 0.1% (9) |
| Health and personal care, except drug, stores | 0.1% (32) | 0.1% (13) | 0.1% (19) |
| Nonmetallic mineral products | 0.1% (31) | 0.2% (31) | 0.0% (0) |
| Motor vehicles, parts and supplies merchant wholesalers | 0.1% (29) | 0.2% (29) | 0.0% (0) |
| Electrical equipment, appliances, and components | 0.1% (29) | 0.2% (29) | 0.0% (0) |
| Metal and metal products | 0.1% (25) | 0.2% (25) | 0.0% (0) |
| Truck transportation | 0.1% (24) | 0.2% (24) | 0.0% (0) |
| Beverage and tobacco products | 0.1% (23) | 0.1% (18) | 0.0% (5) |
| Paper | 0.1% (21) | 0.1% (21) | 0.0% (0) |
| Gasoline stations | 0.1% (20) | 0.1% (20) | 0.0% (0) |
Unemployment in Ross Valley
- Unemployment by race in 2000
- Unemployment rate for White non-Hispanic residents
- 3.3%Males
- 2.4%Females
- Unemployment rate for Black residents
- 9.5%Males
- Unemployment rate for American Indian and Alaska Native residents
- 15.7%Males
- Unemployment rate for Asian residents
- 3.4%Males
- 4.6%Females
- Unemployment rate for other race residents
- 5.6%Females
- Unemployment rate for two or more race residents
- 3.5%Males
- 2.1%Females
- Unemployment rate for Hispanic or Latino residents
- 2.8%Males
- 2.6%Females
Time leaving home to go to work

<5am:
| Ross Valley: | 1.5% (415) |
| California: | 4.2% (606,086) |
5:30am:
| Ross Valley: | 1.2% (353) |
| California: | 3.6% (523,209) |
6am:
| Ross Valley: | 2.1% (590) |
| California: | 4.8% (692,256) |
6:30am:
| Ross Valley: | 5.4% (1,546) |
| California: | 8.4% (1,216,867) |
7am:
| Ross Valley: | 8.3% (2,368) |
| California: | 9.4% (1,362,830) |
7:30am:
| Ross Valley: | 13.4% (3,801) |
| California: | 13.8% (2,006,950) |
8am:
| Ross Valley: | 14.3% (4,056) |
| California: | 13.7% (1,986,831) |
8:30am:
| Ross Valley: | 15.5% (4,410) |
| California: | 10.9% (1,577,815) |
9am:
| Ross Valley: | 8.4% (2,387) |
| California: | 5.4% (778,152) |
10am:
| Ross Valley: | 8.9% (2,525) |
| California: | 6.7% (972,355) |
11am:
| Ross Valley: | 4.2% (1,203) |
| California: | 2.9% (414,479) |
12pm:
| Ross Valley: | 1.2% (352) |
| California: | 1.3% (189,005) |
4pm:
| Ross Valley: | 3.2% (902) |
| California: | 6.0% (865,284) |
>4pm:
| Ross Valley: | 2.7% (775) |
| California: | 5.3% (776,167) |
Travel time to work


Less than 5 minutes:
| Ross Valley: | 2.0% (558) |
| California: | 2.2% (324,703) |
5 to 9 minutes:
| Ross Valley: | 8.2% (2,342) |
| California: | 8.8% (1,280,443) |
10 to 14 minutes:
| Ross Valley: | 11.1% (3,158) |
| California: | 13.3% (1,930,263) |
15 to 19 minutes:
| Ross Valley: | 11.4% (3,254) |
| California: | 14.9% (2,157,970) |
20 to 24 minutes:
| Ross Valley: | 10.0% (2,849) |
| California: | 13.8% (2,004,060) |
25 to 29 minutes:
| Ross Valley: | 4.2% (1,201) |
| California: | 5.4% (782,241) |
30 to 34 minutes:
| Ross Valley: | 9.1% (2,594) |
| California: | 13.9% (2,025,657) |
35 to 39 minutes:
| Ross Valley: | 3.0% (860) |
| California: | 2.5% (366,487) |
40 to 44 minutes:
| Ross Valley: | 3.9% (1,123) |
| California: | 3.6% (528,043) |
45 to 59 minutes:
| Ross Valley: | 12.3% (3,501) |
| California: | 7.9% (1,151,598) |
60 to 89 minutes:
| Ross Valley: | 11.5% (3,280) |
| California: | 6.4% (933,123) |
90 or more minutes:
| Ross Valley: | 3.4% (963) |
| California: | 3.3% (483,698) |
Means of transportation to work


Drove car alone:
| Ross Valley: | 65.9% (18,768) |
| California: | 71.8% (10,432,462) |
Carpooled:
| Ross Valley: | 8.9% (2,546) |
| California: | 14.5% (2,113,313) |
Bus or trolley bus:
| Ross Valley: | 6.1% (1,747) |
| California: | 3.8% (549,425) |
Subway or elevated:
| Ross Valley: | 0.1% (15) |
| California: | 0.7% (107,711) |
Ferryboat:
| Ross Valley: | 4.0% (1,133) |
| California: | 0.0% (6,831) |
Motorcycle:
| Ross Valley: | 0.2% (48) |
| California: | 0.2% (36,262) |
Bicycle:
| Ross Valley: | 1.5% (421) |
| California: | 0.8% (120,567) |
Walked:
| Ross Valley: | 3.1% (882) |
| California: | 2.9% (414,581) |
Other means:
| Ross Valley: | 0.4% (123) |
| California: | 0.8% (115,064) |
Private vehicle occupancy

Drove alone:
| Ross Valley: | 88.1% (18,768) |
| California: | 83.2% (10,432,462) |
In 2 person carpool:
| Ross Valley: | 9.7% (2,057) |
| California: | 12.5% (1,564,905) |
In 3 person carpool:
| Ross Valley: | 1.6% (346) |
| California: | 2.6% (330,732) |
In 4 person carpool:
| Ross Valley: | 0.5% (100) |
| California: | 1.0% (119,364) |
In 5-6 person carpool:
| Ross Valley: | 0.1% (28) |
| California: | 0.5% (57,036) |
In 7+ person carpool:
| Ross Valley: | 0.1% (15) |
| California: | 0.3% (41,276) |
Class of workers

Employee of private company:
| Ross Valley: | 55.7% (16,110) |
| California: | 68.0% (10,009,465) |
Self-employed in own incorporated business:
| Ross Valley: | 4.9% (1,422) |
| California: | 2.7% (402,392) |
Private not-for-profit wage and salary workers:
| Ross Valley: | 9.4% (2,716) |
| California: | 5.7% (845,536) |
Local government workers:
| Ross Valley: | 5.6% (1,622) |
| California: | 8.3% (1,218,764) |
State government workers:
| Ross Valley: | 3.1% (887) |
| California: | 4.0% (594,953) |
Federal government workers:
| Ross Valley: | 1.1% (308) |
| California: | 2.3% (344,354) |
Self-employed workers in own not incorporated business:
| Ross Valley: | 19.9% (5,752) |
| California: | 8.5% (1,249,530) |
Unpaid family workers:
| Ross Valley: | 0.3% (95) |
| California: | 0.4% (53,934) |

Employee of private company - Males:
| Ross Valley: | 56.8% (8,531) |
| California: | 71.1% (5,716,697) |
Self-employed in own incorporated business - Males:
| Ross Valley: | 6.9% (1,042) |
| California: | 3.6% (290,657) |
Private not-for-profit wage and salary workers - Males:
| Ross Valley: | 6.0% (895) |
| California: | 3.8% (303,997) |
Local government workers - Males:
| Ross Valley: | 3.9% (591) |
| California: | 6.2% (495,927) |
State government workers - Males:
| Ross Valley: | 2.9% (439) |
| California: | 3.2% (255,434) |
Federal government workers - Males:
| Ross Valley: | 1.2% (182) |
| California: | 2.5% (198,555) |
Self-employed workers in own not incorporated business - Males:
| Ross Valley: | 22.0% (3,306) |
| California: | 9.5% (760,853) |
Unpaid family workers - Males:
| Ross Valley: | 0.2% (27) |
| California: | 0.3% (23,230) |

Employee of private company - Females:
| Ross Valley: | 54.5% (7,579) |
| California: | 64.3% (4,292,768) |
Self-employed in own incorporated business - Females:
| Ross Valley: | 2.7% (380) |
| California: | 1.7% (111,735) |
Private not-for-profit wage and salary workers - Females:
| Ross Valley: | 13.1% (1,821) |
| California: | 8.1% (541,539) |
Local government workers - Females:
| Ross Valley: | 7.4% (1,031) |
| California: | 10.8% (722,837) |
State government workers - Females:
| Ross Valley: | 3.2% (448) |
| California: | 5.1% (339,519) |
Federal government workers - Females:
| Ross Valley: | 0.9% (126) |
| California: | 2.2% (145,799) |
Self-employed workers in own not incorporated business - Females:
| Ross Valley: | 17.6% (2,446) |
| California: | 7.3% (488,677) |
Unpaid family workers - Females:
| Ross Valley: | 0.5% (68) |
| California: | 0.5% (30,704) |