Work and Jobs in Russian River-Coastal, California (CA) Detailed Stats
Occupations, Industries, Unemployment, Workers, Commute
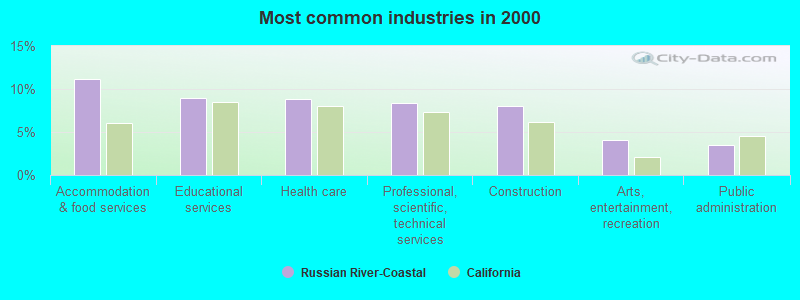
The most common industries in Russian River-Coastal are: Accommodation & food services (11.1% of civilian employees), Educational services (9.0% of civilian employees), Health care (8.8% of civilian employees). 53.0% of workers are employees of private companies, which is 28.4% less than the rate of 68.0% across the entire state of California.
Most common industries
Most common industries | |||
|---|---|---|---|
Industry | All | Males | Females |
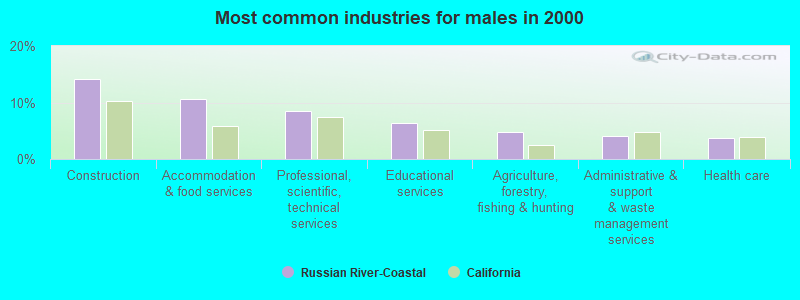
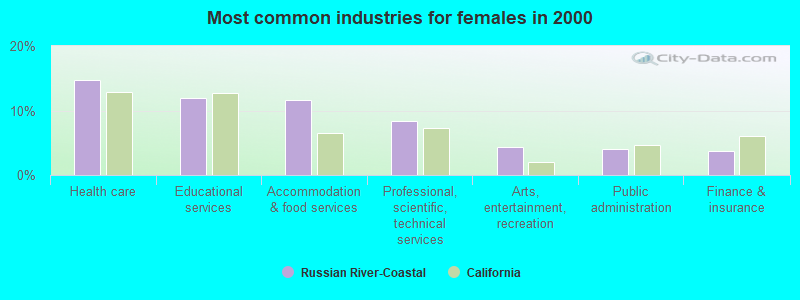
| Accommodation and food services | 11.1% (1,403) | 10.7% (727) | 11.7% (676) |
| Educational services | 9.0% (1,129) | 6.4% (433) | 12.0% (696) |
| Health care | 8.8% (1,109) | 3.8% (256) | 14.7% (853) |
| Professional, scientific, and technical services | 8.4% (1,058) | 8.4% (574) | 8.3% (484) |
| Construction | 8.0% (1,010) | 14.1% (959) | 0.9% (51) |
| Arts, entertainment, and recreation | 4.0% (507) | 3.7% (254) | 4.4% (253) |
| Public administration | 3.5% (441) | 3.0% (205) | 4.1% (236) |
| Administrative and support and waste management services | 3.3% (412) | 4.0% (271) | 2.4% (141) |
| Finance and insurance | 3.0% (379) | 2.4% (163) | 3.7% (216) |
| Agriculture, forestry, fishing and hunting | 3.0% (375) | 4.7% (322) | 0.9% (53) |
| Real estate and rental and leasing | 2.5% (319) | 2.5% (171) | 2.6% (148) |
| Food and beverage stores | 2.4% (302) | 1.6% (109) | 3.3% (193) |
| Miscellaneous manufacturing | 2.3% (289) | 3.0% (203) | 1.5% (86) |
| Publishing, and motion picture and sound recording industries | 2.2% (281) | 2.2% (148) | 2.3% (133) |
| Social assistance | 2.1% (265) | 1.5% (104) | 2.8% (161) |
| Religious, grantmaking, civic, professional, and similar organizations | 2.0% (258) | 1.9% (132) | 2.2% (126) |
| Computer and electronic products | 2.0% (248) | 2.5% (168) | 1.4% (80) |
| Repair and maintenance | 1.6% (200) | 2.5% (173) | 0.5% (27) |
| Beverage and tobacco products | 1.5% (195) | 1.9% (128) | 1.2% (67) |
| Private households | 1.2% (152) | 0.1% (8) | 2.5% (144) |
| Personal and laundry services | 1.0% (123) | 0.2% (15) | 1.9% (108) |
| Motor vehicle and parts dealers | 0.9% (115) | 1.4% (95) | 0.3% (20) |
| Department and other general merchandise stores | 0.8% (106) | 0.3% (21) | 1.5% (85) |
| Other transportation, and support activities, and couriers | 0.8% (101) | 0.8% (54) | 0.8% (47) |
| Used merchandise, gift, novelty, and souvenir, and other miscellaneous stores | 0.8% (98) | 0.8% (53) | 0.8% (45) |
| Truck transportation | 0.7% (90) | 1.2% (82) | 0.1% (8) |
| U. S. Postal service | 0.7% (84) | 0.7% (48) | 0.6% (36) |
| Furniture and home furnishings, and household appliance stores | 0.7% (83) | 0.8% (51) | 0.6% (32) |
| Machinery | 0.6% (73) | 1.1% (73) | 0.0% (0) |
| Groceries and related products merchant wholesalers | 0.6% (72) | 0.8% (56) | 0.3% (16) |
| Building material and garden equipment and supplies dealers | 0.6% (72) | 0.3% (23) | 0.8% (49) |
| Wood products | 0.6% (72) | 1.0% (66) | 0.1% (6) |
| Furniture and related product manufacturing | 0.5% (65) | 0.9% (63) | 0.0% (2) |
| Broadcasting and telecommunications | 0.5% (62) | 0.5% (37) | 0.4% (25) |
| Miscellaneous nondurable goods merchant wholesalers | 0.5% (59) | 0.7% (49) | 0.2% (10) |
| Data processing, libraries, and other information services | 0.5% (59) | 0.7% (46) | 0.2% (13) |
| Nonmetallic mineral products | 0.4% (55) | 0.6% (41) | 0.2% (14) |
| Gasoline stations | 0.4% (50) | 0.3% (23) | 0.5% (27) |
| Other direct selling establishments | 0.4% (49) | 0.4% (25) | 0.4% (24) |
| Utilities | 0.4% (49) | 0.5% (36) | 0.2% (13) |
| Clothing and accessories, including shoe, stores | 0.4% (49) | 0.0% (0) | 0.8% (49) |
| Transportation equipment | 0.4% (45) | 0.4% (30) | 0.3% (15) |
| Printing and related support activities | 0.4% (45) | 0.6% (40) | 0.1% (5) |
| Pharmacies and drug stores | 0.3% (44) | 0.2% (12) | 0.6% (32) |
| Food | 0.3% (43) | 0.3% (19) | 0.4% (24) |
| Alcoholic beverages merchant wholesalers | 0.3% (39) | 0.2% (15) | 0.4% (24) |
| Paper | 0.3% (37) | 0.0% (2) | 0.6% (35) |
| Chemicals | 0.3% (35) | 0.1% (9) | 0.4% (26) |
| Apparel | 0.3% (32) | 0.0% (0) | 0.6% (32) |
| Machinery, equipment, and supplies merchant wholesalers | 0.2% (29) | 0.1% (10) | 0.3% (19) |
| Electronic shopping and mail-order houses | 0.2% (27) | 0.2% (12) | 0.3% (15) |
| Metal and metal products | 0.2% (26) | 0.4% (26) | 0.0% (0) |
| Fuel dealers | 0.2% (25) | 0.2% (13) | 0.2% (12) |
| Book stores and news dealers | 0.2% (24) | 0.1% (8) | 0.3% (16) |
| Plastics and rubber products | 0.2% (22) | 0.2% (11) | 0.2% (11) |
| Apparel, fabrics, and notions merchant wholesalers | 0.2% (22) | 0.0% (0) | 0.4% (22) |
| Motor vehicles, parts and supplies merchant wholesalers | 0.2% (20) | 0.3% (20) | 0.0% (0) |
| Health and personal care, except drug, stores | 0.2% (19) | 0.1% (7) | 0.2% (12) |
| Radio, TV, and computer stores | 0.1% (14) | 0.1% (5) | 0.2% (9) |
| Jewelry, luggage, and leather goods stores | 0.1% (12) | 0.1% (9) | 0.1% (3) |
| Petroleum and coal products | 0.1% (12) | 0.1% (9) | 0.1% (3) |
| Mining, quarrying, and oil and gas extraction | 0.1% (11) | 0.2% (11) | 0.0% (0) |
| Lumber and other construction materials merchant wholesalers | 0.1% (11) | 0.2% (11) | 0.0% (0) |
| Rail transportation | 0.1% (10) | 0.1% (10) | 0.0% (0) |
| Recyclable material merchant wholesalers | 0.1% (9) | 0.1% (9) | 0.0% (0) |
| Farm product raw materials merchant wholesalers | 0.1% (8) | 0.1% (8) | 0.0% (0) |
| Hardware, plumbing and heating equipment, and supplies merchant wholesalers | 0.1% (8) | 0.1% (7) | 0.0% (1) |
| Water transportation | 0.1% (7) | 0.1% (7) | 0.0% (0) |
Unemployment in Russian River-Coastal
- Unemployment by race in 2000
- Unemployment rate for White non-Hispanic residents
- 5.4%Males
- 4.1%Females
- Unemployment rate for Black residents
- 2.5%Males
- 44.1%Females
- Unemployment rate for American Indian and Alaska Native residents
- 18.0%Males
- Unemployment rate for other race residents
- 8.2%Males
- 27.7%Females
- Unemployment rate for two or more race residents
- 8.2%Males
- 7.0%Females
- Unemployment rate for Hispanic or Latino residents
- 10.0%Males
- 12.8%Females
Time leaving home to go to work

<5am:
| Russian River-Coastal: | 2.8% (349) |
| California: | 4.2% (606,086) |
5:30am:
| Russian River-Coastal: | 2.6% (322) |
| California: | 3.6% (523,209) |
6am:
| Russian River-Coastal: | 3.5% (437) |
| California: | 4.8% (692,256) |
6:30am:
| Russian River-Coastal: | 6.2% (773) |
| California: | 8.4% (1,216,867) |
7am:
| Russian River-Coastal: | 7.9% (976) |
| California: | 9.4% (1,362,830) |
7:30am:
| Russian River-Coastal: | 13.2% (1,634) |
| California: | 13.8% (2,006,950) |
8am:
| Russian River-Coastal: | 11.6% (1,435) |
| California: | 13.7% (1,986,831) |
8:30am:
| Russian River-Coastal: | 11.3% (1,395) |
| California: | 10.9% (1,577,815) |
9am:
| Russian River-Coastal: | 6.2% (763) |
| California: | 5.4% (778,152) |
10am:
| Russian River-Coastal: | 8.6% (1,067) |
| California: | 6.7% (972,355) |
11am:
| Russian River-Coastal: | 3.6% (443) |
| California: | 2.9% (414,479) |
12pm:
| Russian River-Coastal: | 2.0% (250) |
| California: | 1.3% (189,005) |
4pm:
| Russian River-Coastal: | 7.1% (879) |
| California: | 6.0% (865,284) |
>4pm:
| Russian River-Coastal: | 3.9% (477) |
| California: | 5.3% (776,167) |
Travel time to work


Less than 5 minutes:
| Russian River-Coastal: | 5.2% (642) |
| California: | 2.2% (324,703) |
5 to 9 minutes:
| Russian River-Coastal: | 11.5% (1,417) |
| California: | 8.8% (1,280,443) |
10 to 14 minutes:
| Russian River-Coastal: | 7.2% (895) |
| California: | 13.3% (1,930,263) |
15 to 19 minutes:
| Russian River-Coastal: | 9.3% (1,151) |
| California: | 14.9% (2,157,970) |
20 to 24 minutes:
| Russian River-Coastal: | 9.4% (1,166) |
| California: | 13.8% (2,004,060) |
25 to 29 minutes:
| Russian River-Coastal: | 6.3% (784) |
| California: | 5.4% (782,241) |
30 to 34 minutes:
| Russian River-Coastal: | 15.3% (1,899) |
| California: | 13.9% (2,025,657) |
35 to 39 minutes:
| Russian River-Coastal: | 4.0% (497) |
| California: | 2.5% (366,487) |
40 to 44 minutes:
| Russian River-Coastal: | 3.6% (448) |
| California: | 3.6% (528,043) |
45 to 59 minutes:
| Russian River-Coastal: | 7.8% (960) |
| California: | 7.9% (1,151,598) |
60 to 89 minutes:
| Russian River-Coastal: | 4.2% (525) |
| California: | 6.4% (933,123) |
90 or more minutes:
| Russian River-Coastal: | 6.6% (816) |
| California: | 3.3% (483,698) |
Means of transportation to work


Drove car alone:
| Russian River-Coastal: | 70.2% (8,691) |
| California: | 71.8% (10,432,462) |
Carpooled:
| Russian River-Coastal: | 12.7% (1,577) |
| California: | 14.5% (2,113,313) |
Bus or trolley bus:
| Russian River-Coastal: | 0.7% (91) |
| California: | 3.8% (549,425) |
Streetcar or trolley car:
| Russian River-Coastal: | 0.0% (2) |
| California: | 0.1% (21,158) |
Subway or elevated:
| Russian River-Coastal: | 0.2% (20) |
| California: | 0.7% (107,711) |
Railroad:
| Russian River-Coastal: | 0.0% (3) |
| California: | 0.3% (41,022) |
Motorcycle:
| Russian River-Coastal: | 0.2% (26) |
| California: | 0.2% (36,262) |
Bicycle:
| Russian River-Coastal: | 0.5% (59) |
| California: | 0.8% (120,567) |
Walked:
| Russian River-Coastal: | 5.1% (626) |
| California: | 2.9% (414,581) |
Other means:
| Russian River-Coastal: | 0.8% (105) |
| California: | 0.8% (115,064) |
Private vehicle occupancy

Drove alone:
| Russian River-Coastal: | 84.6% (8,691) |
| California: | 83.2% (10,432,462) |
In 2 person carpool:
| Russian River-Coastal: | 12.3% (1,261) |
| California: | 12.5% (1,564,905) |
In 3 person carpool:
| Russian River-Coastal: | 2.0% (210) |
| California: | 2.6% (330,732) |
In 4 person carpool:
| Russian River-Coastal: | 0.8% (82) |
| California: | 1.0% (119,364) |
In 5-6 person carpool:
| Russian River-Coastal: | 0.2% (24) |
| California: | 0.5% (57,036) |
Class of workers

Employee of private company:
| Russian River-Coastal: | 53.0% (6,674) |
| California: | 68.0% (10,009,465) |
Self-employed in own incorporated business:
| Russian River-Coastal: | 3.3% (422) |
| California: | 2.7% (402,392) |
Private not-for-profit wage and salary workers:
| Russian River-Coastal: | 8.2% (1,029) |
| California: | 5.7% (845,536) |
Local government workers:
| Russian River-Coastal: | 9.4% (1,188) |
| California: | 8.3% (1,218,764) |
State government workers:
| Russian River-Coastal: | 3.9% (494) |
| California: | 4.0% (594,953) |
Federal government workers:
| Russian River-Coastal: | 1.2% (151) |
| California: | 2.3% (344,354) |
Self-employed workers in own not incorporated business:
| Russian River-Coastal: | 20.3% (2,562) |
| California: | 8.5% (1,249,530) |
Unpaid family workers:
| Russian River-Coastal: | 0.6% (78) |
| California: | 0.4% (53,934) |

Employee of private company - Males:
| Russian River-Coastal: | 54.7% (3,721) |
| California: | 71.1% (5,716,697) |
Self-employed in own incorporated business - Males:
| Russian River-Coastal: | 4.5% (309) |
| California: | 3.6% (290,657) |
Private not-for-profit wage and salary workers - Males:
| Russian River-Coastal: | 6.0% (407) |
| California: | 3.8% (303,997) |
Local government workers - Males:
| Russian River-Coastal: | 7.2% (492) |
| California: | 6.2% (495,927) |
State government workers - Males:
| Russian River-Coastal: | 3.2% (219) |
| California: | 3.2% (255,434) |
Federal government workers - Males:
| Russian River-Coastal: | 1.5% (101) |
| California: | 2.5% (198,555) |
Self-employed workers in own not incorporated business - Males:
| Russian River-Coastal: | 22.2% (1,508) |
| California: | 9.5% (760,853) |
Unpaid family workers - Males:
| Russian River-Coastal: | 0.6% (43) |
| California: | 0.3% (23,230) |

Employee of private company - Females:
| Russian River-Coastal: | 50.9% (2,953) |
| California: | 64.3% (4,292,768) |
Self-employed in own incorporated business - Females:
| Russian River-Coastal: | 1.9% (113) |
| California: | 1.7% (111,735) |
Private not-for-profit wage and salary workers - Females:
| Russian River-Coastal: | 10.7% (622) |
| California: | 8.1% (541,539) |
Local government workers - Females:
| Russian River-Coastal: | 12.0% (696) |
| California: | 10.8% (722,837) |
State government workers - Females:
| Russian River-Coastal: | 4.7% (275) |
| California: | 5.1% (339,519) |
Federal government workers - Females:
| Russian River-Coastal: | 0.9% (50) |
| California: | 2.2% (145,799) |
Self-employed workers in own not incorporated business - Females:
| Russian River-Coastal: | 18.2% (1,054) |
| California: | 7.3% (488,677) |
Unpaid family workers - Females:
| Russian River-Coastal: | 0.6% (35) |
| California: | 0.5% (30,704) |