Work and Jobs in San Benito, Texas (TX) Detailed Stats
Occupations, Industries, Unemployment, Workers, Commute
Settings
X


Recent posts about work in San Benito, Texas on our local forum with over 2,400,000 registered users:
 | Lower Rio Grande Valley... summer heat & humidity... working outside (6 replies) |
| Brownsville, TX what's it like (30 replies) |
| New job in South Padre, Where should I live? (4 replies) |
| Retirement communities in the Harlingen area (5 replies) |
| Finding rental housing on SPI (7 replies) |
| How many French speakers are in Texas? (12 replies) |
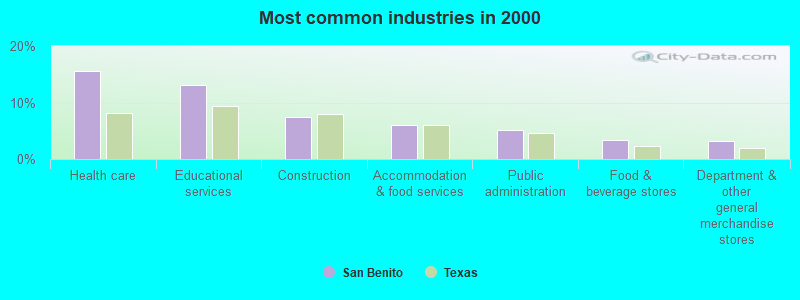
The most common industries in San Benito are: Health care (15.6% of civilian employees), Educational services (13.1% of civilian employees), Construction (7.5% of civilian employees). 89.5% of workers work in Cameron County and 8.2% of all workers work at home. 64.1% of workers are employees of private companies, which is 8.4% less than the rate of 69.6% across the entire state of Texas.
Whole page based on the data from 2000 / 2022 when the population of San Benito, Texas was 23,444 / 24,963
Whole page based on the data from 2000 / 2022 when the population of San Benito, Texas was 23,444 / 24,963
Most common industries
Most common industries | |||
|---|---|---|---|
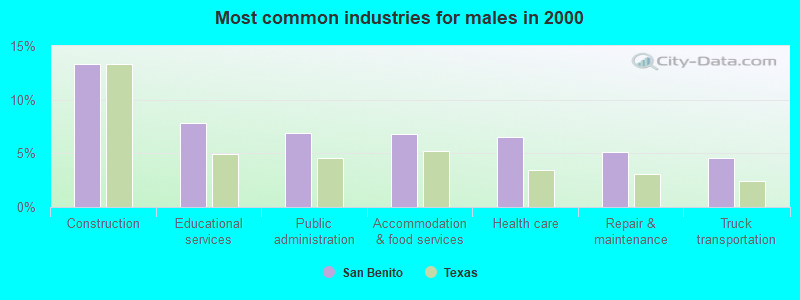
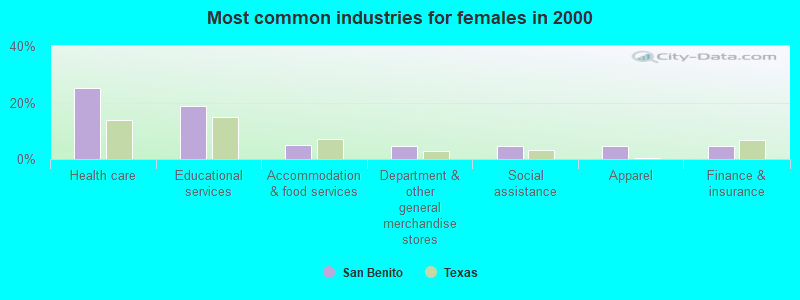
Industry | All | Males | Females |
| Health care | 15.6% (1,171) | 6.5% (252) | 25.2% (919) |
| Educational services | 13.1% (986) | 7.9% (304) | 18.7% (682) |
| Construction | 7.5% (563) | 13.3% (516) | 1.3% (47) |
| Accommodation and food services | 6.0% (449) | 6.8% (264) | 5.1% (185) |
| Public administration | 5.1% (386) | 6.9% (266) | 3.3% (120) |
| Food and beverage stores | 3.4% (254) | 3.1% (121) | 3.6% (133) |
| Department and other general merchandise stores | 3.3% (246) | 2.0% (77) | 4.6% (169) |
| Apparel | 3.0% (225) | 1.6% (62) | 4.5% (163) |
| Administrative and support and waste management services | 2.9% (220) | 4.4% (171) | 1.3% (49) |
| Repair and maintenance | 2.8% (212) | 5.1% (198) | 0.4% (14) |
| Finance and insurance | 2.8% (212) | 1.3% (50) | 4.4% (162) |
| Professional, scientific, and technical services | 2.6% (193) | 2.8% (109) | 2.3% (84) |
| Social assistance | 2.6% (192) | 0.7% (27) | 4.5% (165) |
| Truck transportation | 2.5% (191) | 4.5% (176) | 0.4% (15) |
| Real estate and rental and leasing | 2.3% (172) | 1.3% (51) | 3.3% (121) |
| Food | 1.8% (135) | 2.8% (108) | 0.7% (27) |
| Agriculture, forestry, fishing and hunting | 1.6% (123) | 2.8% (107) | 0.4% (16) |
| Private households | 1.4% (107) | 0.0% (0) | 2.9% (107) |
| Motor vehicle and parts dealers | 1.3% (98) | 1.8% (69) | 0.8% (29) |
| Other transportation, and support activities, and couriers | 1.2% (90) | 1.8% (70) | 0.5% (20) |
| Religious, grantmaking, civic, professional, and similar organizations | 1.1% (83) | 0.9% (36) | 1.3% (47) |
| Personal and laundry services | 1.0% (79) | 0.8% (32) | 1.3% (47) |
| Computer and electronic products | 1.0% (76) | 1.4% (54) | 0.6% (22) |
| Building material and garden equipment and supplies dealers | 0.9% (69) | 0.9% (33) | 1.0% (36) |
| Broadcasting and telecommunications | 0.8% (60) | 1.4% (56) | 0.1% (4) |
| Groceries and related products merchant wholesalers | 0.7% (56) | 1.3% (50) | 0.2% (6) |
| Electrical equipment, appliances, and components | 0.7% (52) | 1.1% (44) | 0.2% (8) |
| Pharmacies and drug stores | 0.7% (49) | 1.0% (39) | 0.3% (10) |
| Textile mills and textile products | 0.6% (48) | 0.8% (31) | 0.5% (17) |
| Used merchandise, gift, novelty, and souvenir, and other miscellaneous stores | 0.6% (47) | 0.8% (30) | 0.5% (17) |
| Metal and metal products | 0.6% (44) | 0.9% (35) | 0.2% (9) |
| Publishing, and motion picture and sound recording industries | 0.5% (41) | 0.8% (31) | 0.3% (10) |
| U. S. Postal service | 0.5% (37) | 1.0% (37) | 0.0% (0) |
| Machinery | 0.5% (37) | 0.6% (24) | 0.4% (13) |
| Clothing and accessories, including shoe, stores | 0.5% (36) | 0.5% (21) | 0.4% (15) |
| Nonmetallic mineral products | 0.5% (34) | 0.8% (30) | 0.1% (4) |
| Arts, entertainment, and recreation | 0.4% (33) | 0.1% (5) | 0.8% (28) |
| Transportation equipment | 0.4% (33) | 0.9% (33) | 0.0% (0) |
| Machinery, equipment, and supplies merchant wholesalers | 0.4% (32) | 0.8% (32) | 0.0% (0) |
| Furniture and home furnishings, and household appliance stores | 0.4% (31) | 0.4% (16) | 0.4% (15) |
| Chemicals | 0.4% (27) | 0.7% (27) | 0.0% (0) |
| Radio, TV, and computer stores | 0.4% (27) | 0.3% (11) | 0.4% (16) |
| Apparel, fabrics, and notions merchant wholesalers | 0.3% (26) | 0.5% (20) | 0.2% (6) |
| Miscellaneous nondurable goods merchant wholesalers | 0.3% (21) | 0.5% (21) | 0.0% (0) |
| Electrical and electronic goods merchant wholesalers | 0.3% (21) | 0.5% (21) | 0.0% (0) |
| Utilities | 0.3% (19) | 0.2% (9) | 0.3% (10) |
| Professional and commercial equipment and supplies merchant wholesalers | 0.2% (17) | 0.4% (17) | 0.0% (0) |
| Jewelry, luggage, and leather goods stores | 0.2% (16) | 0.2% (7) | 0.2% (9) |
| Beverage and tobacco products | 0.2% (14) | 0.4% (14) | 0.0% (0) |
| Miscellaneous manufacturing | 0.2% (13) | 0.3% (13) | 0.0% (0) |
| Mining, quarrying, and oil and gas extraction | 0.2% (13) | 0.3% (13) | 0.0% (0) |
| Miscellaneous durable goods merchant wholesalers | 0.1% (11) | 0.0% (0) | 0.3% (11) |
| Drugs, sundries, and chemical and allied products merchant wholesalers | 0.1% (10) | 0.0% (0) | 0.3% (10) |
| Sporting goods, camera, and hobby and toy stores | 0.1% (10) | 0.0% (0) | 0.3% (10) |
| Leather and allied products | 0.1% (9) | 0.2% (9) | 0.0% (0) |
| Office supplies and stationery stores | 0.1% (9) | 0.0% (0) | 0.2% (9) |
| Metals and minerals, except petroleum, merchant wholesalers | 0.1% (9) | 0.0% (0) | 0.2% (9) |
| Health and personal care, except drug, stores | 0.1% (8) | 0.0% (0) | 0.2% (8) |
| Plastics and rubber products | 0.1% (8) | 0.2% (8) | 0.0% (0) |
| Lumber and other construction materials merchant wholesalers | 0.1% (5) | 0.1% (5) | 0.0% (0) |
| Gasoline stations | 0.1% (5) | 0.1% (5) | 0.0% (0) |
| Hardware, plumbing and heating equipment, and supplies merchant wholesalers | 0.1% (5) | 0.1% (5) | 0.0% (0) |
Unemployment in San Benito
- Unemployment by race in 2022
- Unemployment rate for White non-Hispanic residents
- 3.3%Males
- 0.8%Females
- Unemployment rate for other race residents
- 2.2%Males
- Unemployment rate for two or more race residents
- 7.2%Males
- 5.9%Females
- Unemployment rate for Hispanic or Latino residents
- 5.1%Males
- 3.6%Females
- Unemployment by race in 2000
- Unemployment rate for White non-Hispanic residents
- 2.9%Males
- 3.4%Females
- Unemployment rate for other race residents
- 10.1%Males
- 13.7%Females
- Unemployment rate for two or more race residents
- 52.7%Females
- Unemployment rate for Hispanic or Latino residents
- 11.0%Males
- 15.2%Females
Time leaving home to go to work

12:00 a.m. to 4:59 a.m.:
| San Benito: | 7.3% (583) |
| Texas: | 5.5% (678,264) |
5:00 a.m. to 5:29 a.m.:
| San Benito: | 3.1% (247) |
| Texas: | 4.3% (525,841) |
5:30 a.m. to 5:59 a.m.:
| San Benito: | 1.5% (117) |
| Texas: | 4.9% (603,953) |
6:00 a.m. to 6:29 a.m.:
| San Benito: | 6.1% (486) |
| Texas: | 9.4% (1,155,020) |
6:30 a.m. to 6:59 a.m.:
| San Benito: | 7.6% (611) |
| Texas: | 9.3% (1,152,822) |
7:00 a.m. to 7:29 a.m.:
| San Benito: | 14.1% (1,132) |
| Texas: | 15.3% (1,885,477) |
7:30 a.m. to 7:59 a.m.:
| San Benito: | 13.4% (1,074) |
| Texas: | 11.9% (1,469,628) |
8:00 a.m. to 8:29 a.m.:
| San Benito: | 17.4% (1,397) |
| Texas: | 11.3% (1,400,175) |
8:30 a.m. to 8:59 a.m.:
| San Benito: | 5.1% (409) |
| Texas: | 4.9% (599,574) |
9:00 a.m. to 9:59 a.m.:
| San Benito: | 8.9% (714) |
| Texas: | 6.7% (829,367) |
10:00 a.m. to 10:59 a.m.:
| San Benito: | 2.0% (157) |
| Texas: | 3.2% (390,354) |
11:00 a.m. to 11:59 a.m.:
| San Benito: | 0.5% (42) |
| Texas: | 1.3% (162,330) |
12:00 p.m. to 3:59 p.m.:
| San Benito: | 7.6% (613) |
| Texas: | 5.8% (720,594) |
4:00 p.m. to 11:59 p.m.:
| San Benito: | 5.2% (420) |
| Texas: | 6.3% (777,072) |

<5am:
| San Benito: | 2.3% (168) |
| Texas: | 3.1% (281,361) |
5:30am:
| San Benito: | 1.6% (118) |
| Texas: | 2.9% (262,060) |
6am:
| San Benito: | 4.3% (320) |
| Texas: | 4.4% (403,423) |
6:30am:
| San Benito: | 7.8% (583) |
| Texas: | 8.8% (808,876) |
7am:
| San Benito: | 10.5% (786) |
| Texas: | 10.7% (976,557) |
7:30am:
| San Benito: | 16.5% (1,229) |
| Texas: | 16.4% (1,500,904) |
8am:
| San Benito: | 19.7% (1,470) |
| Texas: | 16.8% (1,536,308) |
8:30am:
| San Benito: | 10.3% (771) |
| Texas: | 10.0% (913,601) |
9am:
| San Benito: | 3.6% (268) |
| Texas: | 4.4% (398,656) |
10am:
| San Benito: | 4.0% (302) |
| Texas: | 5.2% (472,592) |
11am:
| San Benito: | 2.6% (193) |
| Texas: | 2.2% (197,844) |
12pm:
| San Benito: | 1.4% (102) |
| Texas: | 0.9% (86,997) |
4pm:
| San Benito: | 5.3% (397) |
| Texas: | 5.5% (503,565) |
>4pm:
| San Benito: | 7.3% (543) |
| Texas: | 6.1% (563,107) |

12:00 a.m. to 4:59 a.m. - Males:
| San Benito: | 9.1% (430) |
| Texas: | 7.0% (477,284) |
5:00 a.m. to 5:29 a.m. - Males:
| San Benito: | 4.2% (201) |
| Texas: | 5.8% (394,876) |
5:30 a.m. to 5:59 a.m. - Males:
| San Benito: | 2.0% (95) |
| Texas: | 5.9% (402,788) |
6:00 a.m. to 6:29 a.m. - Males:
| San Benito: | 6.7% (318) |
| Texas: | 10.9% (751,118) |
6:30 a.m. to 6:59 a.m. - Males:
| San Benito: | 5.2% (249) |
| Texas: | 9.5% (652,306) |
7:00 a.m. to 7:29 a.m. - Males:
| San Benito: | 11.0% (525) |
| Texas: | 14.1% (970,598) |
7:30 a.m. to 7:59 a.m. - Males:
| San Benito: | 10.5% (498) |
| Texas: | 10.2% (696,429) |
8:00 a.m. to 8:29 a.m. - Males:
| San Benito: | 23.0% (1,091) |
| Texas: | 10.6% (729,041) |
8:30 a.m. to 8:59 a.m. - Males:
| San Benito: | 5.1% (242) |
| Texas: | 4.1% (281,762) |
9:00 a.m. to 9:59 a.m. - Males:
| San Benito: | 10.0% (476) |
| Texas: | 5.8% (401,071) |
10:00 a.m. to 10:59 a.m. - Males:
| San Benito: | 3.8% (181) |
| Texas: | 2.7% (186,469) |
11:00 a.m. to 11:59 a.m. - Males:
| San Benito: | 0.7% (31) |
| Texas: | 1.2% (82,242) |
12:00 p.m. to 3:59 p.m. - Males:
| San Benito: | 6.2% (297) |
| Texas: | 5.8% (397,795) |
4:00 p.m. to 11:59 p.m. - Males:
| San Benito: | 4.4% (208) |
| Texas: | 6.4% (435,950) |

12:00 a.m. to 4:59 a.m. - Females:
| San Benito: | 4.8% (156) |
| Texas: | 3.7% (200,980) |
5:00 a.m. to 5:29 a.m. - Females:
| San Benito: | 1.6% (50) |
| Texas: | 2.4% (130,965) |
5:30 a.m. to 5:59 a.m. - Females:
| San Benito: | 0.6% (19) |
| Texas: | 3.7% (201,165) |
6:00 a.m. to 6:29 a.m. - Females:
| San Benito: | 4.9% (158) |
| Texas: | 7.4% (403,902) |
6:30 a.m. to 6:59 a.m. - Females:
| San Benito: | 11.9% (383) |
| Texas: | 9.1% (500,516) |
7:00 a.m. to 7:29 a.m. - Females:
| San Benito: | 18.9% (609) |
| Texas: | 16.7% (914,879) |
7:30 a.m. to 7:59 a.m. - Females:
| San Benito: | 17.4% (562) |
| Texas: | 14.1% (773,199) |
8:00 a.m. to 8:29 a.m. - Females:
| San Benito: | 11.0% (355) |
| Texas: | 12.2% (671,134) |
8:30 a.m. to 8:59 a.m. - Females:
| San Benito: | 5.2% (169) |
| Texas: | 5.8% (317,812) |
9:00 a.m. to 9:59 a.m. - Females:
| San Benito: | 7.1% (230) |
| Texas: | 7.8% (428,296) |
11:00 a.m. to 11:59 a.m. - Females:
| San Benito: | 1.1% (37) |
| Texas: | 1.5% (80,088) |
12:00 p.m. to 3:59 p.m. - Females:
| San Benito: | 9.8% (318) |
| Texas: | 5.9% (322,799) |
4:00 p.m. to 11:59 p.m. - Females:
| San Benito: | 6.4% (205) |
| Texas: | 6.2% (341,122) |
Travel time to work
Percentage of workers working in this county: 89.5%
Number of people working at home: 721 (8.2% of all workers)
Daytime population change due to commuting: -62 (-0.3%)
Workers who live and work in this city: 2,638 (35.4%)
Number of people working at home: 721 (8.2% of all workers)
Daytime population change due to commuting: -62 (-0.3%)
Workers who live and work in this city: 2,638 (35.4%)

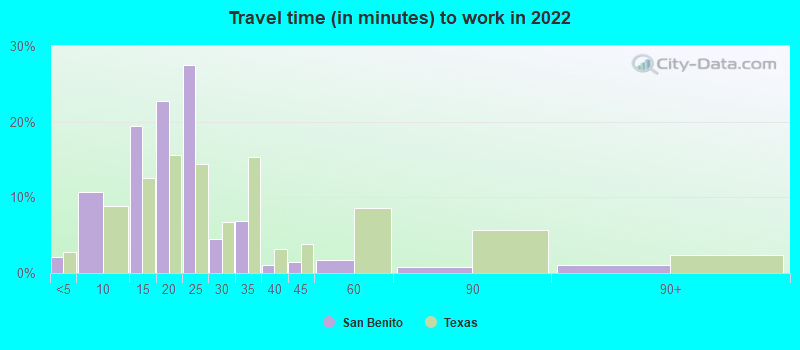

Less than 5 minutes:
| San Benito: | 2.1% (198) |
| Texas: | 2.8% (350,462) |
5 to 9 minutes:
| San Benito: | 10.6% (988) |
| Texas: | 8.8% (1,087,762) |
10 to 14 minutes:
| San Benito: | 19.4% (1,806) |
| Texas: | 12.6% (1,550,271) |
15 to 19 minutes:
| San Benito: | 22.7% (2,105) |
| Texas: | 15.6% (1,918,353) |
20 to 24 minutes:
| San Benito: | 27.5% (2,555) |
| Texas: | 14.4% (1,772,079) |
25 to 29 minutes:
| San Benito: | 4.4% (412) |
| Texas: | 6.7% (827,833) |
30 to 34 minutes:
| San Benito: | 6.9% (640) |
| Texas: | 15.3% (1,887,878) |
35 to 39 minutes:
| San Benito: | 1.1% (99) |
| Texas: | 3.2% (394,170) |
40 to 44 minutes:
| San Benito: | 1.4% (134) |
| Texas: | 3.9% (476,118) |
45 to 59 minutes:
| San Benito: | 1.7% (159) |
| Texas: | 8.6% (1,058,376) |
60 to 89 minutes:
| San Benito: | 0.8% (76) |
| Texas: | 5.7% (706,002) |
90 or more minutes:
| San Benito: | 1.1% (103) |
| Texas: | 2.4% (299,884) |


Less than 5 minutes:
| San Benito: | 3.4% (255) |
| Texas: | 3.0% (277,642) |
5 to 9 minutes:
| San Benito: | 16.9% (1,263) |
| Texas: | 10.3% (942,891) |
10 to 14 minutes:
| San Benito: | 22.0% (1,640) |
| Texas: | 14.4% (1,317,555) |
15 to 19 minutes:
| San Benito: | 24.1% (1,797) |
| Texas: | 16.0% (1,467,945) |
20 to 24 minutes:
| San Benito: | 11.2% (835) |
| Texas: | 13.9% (1,276,781) |
25 to 29 minutes:
| San Benito: | 3.4% (253) |
| Texas: | 5.3% (482,838) |
30 to 34 minutes:
| San Benito: | 8.7% (647) |
| Texas: | 14.3% (1,309,699) |
35 to 39 minutes:
| San Benito: | 0.3% (24) |
| Texas: | 2.4% (219,873) |
40 to 44 minutes:
| San Benito: | 1.2% (86) |
| Texas: | 3.1% (280,916) |
45 to 59 minutes:
| San Benito: | 2.8% (207) |
| Texas: | 7.6% (692,006) |
60 to 89 minutes:
| San Benito: | 1.2% (86) |
| Texas: | 4.6% (418,905) |
90 or more minutes:
| San Benito: | 2.1% (157) |
| Texas: | 2.4% (218,800) |

Less than 5 minutes - Males:
| San Benito: | 0.2% (9) |
| Texas: | 2.7% (181,937) |
5 to 9 minutes - Males:
| San Benito: | 11.1% (543) |
| Texas: | 7.6% (522,166) |
10 to 14 minutes - Males:
| San Benito: | 18.5% (908) |
| Texas: | 11.5% (785,572) |
15 to 19 minutes - Males:
| San Benito: | 19.2% (944) |
| Texas: | 14.6% (1,001,179) |
20 to 24 minutes - Males:
| San Benito: | 30.7% (1,508) |
| Texas: | 13.9% (950,043) |
25 to 29 minutes - Males:
| San Benito: | 3.7% (184) |
| Texas: | 6.7% (457,259) |
30 to 34 minutes - Males:
| San Benito: | 9.8% (482) |
| Texas: | 16.2% (1,110,357) |
35 to 39 minutes - Males:
| San Benito: | 0.7% (34) |
| Texas: | 3.3% (223,512) |
40 to 44 minutes - Males:
| San Benito: | 1.3% (65) |
| Texas: | 4.2% (289,434) |
45 to 59 minutes - Males:
| San Benito: | 2.3% (115) |
| Texas: | 9.3% (639,122) |
60 to 89 minutes - Males:
| San Benito: | 0.4% (20) |
| Texas: | 6.8% (467,154) |
90 or more minutes - Males:
| San Benito: | 1.4% (68) |
| Texas: | 3.1% (211,313) |

Less than 5 minutes - Females:
| San Benito: | 5.5% (242) |
| Texas: | 3.1% (168,525) |
5 to 9 minutes - Females:
| San Benito: | 10.2% (448) |
| Texas: | 10.3% (565,596) |
10 to 14 minutes - Females:
| San Benito: | 20.4% (891) |
| Texas: | 13.9% (764,699) |
15 to 19 minutes - Females:
| San Benito: | 26.7% (1,167) |
| Texas: | 16.7% (917,174) |
20 to 24 minutes - Females:
| San Benito: | 23.5% (1,028) |
| Texas: | 15.0% (822,036) |
25 to 29 minutes - Females:
| San Benito: | 5.0% (218) |
| Texas: | 6.7% (370,574) |
30 to 34 minutes - Females:
| San Benito: | 4.0% (176) |
| Texas: | 14.2% (777,521) |
35 to 39 minutes - Females:
| San Benito: | 1.7% (74) |
| Texas: | 3.1% (170,658) |
40 to 44 minutes - Females:
| San Benito: | 1.6% (69) |
| Texas: | 3.4% (186,684) |
45 to 59 minutes - Females:
| San Benito: | 1.0% (44) |
| Texas: | 7.6% (419,254) |
60 to 89 minutes - Females:
| San Benito: | 0.9% (38) |
| Texas: | 4.4% (238,848) |
90 or more minutes - Females:
| San Benito: | 0.8% (36) |
| Texas: | 1.6% (88,571) |
Means of transportation to work
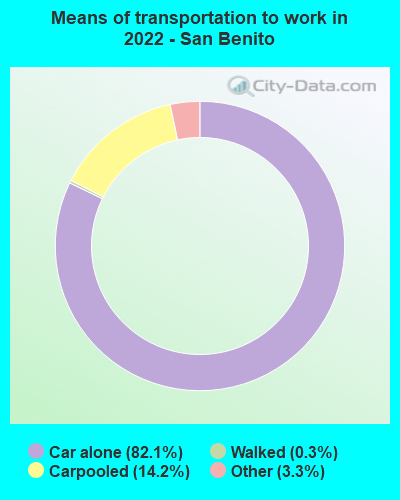

Drove car alone:
| San Benito: | 82.1% (7,737) |
| Texas: | 83.3% (4,557,023) |
Carpooled:
| San Benito: | 14.2% (1,339) |
| Texas: | 11.7% (674,818) |
Walked:
| San Benito: | 0.3% (30) |
| Texas: | 1.7% (99,911) |
Other means:
| San Benito: | 3.3% (314) |
| Texas: | 2.0% (95,481) |


Drove car alone:
| San Benito: | 72.9% (5,439) |
| Texas: | 77.7% (7,115,590) |
Carpooled:
| San Benito: | 17.2% (1,279) |
| Texas: | 14.5% (1,326,012) |
Bus or trolley bus:
| San Benito: | 0.4% (29) |
| Texas: | 1.7% (157,014) |
Motorcycle:
| San Benito: | 0.2% (18) |
| Texas: | 0.1% (12,068) |
Bicycle:
| San Benito: | 0.4% (33) |
| Texas: | 0.2% (21,551) |
Walked:
| San Benito: | 4.1% (309) |
| Texas: | 1.9% (173,670) |
Other means:
| San Benito: | 1.9% (143) |
| Texas: | 0.9% (86,692) |


Drove car alone - Males:
| San Benito: | 84.9% (4,269) |
| Texas: | 83.6% (4,557,023) |
Carpooled - Males:
| San Benito: | 13.6% (685) |
| Texas: | 11.2% (674,818) |
Walked - Males:
| San Benito: | 0.3% (15) |
| Texas: | 1.7% (99,911) |
Other means - Males:
| San Benito: | 1.2% (60) |
| Texas: | 2.2% (95,481) |


Drove car alone - Females:
| San Benito: | 78.9% (3,462) |
| Texas: | 83.0% (4,557,023) |
Carpooled - Females:
| San Benito: | 14.9% (655) |
| Texas: | 12.3% (674,818) |
Walked - Females:
| San Benito: | 0.3% (15) |
| Texas: | 1.8% (99,911) |
Other means - Females:
| San Benito: | 5.9% (257) |
| Texas: | 1.7% (95,481) |
Private vehicle occupancy

Drove alone:
| San Benito: | 86.0% (6,656) |
| Texas: | 87.6% (10,283,021) |
In 2 person carpool:
| San Benito: | 12.0% (930) |
| Texas: | 9.0% (1,052,595) |
In 3 person carpool:
| San Benito: | 1.5% (118) |
| Texas: | 2.1% (244,139) |

Drove alone:
| San Benito: | 81.0% (5,439) |
| Texas: | 84.3% (7,115,590) |
In 2 person carpool:
| San Benito: | 13.2% (886) |
| Texas: | 11.6% (982,994) |
In 3 person carpool:
| San Benito: | 4.1% (276) |
| Texas: | 2.4% (201,602) |
In 4 person carpool:
| San Benito: | 0.9% (59) |
| Texas: | 1.0% (83,518) |
In 5-6 person carpool:
| San Benito: | 0.1% (6) |
| Texas: | 0.5% (40,662) |
In 7+ person carpool:
| San Benito: | 0.8% (52) |
| Texas: | 0.2% (17,236) |
Class of workers

Employee of private company:
| San Benito: | 64.1% (5,708) |
| Texas: | 69.6% (10,139,666) |
Self-employed in own incorporated business:
| San Benito: | 1.0% (92) |
| Texas: | 3.5% (516,446) |
Private not-for-profit wage and salary workers:
| San Benito: | 5.6% (496) |
| Texas: | 6.0% (870,454) |
Local government workers:
| San Benito: | 11.0% (977) |
| Texas: | 7.6% (1,109,799) |
State government workers:
| San Benito: | 4.8% (431) |
| Texas: | 3.8% (558,618) |
Federal government workers:
| San Benito: | 2.8% (247) |
| Texas: | 2.5% (357,298) |
Self-employed workers in own not incorporated business:
| San Benito: | 10.4% (928) |
| Texas: | 6.8% (998,270) |
Unpaid family workers:
| San Benito: | 0.2% (19) |
| Texas: | 0.2% (27,882) |

Employee of private company:
| San Benito: | 64.0% (4,817) |
| Texas: | 69.6% (6,425,274) |
Self-employed in own incorporated business:
| San Benito: | 2.0% (151) |
| Texas: | 2.7% (250,864) |
Private not-for-profit wage and salary workers:
| San Benito: | 6.6% (496) |
| Texas: | 5.7% (526,631) |
Local government workers:
| San Benito: | 10.2% (771) |
| Texas: | 6.6% (608,479) |
State government workers:
| San Benito: | 7.1% (535) |
| Texas: | 5.4% (501,082) |
Federal government workers:
| San Benito: | 3.1% (230) |
| Texas: | 2.6% (237,177) |
Self-employed workers in own not incorporated business:
| San Benito: | 6.8% (510) |
| Texas: | 7.1% (653,527) |
Unpaid family workers:
| San Benito: | 0.2% (14) |
| Texas: | 0.3% (31,338) |

Employee of private company - Males:
| San Benito: | 63.2% (3,372) |
| Texas: | 73.1% (5,788,450) |
Self-employed in own incorporated business - Males:
| San Benito: | 1.3% (69) |
| Texas: | 4.2% (332,655) |
Private not-for-profit wage and salary workers - Males:
| San Benito: | 4.4% (235) |
| Texas: | 4.1% (323,476) |
Local government workers - Males:
| San Benito: | 9.5% (505) |
| Texas: | 5.1% (405,467) |
State government workers - Males:
| San Benito: | 3.7% (198) |
| Texas: | 3.0% (236,706) |
Federal government workers - Males:
| San Benito: | 4.5% (238) |
| Texas: | 2.7% (211,629) |
Self-employed workers in own not incorporated business - Males:
| San Benito: | 13.4% (716) |
| Texas: | 7.7% (609,246) |

Employee of private company - Females:
| San Benito: | 65.5% (2,335) |
| Texas: | 65.4% (4,351,216) |
Self-employed in own incorporated business - Females:
| San Benito: | 0.6% (23) |
| Texas: | 2.8% (183,791) |
Private not-for-profit wage and salary workers - Females:
| San Benito: | 7.3% (261) |
| Texas: | 8.2% (546,978) |
Local government workers - Females:
| San Benito: | 13.3% (472) |
| Texas: | 10.6% (704,332) |
State government workers - Females:
| San Benito: | 6.5% (233) |
| Texas: | 4.8% (321,912) |
Federal government workers - Females:
| San Benito: | 0.2% (8) |
| Texas: | 2.2% (145,669) |
Self-employed workers in own not incorporated business - Females:
| San Benito: | 6.0% (212) |
| Texas: | 5.8% (389,024) |
Unpaid family workers - Females:
| San Benito: | 0.5% (19) |
| Texas: | 0.2% (15,276) |