Work and Jobs in South Coast, California (CA) Detailed Stats
Occupations, Industries, Unemployment, Workers, Commute
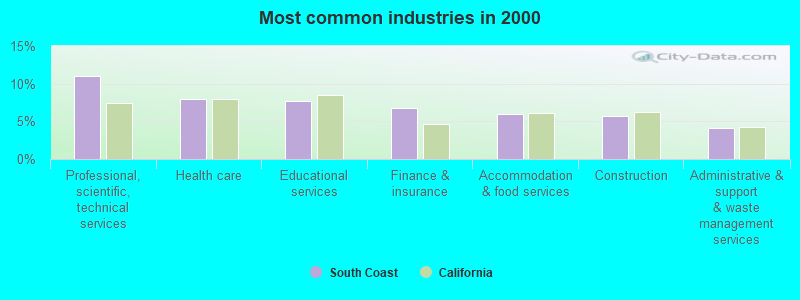
The most common industries in South Coast are: Professional, scientific, technical services (11.0% of civilian employees), Health care (7.9% of civilian employees), Educational services (7.6% of civilian employees). 67.6% of workers are employees of private companies, which is about the same as the rate of 68.0% across the entire state of California.
Most common industries
Most common industries | |||
|---|---|---|---|
Industry | All | Males | Females |
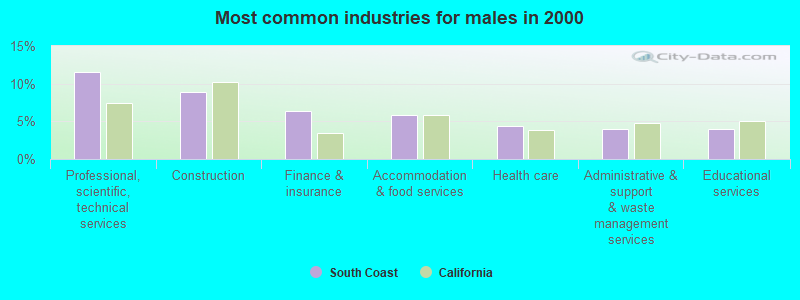
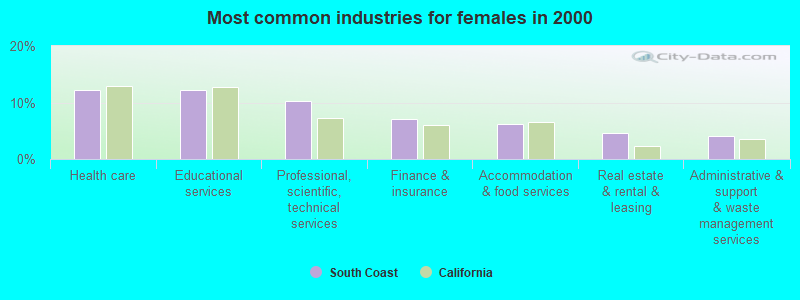
| Professional, scientific, and technical services | 11.0% (15,729) | 11.6% (9,112) | 10.2% (6,617) |
| Health care | 7.9% (11,349) | 4.4% (3,489) | 12.1% (7,860) |
| Educational services | 7.6% (10,956) | 3.9% (3,106) | 12.1% (7,850) |
| Finance and insurance | 6.7% (9,621) | 6.3% (4,995) | 7.1% (4,626) |
| Accommodation and food services | 6.0% (8,573) | 5.9% (4,602) | 6.1% (3,971) |
| Construction | 5.7% (8,232) | 8.9% (7,038) | 1.8% (1,194) |
| Administrative and support and waste management services | 4.1% (5,812) | 4.0% (3,175) | 4.1% (2,637) |
| Real estate and rental and leasing | 4.0% (5,729) | 3.5% (2,714) | 4.7% (3,015) |
| Computer and electronic products | 3.0% (4,323) | 3.6% (2,844) | 2.3% (1,479) |
| Public administration | 3.0% (4,249) | 3.4% (2,681) | 2.4% (1,568) |
| Arts, entertainment, and recreation | 2.4% (3,448) | 2.6% (2,026) | 2.2% (1,422) |
| Miscellaneous manufacturing | 2.4% (3,377) | 2.8% (2,213) | 1.8% (1,164) |
| Transportation equipment | 1.7% (2,416) | 2.4% (1,879) | 0.8% (537) |
| Food and beverage stores | 1.5% (2,202) | 1.5% (1,184) | 1.6% (1,018) |
| Personal and laundry services | 1.4% (2,028) | 0.7% (519) | 2.3% (1,509) |
| Publishing, and motion picture and sound recording industries | 1.4% (1,983) | 1.5% (1,153) | 1.3% (830) |
| Broadcasting and telecommunications | 1.3% (1,923) | 1.7% (1,324) | 0.9% (599) |
| Radio, TV, and computer stores | 1.3% (1,912) | 1.7% (1,331) | 0.9% (581) |
| Social assistance | 1.3% (1,885) | 0.3% (266) | 2.5% (1,619) |
| Department and other general merchandise stores | 1.3% (1,812) | 0.9% (685) | 1.7% (1,127) |
| Repair and maintenance | 1.2% (1,731) | 1.9% (1,495) | 0.4% (236) |
| Motor vehicle and parts dealers | 1.2% (1,687) | 1.6% (1,269) | 0.6% (418) |
| Religious, grantmaking, civic, professional, and similar organizations | 1.1% (1,539) | 0.8% (633) | 1.4% (906) |
| Other transportation, and support activities, and couriers | 1.0% (1,480) | 1.4% (1,087) | 0.6% (393) |
| Professional and commercial equipment and supplies merchant wholesalers | 0.9% (1,264) | 1.2% (935) | 0.5% (329) |
| Clothing and accessories, including shoe, stores | 0.9% (1,237) | 0.6% (440) | 1.2% (797) |
| Chemicals | 0.9% (1,226) | 1.0% (777) | 0.7% (449) |
| Air transportation | 0.8% (1,191) | 0.8% (656) | 0.8% (535) |
| Other direct selling establishments | 0.8% (1,186) | 0.7% (574) | 0.9% (612) |
| Building material and garden equipment and supplies dealers | 0.8% (1,147) | 1.1% (829) | 0.5% (318) |
| Data processing, libraries, and other information services | 0.8% (1,125) | 0.9% (681) | 0.7% (444) |
| Utilities | 0.8% (1,101) | 1.1% (841) | 0.4% (260) |
| Used merchandise, gift, novelty, and souvenir, and other miscellaneous stores | 0.7% (1,024) | 0.5% (409) | 1.0% (615) |
| Printing and related support activities | 0.7% (1,005) | 0.9% (699) | 0.5% (306) |
| Private households | 0.7% (976) | 0.1% (97) | 1.4% (879) |
| Miscellaneous nondurable goods merchant wholesalers | 0.7% (960) | 0.8% (591) | 0.6% (369) |
| Furniture and home furnishings, and household appliance stores | 0.6% (896) | 0.5% (431) | 0.7% (465) |
| Metal and metal products | 0.6% (836) | 0.9% (684) | 0.2% (152) |
| Electrical and electronic goods merchant wholesalers | 0.6% (814) | 0.6% (489) | 0.5% (325) |
| Machinery | 0.5% (733) | 0.8% (612) | 0.2% (121) |
| Pharmacies and drug stores | 0.5% (699) | 0.4% (291) | 0.6% (408) |
| Groceries and related products merchant wholesalers | 0.5% (651) | 0.6% (444) | 0.3% (207) |
| Sporting goods, camera, and hobby and toy stores | 0.4% (631) | 0.5% (401) | 0.4% (230) |
| Miscellaneous durable goods merchant wholesalers | 0.4% (576) | 0.6% (456) | 0.2% (120) |
| U. S. Postal service | 0.4% (553) | 0.4% (333) | 0.3% (220) |
| Drugs, sundries, and chemical and allied products merchant wholesalers | 0.4% (540) | 0.3% (248) | 0.5% (292) |
| Truck transportation | 0.4% (512) | 0.6% (438) | 0.1% (74) |
| Apparel | 0.4% (502) | 0.3% (201) | 0.5% (301) |
| Machinery, equipment, and supplies merchant wholesalers | 0.4% (502) | 0.4% (348) | 0.2% (154) |
| Furniture and related product manufacturing | 0.3% (469) | 0.5% (372) | 0.1% (97) |
| Health and personal care, except drug, stores | 0.3% (461) | 0.3% (201) | 0.4% (260) |
| Motor vehicles, parts and supplies merchant wholesalers | 0.3% (450) | 0.5% (361) | 0.1% (89) |
| Food | 0.3% (436) | 0.4% (299) | 0.2% (137) |
| Electronic shopping and mail-order houses | 0.3% (362) | 0.3% (217) | 0.2% (145) |
| Plastics and rubber products | 0.2% (343) | 0.3% (248) | 0.1% (95) |
| Gasoline stations | 0.2% (333) | 0.4% (310) | 0.0% (23) |
| Furniture and home furnishing merchant wholesalers | 0.2% (310) | 0.2% (152) | 0.2% (158) |
| Jewelry, luggage, and leather goods stores | 0.2% (288) | 0.1% (108) | 0.3% (180) |
| Apparel, fabrics, and notions merchant wholesalers | 0.2% (285) | 0.2% (178) | 0.2% (107) |
| Retail florists | 0.2% (262) | 0.1% (95) | 0.3% (167) |
| Electrical equipment, appliances, and components | 0.2% (259) | 0.3% (213) | 0.1% (46) |
| Office supplies and stationery stores | 0.2% (252) | 0.2% (151) | 0.2% (101) |
| Textile mills and textile products | 0.2% (247) | 0.2% (163) | 0.1% (84) |
| Nonmetallic mineral products | 0.2% (245) | 0.2% (183) | 0.1% (62) |
| Agriculture, forestry, fishing and hunting | 0.2% (233) | 0.2% (155) | 0.1% (78) |
| Paper and paper products merchant wholesalers | 0.1% (197) | 0.1% (108) | 0.1% (89) |
| Hardware, plumbing and heating equipment, and supplies merchant wholesalers | 0.1% (189) | 0.2% (153) | 0.1% (36) |
| Paper | 0.1% (174) | 0.1% (108) | 0.1% (66) |
| Music stores | 0.1% (146) | 0.1% (76) | 0.1% (70) |
| Petroleum and coal products | 0.1% (135) | 0.2% (119) | 0.0% (16) |
| Petroleum and petroleum products merchant wholesalers | 0.1% (130) | 0.1% (110) | 0.0% (20) |
| Warehousing and storage | 0.1% (108) | 0.1% (96) | 0.0% (12) |
| Lumber and other construction materials merchant wholesalers | 0.1% (107) | 0.1% (96) | 0.0% (11) |
| Beverage and tobacco products | 0.1% (101) | 0.1% (86) | 0.0% (15) |
| Leather and allied products | 0.1% (99) | 0.1% (83) | 0.0% (16) |
Unemployment in South Coast
- Unemployment by race in 2000
- Unemployment rate for White non-Hispanic residents
- 3.4%Males
- 3.4%Females
- Unemployment rate for Black residents
- 4.9%Males
- 5.9%Females
- Unemployment rate for American Indian and Alaska Native residents
- 1.5%Males
- 15.3%Females
- Unemployment rate for Asian residents
- 5.8%Males
- 2.3%Females
- Unemployment rate for other race residents
- 3.7%Males
- 5.5%Females
- Unemployment rate for two or more race residents
- 4.8%Males
- 5.1%Females
- Unemployment rate for Hispanic or Latino residents
- 4.4%Males
- 5.9%Females
Time leaving home to go to work

<5am:
| South Coast: | 2.1% (3,016) |
| California: | 4.2% (606,086) |
5:30am:
| South Coast: | 2.5% (3,523) |
| California: | 3.6% (523,209) |
6am:
| South Coast: | 3.5% (4,886) |
| California: | 4.8% (692,256) |
6:30am:
| South Coast: | 7.2% (10,150) |
| California: | 8.4% (1,216,867) |
7am:
| South Coast: | 9.7% (13,645) |
| California: | 9.4% (1,362,830) |
7:30am:
| South Coast: | 15.6% (22,054) |
| California: | 13.8% (2,006,950) |
8am:
| South Coast: | 15.1% (21,349) |
| California: | 13.7% (1,986,831) |
8:30am:
| South Coast: | 12.5% (17,691) |
| California: | 10.9% (1,577,815) |
9am:
| South Coast: | 6.2% (8,806) |
| California: | 5.4% (778,152) |
10am:
| South Coast: | 7.6% (10,792) |
| California: | 6.7% (972,355) |
11am:
| South Coast: | 2.9% (4,128) |
| California: | 2.9% (414,479) |
12pm:
| South Coast: | 1.2% (1,661) |
| California: | 1.3% (189,005) |
4pm:
| South Coast: | 3.6% (5,087) |
| California: | 6.0% (865,284) |
>4pm:
| South Coast: | 4.2% (5,893) |
| California: | 5.3% (776,167) |
Travel time to work


Less than 5 minutes:
| South Coast: | 1.8% (2,573) |
| California: | 2.2% (324,703) |
5 to 9 minutes:
| South Coast: | 7.8% (11,092) |
| California: | 8.8% (1,280,443) |
10 to 14 minutes:
| South Coast: | 12.0% (17,015) |
| California: | 13.3% (1,930,263) |
15 to 19 minutes:
| South Coast: | 12.9% (18,248) |
| California: | 14.9% (2,157,970) |
20 to 24 minutes:
| South Coast: | 13.8% (19,560) |
| California: | 13.8% (2,004,060) |
25 to 29 minutes:
| South Coast: | 6.9% (9,817) |
| California: | 5.4% (782,241) |
30 to 34 minutes:
| South Coast: | 14.3% (20,204) |
| California: | 13.9% (2,025,657) |
35 to 39 minutes:
| South Coast: | 3.2% (4,577) |
| California: | 2.5% (366,487) |
40 to 44 minutes:
| South Coast: | 4.2% (5,956) |
| California: | 3.6% (528,043) |
45 to 59 minutes:
| South Coast: | 7.3% (10,361) |
| California: | 7.9% (1,151,598) |
60 to 89 minutes:
| South Coast: | 6.6% (9,317) |
| California: | 6.4% (933,123) |
90 or more minutes:
| South Coast: | 2.8% (3,961) |
| California: | 3.3% (483,698) |
Means of transportation to work


Drove car alone:
| South Coast: | 79.2% (111,907) |
| California: | 71.8% (10,432,462) |
Carpooled:
| South Coast: | 10.5% (14,787) |
| California: | 14.5% (2,113,313) |
Bus or trolley bus:
| South Coast: | 1.0% (1,483) |
| California: | 3.8% (549,425) |
Streetcar or trolley car:
| South Coast: | 0.0% (38) |
| California: | 0.1% (21,158) |
Subway or elevated:
| South Coast: | 0.0% (21) |
| California: | 0.7% (107,711) |
Railroad:
| South Coast: | 0.4% (581) |
| California: | 0.3% (41,022) |
Ferryboat:
| South Coast: | 0.0% (6) |
| California: | 0.0% (6,831) |
Taxicab:
| South Coast: | 0.0% (58) |
| California: | 0.1% (9,890) |
Motorcycle:
| South Coast: | 0.2% (236) |
| California: | 0.2% (36,262) |
Bicycle:
| South Coast: | 0.3% (427) |
| California: | 0.8% (120,567) |
Walked:
| South Coast: | 1.7% (2,438) |
| California: | 2.9% (414,581) |
Other means:
| South Coast: | 0.5% (699) |
| California: | 0.8% (115,064) |
Private vehicle occupancy

Drove alone:
| South Coast: | 88.3% (111,907) |
| California: | 83.2% (10,432,462) |
In 2 person carpool:
| South Coast: | 9.2% (11,709) |
| California: | 12.5% (1,564,905) |
In 3 person carpool:
| South Coast: | 1.4% (1,739) |
| California: | 2.6% (330,732) |
In 4 person carpool:
| South Coast: | 0.5% (690) |
| California: | 1.0% (119,364) |
In 5-6 person carpool:
| South Coast: | 0.2% (302) |
| California: | 0.5% (57,036) |
In 7+ person carpool:
| South Coast: | 0.3% (347) |
| California: | 0.3% (41,276) |
Class of workers

Employee of private company:
| South Coast: | 67.6% (96,934) |
| California: | 68.0% (10,009,465) |
Self-employed in own incorporated business:
| South Coast: | 5.1% (7,303) |
| California: | 2.7% (402,392) |
Private not-for-profit wage and salary workers:
| South Coast: | 4.5% (6,421) |
| California: | 5.7% (845,536) |
Local government workers:
| South Coast: | 5.9% (8,468) |
| California: | 8.3% (1,218,764) |
State government workers:
| South Coast: | 3.1% (4,403) |
| California: | 4.0% (594,953) |
Federal government workers:
| South Coast: | 1.4% (1,963) |
| California: | 2.3% (344,354) |
Self-employed workers in own not incorporated business:
| South Coast: | 12.0% (17,244) |
| California: | 8.5% (1,249,530) |
Unpaid family workers:
| South Coast: | 0.4% (640) |
| California: | 0.4% (53,934) |

Employee of private company - Males:
| South Coast: | 69.0% (54,260) |
| California: | 71.1% (5,716,697) |
Self-employed in own incorporated business - Males:
| South Coast: | 6.9% (5,442) |
| California: | 3.6% (290,657) |
Private not-for-profit wage and salary workers - Males:
| South Coast: | 2.7% (2,106) |
| California: | 3.8% (303,997) |
Local government workers - Males:
| South Coast: | 4.6% (3,616) |
| California: | 6.2% (495,927) |
State government workers - Males:
| South Coast: | 2.0% (1,536) |
| California: | 3.2% (255,434) |
Federal government workers - Males:
| South Coast: | 1.5% (1,201) |
| California: | 2.5% (198,555) |
Self-employed workers in own not incorporated business - Males:
| South Coast: | 13.1% (10,286) |
| California: | 9.5% (760,853) |
Unpaid family workers - Males:
| South Coast: | 0.3% (219) |
| California: | 0.3% (23,230) |

Employee of private company - Females:
| South Coast: | 65.9% (42,674) |
| California: | 64.3% (4,292,768) |
Self-employed in own incorporated business - Females:
| South Coast: | 2.9% (1,861) |
| California: | 1.7% (111,735) |
Private not-for-profit wage and salary workers - Females:
| South Coast: | 6.7% (4,315) |
| California: | 8.1% (541,539) |
Local government workers - Females:
| South Coast: | 7.5% (4,852) |
| California: | 10.8% (722,837) |
State government workers - Females:
| South Coast: | 4.4% (2,867) |
| California: | 5.1% (339,519) |
Federal government workers - Females:
| South Coast: | 1.2% (762) |
| California: | 2.2% (145,799) |
Self-employed workers in own not incorporated business - Females:
| South Coast: | 10.8% (6,958) |
| California: | 7.3% (488,677) |
Unpaid family workers - Females:
| South Coast: | 0.7% (421) |
| California: | 0.5% (30,704) |