Work and Jobs in South Coastside, California (CA) Detailed Stats
Occupations, Industries, Unemployment, Workers, Commute
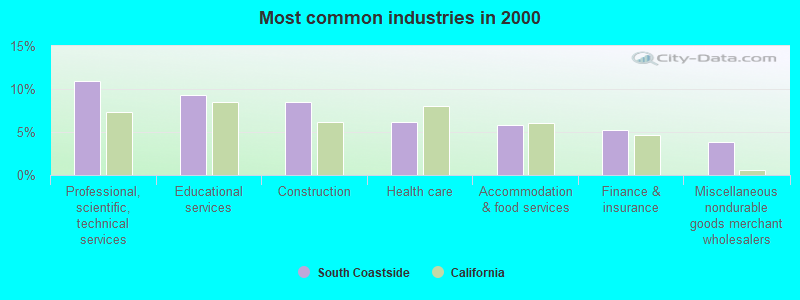
The most common industries in South Coastside are: Professional, scientific, technical services (10.9% of civilian employees), Educational services (9.3% of civilian employees), Construction (8.4% of civilian employees). 65.0% of workers are employees of private companies, which is 4.7% less than the rate of 68.0% across the entire state of California.
Most common industries
Most common industries | |||
|---|---|---|---|
Industry | All | Males | Females |
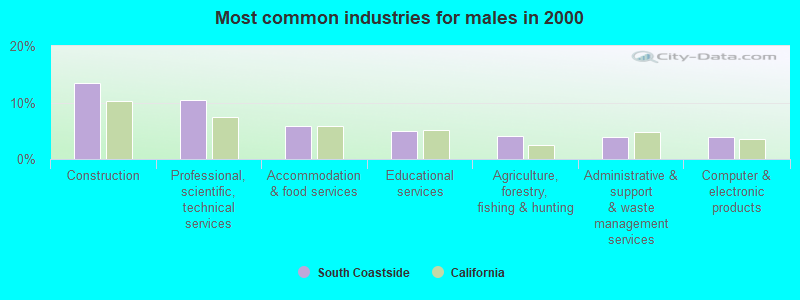
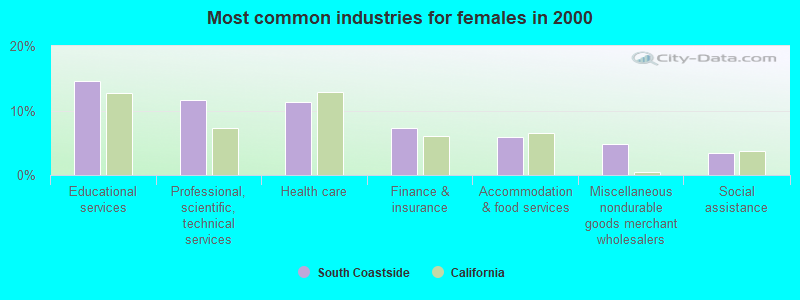
| Professional, scientific, and technical services | 10.9% (1,696) | 10.4% (901) | 11.6% (795) |
| Educational services | 9.3% (1,441) | 5.0% (435) | 14.6% (1,006) |
| Construction | 8.4% (1,309) | 13.5% (1,162) | 2.1% (147) |
| Health care | 6.2% (958) | 2.1% (180) | 11.3% (778) |
| Accommodation and food services | 5.9% (909) | 5.8% (505) | 5.9% (404) |
| Finance and insurance | 5.2% (803) | 3.5% (306) | 7.2% (497) |
| Miscellaneous nondurable goods merchant wholesalers | 3.8% (587) | 3.0% (262) | 4.7% (325) |
| Administrative and support and waste management services | 3.3% (512) | 4.0% (343) | 2.5% (169) |
| Public administration | 3.0% (466) | 3.5% (299) | 2.4% (167) |
| Agriculture, forestry, fishing and hunting | 2.9% (455) | 4.1% (354) | 1.5% (101) |
| Computer and electronic products | 2.9% (447) | 3.8% (330) | 1.7% (117) |
| Arts, entertainment, and recreation | 2.5% (388) | 2.7% (232) | 2.3% (156) |
| Air transportation | 2.2% (340) | 2.8% (244) | 1.4% (96) |
| Real estate and rental and leasing | 2.1% (328) | 1.4% (122) | 3.0% (206) |
| Data processing, libraries, and other information services | 1.6% (249) | 1.8% (153) | 1.4% (96) |
| Food and beverage stores | 1.6% (248) | 1.3% (113) | 2.0% (135) |
| Social assistance | 1.6% (248) | 0.2% (15) | 3.4% (233) |
| Broadcasting and telecommunications | 1.4% (223) | 1.9% (166) | 0.8% (57) |
| Radio, TV, and computer stores | 1.4% (216) | 1.6% (135) | 1.2% (81) |
| Chemicals | 1.4% (210) | 1.5% (128) | 1.2% (82) |
| Personal and laundry services | 1.3% (206) | 0.9% (78) | 1.9% (128) |
| Repair and maintenance | 1.3% (204) | 2.1% (183) | 0.3% (21) |
| Publishing, and motion picture and sound recording industries | 1.2% (190) | 1.2% (104) | 1.3% (86) |
| Miscellaneous manufacturing | 1.1% (177) | 1.4% (123) | 0.8% (54) |
| Religious, grantmaking, civic, professional, and similar organizations | 1.0% (162) | 0.9% (81) | 1.2% (81) |
| Utilities | 1.0% (155) | 1.2% (107) | 0.7% (48) |
| Building material and garden equipment and supplies dealers | 0.9% (142) | 1.1% (97) | 0.7% (45) |
| Truck transportation | 0.8% (128) | 1.0% (90) | 0.6% (38) |
| Other transportation, and support activities, and couriers | 0.8% (117) | 1.4% (117) | 0.0% (0) |
| Private households | 0.7% (114) | 0.1% (8) | 1.5% (106) |
| Groceries and related products merchant wholesalers | 0.6% (90) | 0.7% (64) | 0.4% (26) |
| Professional and commercial equipment and supplies merchant wholesalers | 0.5% (81) | 0.6% (48) | 0.5% (33) |
| Department and other general merchandise stores | 0.5% (80) | 0.5% (44) | 0.5% (36) |
| U. S. Postal service | 0.5% (80) | 0.5% (46) | 0.5% (34) |
| Sporting goods, camera, and hobby and toy stores | 0.5% (76) | 0.8% (70) | 0.1% (6) |
| Furniture and home furnishings, and household appliance stores | 0.5% (76) | 0.3% (28) | 0.7% (48) |
| Electrical and electronic goods merchant wholesalers | 0.5% (75) | 0.9% (75) | 0.0% (0) |
| Used merchandise, gift, novelty, and souvenir, and other miscellaneous stores | 0.5% (74) | 0.2% (14) | 0.9% (60) |
| Electronic shopping and mail-order houses | 0.5% (74) | 0.5% (43) | 0.5% (31) |
| Other direct selling establishments | 0.5% (71) | 0.5% (45) | 0.4% (26) |
| Food | 0.4% (69) | 0.3% (27) | 0.6% (42) |
| Clothing and accessories, including shoe, stores | 0.4% (69) | 0.5% (45) | 0.3% (24) |
| Furniture and related product manufacturing | 0.4% (68) | 0.6% (52) | 0.2% (16) |
| Nonmetallic mineral products | 0.4% (66) | 0.6% (51) | 0.2% (15) |
| Metal and metal products | 0.4% (66) | 0.8% (66) | 0.0% (0) |
| Transportation equipment | 0.4% (60) | 0.6% (50) | 0.1% (10) |
| Music stores | 0.4% (55) | 0.2% (13) | 0.6% (42) |
| Electrical equipment, appliances, and components | 0.3% (51) | 0.6% (51) | 0.0% (0) |
| Printing and related support activities | 0.3% (45) | 0.3% (23) | 0.3% (22) |
| Alcoholic beverages merchant wholesalers | 0.3% (44) | 0.5% (44) | 0.0% (0) |
| Apparel | 0.2% (36) | 0.3% (30) | 0.1% (6) |
| Pharmacies and drug stores | 0.2% (35) | 0.2% (17) | 0.3% (18) |
| Office supplies and stationery stores | 0.2% (34) | 0.3% (27) | 0.1% (7) |
| Book stores and news dealers | 0.2% (34) | 0.2% (21) | 0.2% (13) |
| Motor vehicle and parts dealers | 0.2% (33) | 0.4% (33) | 0.0% (0) |
| Miscellaneous durable goods merchant wholesalers | 0.2% (28) | 0.1% (8) | 0.3% (20) |
| Wood products | 0.2% (27) | 0.3% (27) | 0.0% (0) |
| Drugs, sundries, and chemical and allied products merchant wholesalers | 0.2% (26) | 0.1% (8) | 0.3% (18) |
| Beverage and tobacco products | 0.1% (23) | 0.2% (17) | 0.1% (6) |
| Plastics and rubber products | 0.1% (23) | 0.3% (23) | 0.0% (0) |
| Machinery | 0.1% (21) | 0.2% (21) | 0.0% (0) |
| Management of companies and enterprises | 0.1% (19) | 0.1% (10) | 0.1% (9) |
| Farm supplies merchant wholesalers | 0.1% (18) | 0.2% (18) | 0.0% (0) |
| Warehousing and storage | 0.1% (18) | 0.1% (8) | 0.1% (10) |
| Gasoline stations | 0.1% (16) | 0.2% (16) | 0.0% (0) |
| Retail florists | 0.1% (15) | 0.1% (11) | 0.1% (4) |
| Paper and paper products merchant wholesalers | 0.1% (15) | 0.2% (15) | 0.0% (0) |
| Furniture and home furnishing merchant wholesalers | 0.1% (14) | 0.2% (14) | 0.0% (0) |
| Jewelry, luggage, and leather goods stores | 0.1% (11) | 0.1% (11) | 0.0% (0) |
| Machinery, equipment, and supplies merchant wholesalers | 0.1% (10) | 0.1% (10) | 0.0% (0) |
Unemployment in South Coastside
- Unemployment by race in 2000
- Unemployment rate for White non-Hispanic residents
- 2.2%Males
- 1.4%Females
- Unemployment rate for other race residents
- 5.0%Males
- 14.4%Females
- Unemployment rate for two or more race residents
- 8.3%Males
- 1.7%Females
- Unemployment rate for Hispanic or Latino residents
- 14.5%Males
- 13.9%Females
Time leaving home to go to work

<5am:
| South Coastside: | 3.6% (546) |
| California: | 4.2% (606,086) |
5:30am:
| South Coastside: | 2.8% (430) |
| California: | 3.6% (523,209) |
6am:
| South Coastside: | 3.0% (452) |
| California: | 4.8% (692,256) |
6:30am:
| South Coastside: | 8.4% (1,273) |
| California: | 8.4% (1,216,867) |
7am:
| South Coastside: | 11.6% (1,753) |
| California: | 9.4% (1,362,830) |
7:30am:
| South Coastside: | 18.3% (2,779) |
| California: | 13.8% (2,006,950) |
8am:
| South Coastside: | 11.6% (1,758) |
| California: | 13.7% (1,986,831) |
8:30am:
| South Coastside: | 9.7% (1,466) |
| California: | 10.9% (1,577,815) |
9am:
| South Coastside: | 4.4% (674) |
| California: | 5.4% (778,152) |
10am:
| South Coastside: | 8.0% (1,211) |
| California: | 6.7% (972,355) |
11am:
| South Coastside: | 2.7% (413) |
| California: | 2.9% (414,479) |
12pm:
| South Coastside: | 1.3% (199) |
| California: | 1.3% (189,005) |
4pm:
| South Coastside: | 4.3% (654) |
| California: | 6.0% (865,284) |
>4pm:
| South Coastside: | 3.3% (507) |
| California: | 5.3% (776,167) |
Travel time to work


Less than 5 minutes:
| South Coastside: | 4.2% (637) |
| California: | 2.2% (324,703) |
5 to 9 minutes:
| South Coastside: | 10.2% (1,553) |
| California: | 8.8% (1,280,443) |
10 to 14 minutes:
| South Coastside: | 8.4% (1,266) |
| California: | 13.3% (1,930,263) |
15 to 19 minutes:
| South Coastside: | 6.1% (919) |
| California: | 14.9% (2,157,970) |
20 to 24 minutes:
| South Coastside: | 5.7% (871) |
| California: | 13.8% (2,004,060) |
25 to 29 minutes:
| South Coastside: | 3.8% (574) |
| California: | 5.4% (782,241) |
30 to 34 minutes:
| South Coastside: | 14.2% (2,145) |
| California: | 13.9% (2,025,657) |
35 to 39 minutes:
| South Coastside: | 4.7% (715) |
| California: | 2.5% (366,487) |
40 to 44 minutes:
| South Coastside: | 8.2% (1,241) |
| California: | 3.6% (528,043) |
45 to 59 minutes:
| South Coastside: | 16.0% (2,425) |
| California: | 7.9% (1,151,598) |
60 to 89 minutes:
| South Coastside: | 9.8% (1,478) |
| California: | 6.4% (933,123) |
90 or more minutes:
| South Coastside: | 1.9% (291) |
| California: | 3.3% (483,698) |
Means of transportation to work


Drove car alone:
| South Coastside: | 73.6% (11,154) |
| California: | 71.8% (10,432,462) |
Carpooled:
| South Coastside: | 12.7% (1,932) |
| California: | 14.5% (2,113,313) |
Bus or trolley bus:
| South Coastside: | 1.1% (173) |
| California: | 3.8% (549,425) |
Streetcar or trolley car:
| South Coastside: | 0.1% (10) |
| California: | 0.1% (21,158) |
Subway or elevated:
| South Coastside: | 0.8% (123) |
| California: | 0.7% (107,711) |
Railroad:
| South Coastside: | 0.2% (23) |
| California: | 0.3% (41,022) |
Motorcycle:
| South Coastside: | 0.2% (32) |
| California: | 0.2% (36,262) |
Bicycle:
| South Coastside: | 0.8% (128) |
| California: | 0.8% (120,567) |
Walked:
| South Coastside: | 3.2% (480) |
| California: | 2.9% (414,581) |
Other means:
| South Coastside: | 0.4% (60) |
| California: | 0.8% (115,064) |
Private vehicle occupancy

Drove alone:
| South Coastside: | 85.2% (11,154) |
| California: | 83.2% (10,432,462) |
In 2 person carpool:
| South Coastside: | 10.8% (1,408) |
| California: | 12.5% (1,564,905) |
In 3 person carpool:
| South Coastside: | 2.3% (301) |
| California: | 2.6% (330,732) |
In 4 person carpool:
| South Coastside: | 0.5% (64) |
| California: | 1.0% (119,364) |
In 5-6 person carpool:
| South Coastside: | 0.6% (73) |
| California: | 0.5% (57,036) |
In 7+ person carpool:
| South Coastside: | 0.7% (86) |
| California: | 0.3% (41,276) |
Class of workers

Employee of private company:
| South Coastside: | 65.0% (10,074) |
| California: | 68.0% (10,009,465) |
Self-employed in own incorporated business:
| South Coastside: | 3.6% (554) |
| California: | 2.7% (402,392) |
Private not-for-profit wage and salary workers:
| South Coastside: | 6.6% (1,029) |
| California: | 5.7% (845,536) |
Local government workers:
| South Coastside: | 8.3% (1,279) |
| California: | 8.3% (1,218,764) |
State government workers:
| South Coastside: | 3.1% (477) |
| California: | 4.0% (594,953) |
Federal government workers:
| South Coastside: | 1.5% (240) |
| California: | 2.3% (344,354) |
Self-employed workers in own not incorporated business:
| South Coastside: | 11.8% (1,823) |
| California: | 8.5% (1,249,530) |
Unpaid family workers:
| South Coastside: | 0.2% (27) |
| California: | 0.4% (53,934) |

Employee of private company - Males:
| South Coastside: | 69.8% (6,026) |
| California: | 71.1% (5,716,697) |
Self-employed in own incorporated business - Males:
| South Coastside: | 4.4% (380) |
| California: | 3.6% (290,657) |
Private not-for-profit wage and salary workers - Males:
| South Coastside: | 4.1% (357) |
| California: | 3.8% (303,997) |
Local government workers - Males:
| South Coastside: | 6.8% (589) |
| California: | 6.2% (495,927) |
State government workers - Males:
| South Coastside: | 1.7% (149) |
| California: | 3.2% (255,434) |
Federal government workers - Males:
| South Coastside: | 1.6% (136) |
| California: | 2.5% (198,555) |
Self-employed workers in own not incorporated business - Males:
| South Coastside: | 11.4% (986) |
| California: | 9.5% (760,853) |
Unpaid family workers - Males:
| South Coastside: | 0.1% (12) |
| California: | 0.3% (23,230) |

Employee of private company - Females:
| South Coastside: | 58.9% (4,048) |
| California: | 64.3% (4,292,768) |
Self-employed in own incorporated business - Females:
| South Coastside: | 2.5% (174) |
| California: | 1.7% (111,735) |
Private not-for-profit wage and salary workers - Females:
| South Coastside: | 9.8% (672) |
| California: | 8.1% (541,539) |
Local government workers - Females:
| South Coastside: | 10.0% (690) |
| California: | 10.8% (722,837) |
State government workers - Females:
| South Coastside: | 4.8% (328) |
| California: | 5.1% (339,519) |
Federal government workers - Females:
| South Coastside: | 1.5% (104) |
| California: | 2.2% (145,799) |
Self-employed workers in own not incorporated business - Females:
| South Coastside: | 12.2% (837) |
| California: | 7.3% (488,677) |
Unpaid family workers - Females:
| South Coastside: | 0.2% (15) |
| California: | 0.5% (30,704) |