Work and Jobs in Southeast Harris, Texas (TX) Detailed Stats
Occupations, Industries, Unemployment, Workers, Commute
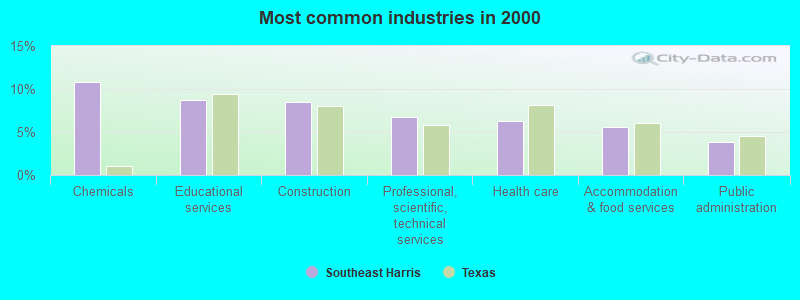
The most common industries in Southeast Harris are: Chemicals (10.8% of civilian employees), Educational services (8.7% of civilian employees), Construction (8.5% of civilian employees). 76.3% of workers are employees of private companies, which is 8.8% greater than the rate of 69.6% across the entire state of Texas.
Most common industries
Most common industries | |||
|---|---|---|---|
Industry | All | Males | Females |
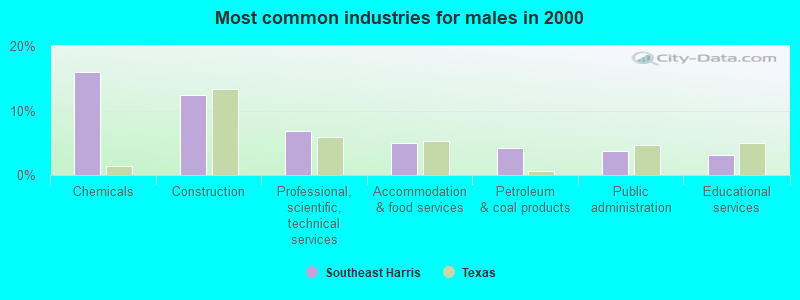
| Chemicals | 10.8% (4,498) | 15.9% (3,688) | 4.4% (810) |
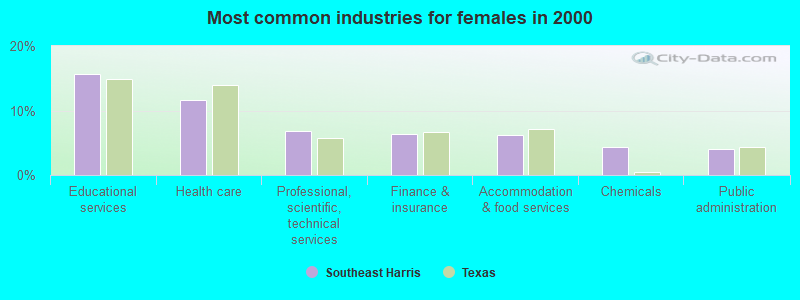
| Educational services | 8.7% (3,627) | 3.2% (736) | 15.7% (2,891) |
| Construction | 8.5% (3,532) | 12.4% (2,883) | 3.5% (649) |
| Professional, scientific, and technical services | 6.8% (2,824) | 6.8% (1,572) | 6.8% (1,252) |
| Health care | 6.3% (2,599) | 2.0% (470) | 11.6% (2,129) |
| Accommodation and food services | 5.6% (2,311) | 5.0% (1,163) | 6.2% (1,148) |
| Public administration | 3.9% (1,605) | 3.7% (851) | 4.1% (754) |
| Finance and insurance | 3.7% (1,523) | 1.5% (358) | 6.3% (1,165) |
| Petroleum and coal products | 3.0% (1,246) | 4.2% (966) | 1.5% (280) |
| Administrative and support and waste management services | 2.9% (1,201) | 2.9% (671) | 2.9% (530) |
| Real estate and rental and leasing | 2.0% (848) | 1.9% (449) | 2.2% (399) |
| Other transportation, and support activities, and couriers | 2.0% (829) | 2.2% (508) | 1.7% (321) |
| Repair and maintenance | 1.9% (803) | 2.8% (640) | 0.9% (163) |
| Motor vehicle and parts dealers | 1.9% (802) | 2.3% (531) | 1.5% (271) |
| Food and beverage stores | 1.8% (768) | 1.4% (334) | 2.4% (434) |
| Metal and metal products | 1.7% (705) | 2.4% (556) | 0.8% (149) |
| Utilities | 1.5% (642) | 2.2% (507) | 0.7% (135) |
| Truck transportation | 1.5% (617) | 1.9% (440) | 1.0% (177) |
| Religious, grantmaking, civic, professional, and similar organizations | 1.3% (548) | 0.8% (189) | 2.0% (359) |
| Transportation equipment | 1.3% (527) | 1.8% (421) | 0.6% (106) |
| Machinery | 1.3% (521) | 1.5% (358) | 0.9% (163) |
| Mining, quarrying, and oil and gas extraction | 1.2% (491) | 1.4% (327) | 0.9% (164) |
| Plastics and rubber products | 1.1% (477) | 1.6% (364) | 0.6% (113) |
| Arts, entertainment, and recreation | 1.1% (448) | 1.1% (248) | 1.1% (200) |
| Miscellaneous manufacturing | 1.0% (414) | 1.2% (278) | 0.7% (136) |
| Machinery, equipment, and supplies merchant wholesalers | 1.0% (402) | 1.0% (242) | 0.9% (160) |
| Personal and laundry services | 0.9% (361) | 0.2% (57) | 1.7% (304) |
| Social assistance | 0.9% (354) | 0.1% (22) | 1.8% (332) |
| Building material and garden equipment and supplies dealers | 0.8% (337) | 1.0% (223) | 0.6% (114) |
| Broadcasting and telecommunications | 0.8% (327) | 1.0% (223) | 0.6% (104) |
| Computer and electronic products | 0.8% (326) | 0.9% (218) | 0.6% (108) |
| Department and other general merchandise stores | 0.7% (302) | 0.4% (89) | 1.2% (213) |
| Electrical and electronic goods merchant wholesalers | 0.7% (273) | 0.7% (154) | 0.6% (119) |
| U. S. Postal service | 0.6% (260) | 0.7% (159) | 0.5% (101) |
| Pharmacies and drug stores | 0.5% (213) | 0.3% (74) | 0.8% (139) |
| Air transportation | 0.5% (213) | 0.6% (138) | 0.4% (75) |
| Used merchandise, gift, novelty, and souvenir, and other miscellaneous stores | 0.4% (187) | 0.3% (63) | 0.7% (124) |
| Warehousing and storage | 0.4% (182) | 0.6% (130) | 0.3% (52) |
| Drugs, sundries, and chemical and allied products merchant wholesalers | 0.4% (164) | 0.7% (154) | 0.1% (10) |
| Furniture and home furnishings, and household appliance stores | 0.4% (152) | 0.3% (72) | 0.4% (80) |
| Petroleum and petroleum products merchant wholesalers | 0.4% (150) | 0.4% (100) | 0.3% (50) |
| Radio, TV, and computer stores | 0.4% (147) | 0.5% (108) | 0.2% (39) |
| Clothing and accessories, including shoe, stores | 0.4% (146) | 0.1% (27) | 0.6% (119) |
| Electrical equipment, appliances, and components | 0.3% (144) | 0.4% (98) | 0.3% (46) |
| Other direct selling establishments | 0.3% (131) | 0.3% (79) | 0.3% (52) |
| Miscellaneous durable goods merchant wholesalers | 0.3% (121) | 0.4% (84) | 0.2% (37) |
| Groceries and related products merchant wholesalers | 0.3% (119) | 0.2% (56) | 0.3% (63) |
| Paper | 0.3% (118) | 0.5% (106) | 0.1% (12) |
| Publishing, and motion picture and sound recording industries | 0.3% (117) | 0.2% (49) | 0.4% (68) |
| Sporting goods, camera, and hobby and toy stores | 0.3% (117) | 0.3% (66) | 0.3% (51) |
| Data processing, libraries, and other information services | 0.3% (117) | 0.1% (25) | 0.5% (92) |
| Food | 0.3% (116) | 0.4% (84) | 0.2% (32) |
| Metals and minerals, except petroleum, merchant wholesalers | 0.3% (116) | 0.2% (39) | 0.4% (77) |
| Private households | 0.3% (108) | 0.0% (0) | 0.6% (108) |
| Rail transportation | 0.3% (105) | 0.4% (95) | 0.1% (10) |
| Professional and commercial equipment and supplies merchant wholesalers | 0.2% (92) | 0.2% (55) | 0.2% (37) |
| Retail florists | 0.2% (86) | 0.1% (22) | 0.3% (64) |
| Gasoline stations | 0.2% (84) | 0.2% (36) | 0.3% (48) |
| Miscellaneous nondurable goods merchant wholesalers | 0.2% (82) | 0.3% (73) | 0.0% (9) |
| Nonmetallic mineral products | 0.2% (72) | 0.3% (58) | 0.1% (14) |
| Office supplies and stationery stores | 0.2% (66) | 0.1% (33) | 0.2% (33) |
| Hardware, plumbing and heating equipment, and supplies merchant wholesalers | 0.1% (60) | 0.2% (39) | 0.1% (21) |
| Printing and related support activities | 0.1% (58) | 0.1% (21) | 0.2% (37) |
| Beverage and tobacco products | 0.1% (57) | 0.2% (38) | 0.1% (19) |
| Agriculture, forestry, fishing and hunting | 0.1% (55) | 0.2% (44) | 0.1% (11) |
| Jewelry, luggage, and leather goods stores | 0.1% (54) | 0.0% (11) | 0.2% (43) |
| Water transportation | 0.1% (51) | 0.2% (42) | 0.0% (9) |
| Textile mills and textile products | 0.1% (49) | 0.1% (29) | 0.1% (20) |
| Alcoholic beverages merchant wholesalers | 0.1% (42) | 0.1% (30) | 0.1% (12) |
| Motor vehicles, parts and supplies merchant wholesalers | 0.1% (32) | 0.1% (24) | 0.0% (8) |
Unemployment in Southeast Harris
- Unemployment by race in 2000
- Unemployment rate for White non-Hispanic residents
- 4.0%Males
- 4.5%Females
- Unemployment rate for Black residents
- 21.3%Males
- 10.6%Females
- Unemployment rate for American Indian and Alaska Native residents
- 6.6%Males
- 6.0%Females
- Unemployment rate for other race residents
- 4.2%Males
- 8.0%Females
- Unemployment rate for two or more race residents
- 3.2%Males
- 9.0%Females
- Unemployment rate for Hispanic or Latino residents
- 5.5%Males
- 6.3%Females
Time leaving home to go to work

<5am:
| Southeast Harris: | 4.4% (1,816) |
| Texas: | 3.1% (281,361) |
5:30am:
| Southeast Harris: | 5.0% (2,041) |
| Texas: | 2.9% (262,060) |
6am:
| Southeast Harris: | 5.5% (2,237) |
| Texas: | 4.4% (403,423) |
6:30am:
| Southeast Harris: | 11.6% (4,742) |
| Texas: | 8.8% (808,876) |
7am:
| Southeast Harris: | 13.9% (5,688) |
| Texas: | 10.7% (976,557) |
7:30am:
| Southeast Harris: | 15.9% (6,501) |
| Texas: | 16.4% (1,500,904) |
8am:
| Southeast Harris: | 15.1% (6,177) |
| Texas: | 16.8% (1,536,308) |
8:30am:
| Southeast Harris: | 7.3% (2,992) |
| Texas: | 10.0% (913,601) |
9am:
| Southeast Harris: | 3.3% (1,352) |
| Texas: | 4.4% (398,656) |
10am:
| Southeast Harris: | 3.8% (1,563) |
| Texas: | 5.2% (472,592) |
11am:
| Southeast Harris: | 1.8% (730) |
| Texas: | 2.2% (197,844) |
12pm:
| Southeast Harris: | 0.6% (261) |
| Texas: | 0.9% (86,997) |
4pm:
| Southeast Harris: | 4.2% (1,721) |
| Texas: | 5.5% (503,565) |
>4pm:
| Southeast Harris: | 6.0% (2,442) |
| Texas: | 6.1% (563,107) |
Travel time to work


Less than 5 minutes:
| Southeast Harris: | 2.7% (1,087) |
| Texas: | 3.0% (277,642) |
5 to 9 minutes:
| Southeast Harris: | 10.5% (4,322) |
| Texas: | 10.3% (942,891) |
10 to 14 minutes:
| Southeast Harris: | 14.8% (6,051) |
| Texas: | 14.4% (1,317,555) |
15 to 19 minutes:
| Southeast Harris: | 17.2% (7,064) |
| Texas: | 16.0% (1,467,945) |
20 to 24 minutes:
| Southeast Harris: | 14.0% (5,751) |
| Texas: | 13.9% (1,276,781) |
25 to 29 minutes:
| Southeast Harris: | 5.8% (2,366) |
| Texas: | 5.3% (482,838) |
30 to 34 minutes:
| Southeast Harris: | 13.3% (5,462) |
| Texas: | 14.3% (1,309,699) |
35 to 39 minutes:
| Southeast Harris: | 2.3% (953) |
| Texas: | 2.4% (219,873) |
40 to 44 minutes:
| Southeast Harris: | 3.4% (1,393) |
| Texas: | 3.1% (280,916) |
45 to 59 minutes:
| Southeast Harris: | 8.2% (3,357) |
| Texas: | 7.6% (692,006) |
60 to 89 minutes:
| Southeast Harris: | 4.9% (2,000) |
| Texas: | 4.6% (418,905) |
90 or more minutes:
| Southeast Harris: | 1.1% (457) |
| Texas: | 2.4% (218,800) |
Means of transportation to work


Drove car alone:
| Southeast Harris: | 85.6% (35,123) |
| Texas: | 77.7% (7,115,590) |
Carpooled:
| Southeast Harris: | 9.8% (3,999) |
| Texas: | 14.5% (1,326,012) |
Bus or trolley bus:
| Southeast Harris: | 0.4% (157) |
| Texas: | 1.7% (157,014) |
Subway or elevated:
| Southeast Harris: | 0.0% (5) |
| Texas: | 0.0% (2,371) |
Railroad:
| Southeast Harris: | 0.0% (14) |
| Texas: | 0.0% (2,374) |
Ferryboat:
| Southeast Harris: | 0.1% (22) |
| Texas: | 0.0% (738) |
Taxicab:
| Southeast Harris: | 0.0% (5) |
| Texas: | 0.1% (6,102) |
Motorcycle:
| Southeast Harris: | 0.5% (186) |
| Texas: | 0.1% (12,068) |
Bicycle:
| Southeast Harris: | 0.3% (114) |
| Texas: | 0.2% (21,551) |
Walked:
| Southeast Harris: | 1.0% (423) |
| Texas: | 1.9% (173,670) |
Other means:
| Southeast Harris: | 0.5% (215) |
| Texas: | 0.9% (86,692) |
Private vehicle occupancy

Drove alone:
| Southeast Harris: | 89.8% (35,123) |
| Texas: | 84.3% (7,115,590) |
In 2 person carpool:
| Southeast Harris: | 8.4% (3,279) |
| Texas: | 11.6% (982,994) |
In 3 person carpool:
| Southeast Harris: | 1.3% (494) |
| Texas: | 2.4% (201,602) |
In 4 person carpool:
| Southeast Harris: | 0.2% (97) |
| Texas: | 1.0% (83,518) |
In 5-6 person carpool:
| Southeast Harris: | 0.2% (84) |
| Texas: | 0.5% (40,662) |
In 7+ person carpool:
| Southeast Harris: | 0.1% (45) |
| Texas: | 0.2% (17,236) |
Class of workers
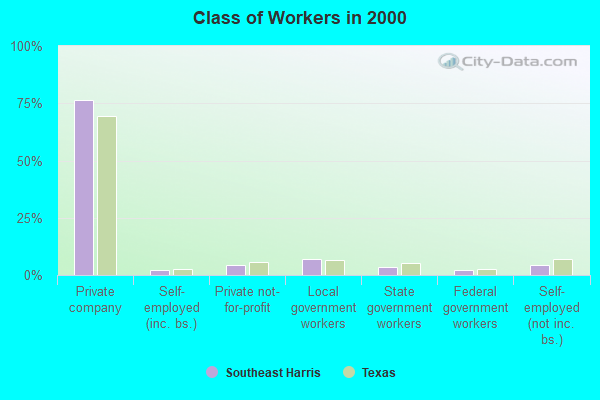
Employee of private company:
| Southeast Harris: | 76.3% (31,736) |
| Texas: | 69.6% (6,425,274) |
Self-employed in own incorporated business:
| Southeast Harris: | 2.1% (855) |
| Texas: | 2.7% (250,864) |
Private not-for-profit wage and salary workers:
| Southeast Harris: | 4.3% (1,791) |
| Texas: | 5.7% (526,631) |
Local government workers:
| Southeast Harris: | 7.1% (2,945) |
| Texas: | 6.6% (608,479) |
State government workers:
| Southeast Harris: | 3.6% (1,489) |
| Texas: | 5.4% (501,082) |
Federal government workers:
| Southeast Harris: | 2.3% (944) |
| Texas: | 2.6% (237,177) |
Self-employed workers in own not incorporated business:
| Southeast Harris: | 4.2% (1,746) |
| Texas: | 7.1% (653,527) |
Unpaid family workers:
| Southeast Harris: | 0.2% (74) |
| Texas: | 0.3% (31,338) |

Employee of private company - Males:
| Southeast Harris: | 81.9% (19,000) |
| Texas: | 72.7% (3,684,731) |
Self-employed in own incorporated business - Males:
| Southeast Harris: | 2.7% (627) |
| Texas: | 3.6% (183,838) |
Private not-for-profit wage and salary workers - Males:
| Southeast Harris: | 1.8% (425) |
| Texas: | 3.4% (173,484) |
Local government workers - Males:
| Southeast Harris: | 4.9% (1,147) |
| Texas: | 5.1% (260,804) |
State government workers - Males:
| Southeast Harris: | 1.8% (425) |
| Texas: | 3.8% (190,371) |
Federal government workers - Males:
| Southeast Harris: | 2.1% (496) |
| Texas: | 2.6% (133,009) |
Self-employed workers in own not incorporated business - Males:
| Southeast Harris: | 4.5% (1,052) |
| Texas: | 8.4% (428,111) |
Unpaid family workers - Males:
| Southeast Harris: | 0.1% (25) |
| Texas: | 0.3% (14,338) |

Employee of private company - Females:
| Southeast Harris: | 69.3% (12,736) |
| Texas: | 65.8% (2,740,543) |
Self-employed in own incorporated business - Females:
| Southeast Harris: | 1.2% (228) |
| Texas: | 1.6% (67,026) |
Private not-for-profit wage and salary workers - Females:
| Southeast Harris: | 7.4% (1,366) |
| Texas: | 8.5% (353,147) |
Local government workers - Females:
| Southeast Harris: | 9.8% (1,798) |
| Texas: | 8.3% (347,675) |
State government workers - Females:
| Southeast Harris: | 5.8% (1,064) |
| Texas: | 7.5% (310,711) |
Federal government workers - Females:
| Southeast Harris: | 2.4% (448) |
| Texas: | 2.5% (104,168) |
Self-employed workers in own not incorporated business - Females:
| Southeast Harris: | 3.8% (694) |
| Texas: | 5.4% (225,416) |
Unpaid family workers - Females:
| Southeast Harris: | 0.3% (49) |
| Texas: | 0.4% (17,000) |