Work and Jobs in Springfield, Pennsylvania (PA) Detailed Stats
Occupations, Industries, Unemployment, Workers, Commute

Recent posts about work in Springfield, Pennsylvania on our local forum with over 2,400,000 registered users:

Latest news about work in Springfield, PA collected exclusively by city-data.com from local newspapers, TV, and radio stations
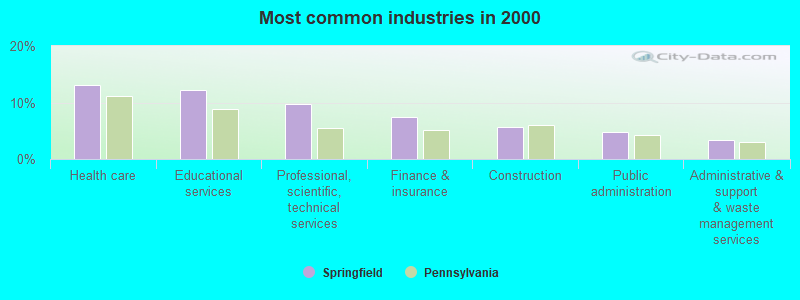
The most common industries in Springfield are: Health care (13.1% of civilian employees), Educational services (12.2% of civilian employees), Professional, scientific, technical services (9.7% of civilian employees). 65.3% of workers are employees of private companies, which is 6.8% less than the rate of 69.7% across the entire state of Pennsylvania.
Most common industries
Most common industries | |||
|---|---|---|---|
Industry | All | Males | Females |
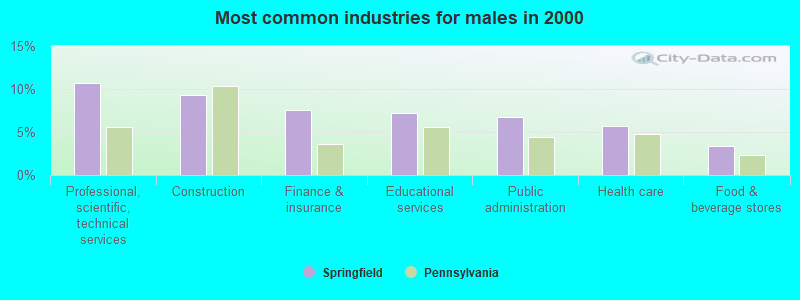
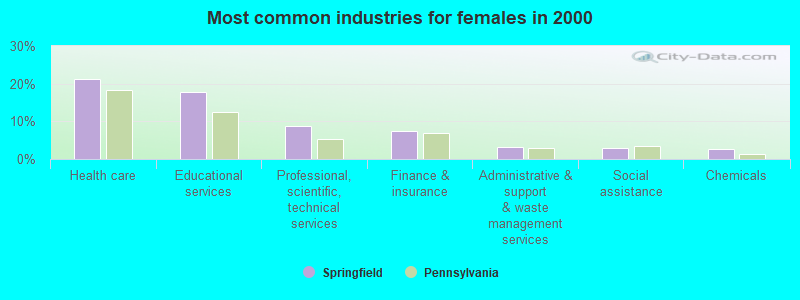
| Health care | 13.1% (1,482) | 5.7% (341) | 21.2% (1,141) |
| Educational services | 12.2% (1,376) | 7.2% (425) | 17.7% (951) |
| Professional, scientific, and technical services | 9.7% (1,099) | 10.7% (633) | 8.7% (466) |
| Finance and insurance | 7.4% (841) | 7.5% (446) | 7.4% (395) |
| Construction | 5.6% (637) | 9.3% (555) | 1.5% (82) |
| Public administration | 4.7% (534) | 6.7% (398) | 2.5% (136) |
| Administrative and support and waste management services | 3.3% (374) | 3.3% (196) | 3.3% (178) |
| Food and beverage stores | 2.7% (300) | 3.4% (200) | 1.9% (100) |
| Accommodation and food services | 2.4% (267) | 2.5% (149) | 2.2% (118) |
| Chemicals | 2.3% (257) | 2.0% (117) | 2.6% (140) |
| Miscellaneous manufacturing | 1.8% (198) | 2.3% (139) | 1.1% (59) |
| Social assistance | 1.7% (189) | 0.6% (37) | 2.8% (152) |
| Religious, grantmaking, civic, professional, and similar organizations | 1.6% (185) | 1.3% (77) | 2.0% (108) |
| Publishing, and motion picture and sound recording industries | 1.6% (185) | 2.2% (132) | 1.0% (53) |
| Broadcasting and telecommunications | 1.6% (183) | 2.1% (126) | 1.1% (57) |
| Real estate and rental and leasing | 1.6% (177) | 1.3% (77) | 1.9% (100) |
| Repair and maintenance | 1.4% (154) | 2.4% (140) | 0.3% (14) |
| Transportation equipment | 1.4% (153) | 2.5% (146) | 0.1% (7) |
| Arts, entertainment, and recreation | 1.3% (150) | 1.4% (81) | 1.3% (69) |
| Department and other general merchandise stores | 1.3% (149) | 0.7% (41) | 2.0% (108) |
| Other transportation, and support activities, and couriers | 1.3% (145) | 2.0% (117) | 0.5% (28) |
| Personal and laundry services | 1.1% (127) | 0.4% (24) | 1.9% (103) |
| Utilities | 1.0% (118) | 1.6% (98) | 0.4% (20) |
| Pharmacies and drug stores | 1.0% (115) | 0.8% (48) | 1.2% (67) |
| Clothing and accessories, including shoe, stores | 0.9% (103) | 0.2% (9) | 1.8% (94) |
| Data processing, libraries, and other information services | 0.8% (88) | 0.4% (25) | 1.2% (63) |
| Printing and related support activities | 0.8% (88) | 1.4% (81) | 0.1% (7) |
| Motor vehicle and parts dealers | 0.8% (86) | 1.2% (73) | 0.2% (13) |
| Furniture and home furnishings, and household appliance stores | 0.7% (83) | 0.7% (43) | 0.7% (40) |
| Miscellaneous nondurable goods merchant wholesalers | 0.7% (82) | 1.0% (58) | 0.4% (24) |
| Metal and metal products | 0.7% (80) | 0.9% (55) | 0.5% (25) |
| U. S. Postal service | 0.6% (73) | 0.8% (49) | 0.4% (24) |
| Radio, TV, and computer stores | 0.6% (72) | 1.1% (65) | 0.1% (7) |
| Used merchandise, gift, novelty, and souvenir, and other miscellaneous stores | 0.6% (70) | 0.6% (34) | 0.7% (36) |
| Building material and garden equipment and supplies dealers | 0.6% (66) | 0.7% (39) | 0.5% (27) |
| Professional and commercial equipment and supplies merchant wholesalers | 0.5% (57) | 0.7% (39) | 0.3% (18) |
| Other direct selling establishments | 0.4% (47) | 0.4% (24) | 0.4% (23) |
| Truck transportation | 0.4% (42) | 0.7% (42) | 0.0% (0) |
| Air transportation | 0.4% (42) | 0.5% (27) | 0.3% (15) |
| Food | 0.4% (42) | 0.5% (31) | 0.2% (11) |
| Machinery | 0.4% (40) | 0.6% (35) | 0.1% (5) |
| Rail transportation | 0.4% (40) | 0.7% (40) | 0.0% (0) |
| Petroleum and coal products | 0.3% (39) | 0.7% (39) | 0.0% (0) |
| Electrical equipment, appliances, and components | 0.3% (39) | 0.5% (31) | 0.1% (8) |
| Computer and electronic products | 0.3% (39) | 0.4% (26) | 0.2% (13) |
| Groceries and related products merchant wholesalers | 0.3% (37) | 0.4% (24) | 0.2% (13) |
| Gasoline stations | 0.3% (34) | 0.2% (14) | 0.4% (20) |
| Jewelry, luggage, and leather goods stores | 0.3% (34) | 0.2% (9) | 0.5% (25) |
| Electronic shopping and mail-order houses | 0.3% (34) | 0.1% (6) | 0.5% (28) |
| Paper | 0.3% (33) | 0.5% (27) | 0.1% (6) |
| Health and personal care, except drug, stores | 0.3% (32) | 0.3% (17) | 0.3% (15) |
| Private households | 0.3% (32) | 0.0% (0) | 0.6% (32) |
| Motor vehicles, parts and supplies merchant wholesalers | 0.2% (28) | 0.5% (28) | 0.0% (0) |
| Warehousing and storage | 0.2% (25) | 0.4% (25) | 0.0% (0) |
| Miscellaneous durable goods merchant wholesalers | 0.2% (24) | 0.0% (0) | 0.4% (24) |
| Electrical and electronic goods merchant wholesalers | 0.2% (23) | 0.4% (23) | 0.0% (0) |
| Sporting goods, camera, and hobby and toy stores | 0.2% (19) | 0.2% (10) | 0.2% (9) |
| Nonmetallic mineral products | 0.2% (19) | 0.3% (19) | 0.0% (0) |
| Management of companies and enterprises | 0.2% (18) | 0.1% (7) | 0.2% (11) |
| Retail florists | 0.2% (18) | 0.0% (0) | 0.3% (18) |
| Drugs, sundries, and chemical and allied products merchant wholesalers | 0.2% (17) | 0.0% (0) | 0.3% (17) |
| Office supplies and stationery stores | 0.2% (17) | 0.2% (13) | 0.1% (4) |
| Paper and paper products merchant wholesalers | 0.2% (17) | 0.3% (17) | 0.0% (0) |
| Machinery, equipment, and supplies merchant wholesalers | 0.1% (16) | 0.2% (11) | 0.1% (5) |
| Furniture and related product manufacturing | 0.1% (14) | 0.2% (14) | 0.0% (0) |
| Furniture and home furnishing merchant wholesalers | 0.1% (13) | 0.1% (6) | 0.1% (7) |
| Lumber and other construction materials merchant wholesalers | 0.1% (12) | 0.2% (12) | 0.0% (0) |
| Apparel | 0.1% (11) | 0.1% (7) | 0.1% (4) |
| Hardware, plumbing and heating equipment, and supplies merchant wholesalers | 0.1% (10) | 0.2% (10) | 0.0% (0) |
| Alcoholic beverages merchant wholesalers | 0.1% (9) | 0.2% (9) | 0.0% (0) |
| Book stores and news dealers | 0.1% (8) | 0.1% (8) | 0.0% (0) |
| Plastics and rubber products | 0.1% (8) | 0.1% (8) | 0.0% (0) |
| Petroleum and petroleum products merchant wholesalers | 0.1% (6) | 0.1% (6) | 0.0% (0) |
Unemployment in Springfield
- Unemployment by race in 2000
- Unemployment rate for White non-Hispanic residents
- 2.0%Males
- 1.8%Females
- Unemployment rate for Asian residents
- 11.0%Males
- Unemployment rate for two or more race residents
- 25.9%Males
Time leaving home to go to work

<5am:
| Springfield: | 1.3% (142) |
| Pennsylvania: | 3.1% (172,304) |
5:30am:
| Springfield: | 1.6% (181) |
| Pennsylvania: | 2.7% (150,168) |
6am:
| Springfield: | 2.6% (290) |
| Pennsylvania: | 4.4% (245,004) |
6:30am:
| Springfield: | 7.4% (833) |
| Pennsylvania: | 8.6% (478,636) |
7am:
| Springfield: | 8.8% (993) |
| Pennsylvania: | 10.8% (599,808) |
7:30am:
| Springfield: | 17.2% (1,933) |
| Pennsylvania: | 13.7% (759,372) |
8am:
| Springfield: | 18.7% (2,098) |
| Pennsylvania: | 14.9% (826,968) |
8:30am:
| Springfield: | 14.3% (1,602) |
| Pennsylvania: | 10.6% (588,440) |
9am:
| Springfield: | 7.0% (786) |
| Pennsylvania: | 5.5% (304,765) |
10am:
| Springfield: | 6.3% (703) |
| Pennsylvania: | 5.1% (280,812) |
11am:
| Springfield: | 2.0% (223) |
| Pennsylvania: | 2.1% (114,676) |
12pm:
| Springfield: | 0.7% (73) |
| Pennsylvania: | 1.0% (57,867) |
4pm:
| Springfield: | 4.7% (524) |
| Pennsylvania: | 7.3% (404,775) |
>4pm:
| Springfield: | 4.1% (464) |
| Pennsylvania: | 7.3% (408,070) |
Travel time to work
Daytime population change due to commuting: -5 (0.0%)
Workers who live and work in this place: 2,152 (19.2%)
Workers who live and work in this place: 2,152 (19.2%)


Less than 5 minutes:
| Springfield: | 2.1% (238) |
| Pennsylvania: | 3.5% (196,492) |
5 to 9 minutes:
| Springfield: | 9.1% (1,024) |
| Pennsylvania: | 11.1% (615,919) |
10 to 14 minutes:
| Springfield: | 11.0% (1,240) |
| Pennsylvania: | 14.9% (825,199) |
15 to 19 minutes:
| Springfield: | 12.8% (1,441) |
| Pennsylvania: | 15.0% (836,006) |
20 to 24 minutes:
| Springfield: | 12.7% (1,429) |
| Pennsylvania: | 14.1% (782,790) |
25 to 29 minutes:
| Springfield: | 6.0% (675) |
| Pennsylvania: | 5.9% (327,459) |
30 to 34 minutes:
| Springfield: | 14.9% (1,672) |
| Pennsylvania: | 11.8% (655,811) |
35 to 39 minutes:
| Springfield: | 4.5% (509) |
| Pennsylvania: | 2.7% (148,906) |
40 to 44 minutes:
| Springfield: | 5.9% (659) |
| Pennsylvania: | 3.4% (187,483) |
45 to 59 minutes:
| Springfield: | 11.7% (1,313) |
| Pennsylvania: | 7.3% (407,516) |
60 to 89 minutes:
| Springfield: | 4.4% (494) |
| Pennsylvania: | 4.8% (265,759) |
90 or more minutes:
| Springfield: | 1.3% (151) |
| Pennsylvania: | 2.6% (142,325) |
Means of transportation to work


Drove car alone:
| Springfield: | 82.1% (9,221) |
| Pennsylvania: | 76.5% (4,247,836) |
Carpooled:
| Springfield: | 7.8% (880) |
| Pennsylvania: | 10.4% (577,364) |
Bus or trolley bus:
| Springfield: | 0.9% (100) |
| Pennsylvania: | 3.6% (198,036) |
Streetcar or trolley car:
| Springfield: | 0.2% (22) |
| Pennsylvania: | 0.1% (8,214) |
Subway or elevated:
| Springfield: | 1.4% (152) |
| Pennsylvania: | 0.6% (34,724) |
Railroad:
| Springfield: | 2.3% (261) |
| Pennsylvania: | 0.8% (43,455) |
Bicycle:
| Springfield: | 0.1% (16) |
| Pennsylvania: | 0.3% (14,001) |
Walked:
| Springfield: | 1.5% (171) |
| Pennsylvania: | 4.1% (229,725) |
Other means:
| Springfield: | 0.2% (22) |
| Pennsylvania: | 0.5% (29,805) |
Private vehicle occupancy

Drove alone:
| Springfield: | 91.3% (9,221) |
| Pennsylvania: | 88.0% (4,247,836) |
In 2 person carpool:
| Springfield: | 6.9% (698) |
| Pennsylvania: | 9.7% (470,174) |
In 3 person carpool:
| Springfield: | 1.4% (137) |
| Pennsylvania: | 1.4% (67,610) |
In 4 person carpool:
| Springfield: | 0.1% (7) |
| Pennsylvania: | 0.5% (22,718) |
In 5-6 person carpool:
| Springfield: | 0.3% (28) |
| Pennsylvania: | 0.2% (9,833) |
In 7+ person carpool:
| Springfield: | 0.1% (10) |
| Pennsylvania: | 0.1% (7,029) |
Class of workers
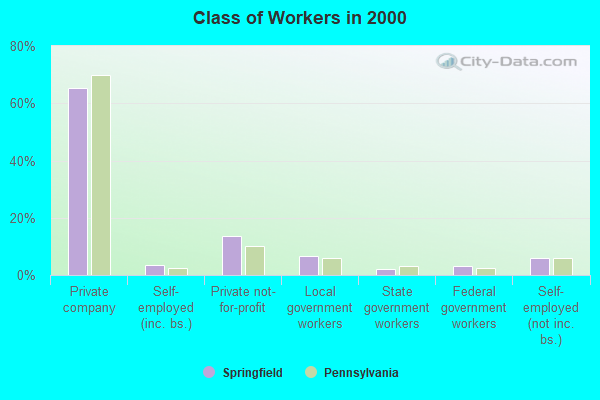
Employee of private company:
| Springfield: | 65.3% (7,384) |
| Pennsylvania: | 69.7% (3,942,119) |
Self-employed in own incorporated business:
| Springfield: | 3.3% (378) |
| Pennsylvania: | 2.4% (134,871) |
Private not-for-profit wage and salary workers:
| Springfield: | 13.6% (1,538) |
| Pennsylvania: | 10.3% (580,382) |
Local government workers:
| Springfield: | 6.5% (737) |
| Pennsylvania: | 5.8% (326,222) |
State government workers:
| Springfield: | 2.1% (237) |
| Pennsylvania: | 3.2% (182,232) |
Federal government workers:
| Springfield: | 3.2% (357) |
| Pennsylvania: | 2.3% (130,634) |
Self-employed workers in own not incorporated business:
| Springfield: | 5.9% (667) |
| Pennsylvania: | 6.0% (339,631) |
Unpaid family workers:
| Springfield: | 0.1% (15) |
| Pennsylvania: | 0.3% (17,409) |

Employee of private company - Males:
| Springfield: | 66.8% (3,970) |
| Pennsylvania: | 72.1% (2,157,103) |
Self-employed in own incorporated business - Males:
| Springfield: | 5.3% (313) |
| Pennsylvania: | 3.4% (103,200) |
Private not-for-profit wage and salary workers - Males:
| Springfield: | 8.1% (482) |
| Pennsylvania: | 6.3% (187,590) |
Local government workers - Males:
| Springfield: | 6.2% (370) |
| Pennsylvania: | 4.8% (143,607) |
State government workers - Males:
| Springfield: | 1.8% (108) |
| Pennsylvania: | 3.1% (91,922) |
Federal government workers - Males:
| Springfield: | 4.8% (285) |
| Pennsylvania: | 2.5% (73,391) |
Self-employed workers in own not incorporated business - Males:
| Springfield: | 7.0% (414) |
| Pennsylvania: | 7.6% (228,618) |

Employee of private company - Females:
| Springfield: | 63.6% (3,414) |
| Pennsylvania: | 67.1% (1,785,016) |
Self-employed in own incorporated business - Females:
| Springfield: | 1.2% (65) |
| Pennsylvania: | 1.2% (31,671) |
Private not-for-profit wage and salary workers - Females:
| Springfield: | 19.7% (1,056) |
| Pennsylvania: | 14.8% (392,792) |
Local government workers - Females:
| Springfield: | 6.8% (367) |
| Pennsylvania: | 6.9% (182,615) |
State government workers - Females:
| Springfield: | 2.4% (129) |
| Pennsylvania: | 3.4% (90,310) |
Federal government workers - Females:
| Springfield: | 1.3% (72) |
| Pennsylvania: | 2.2% (57,243) |
Self-employed workers in own not incorporated business - Females:
| Springfield: | 4.7% (253) |
| Pennsylvania: | 4.2% (111,013) |
Unpaid family workers - Females:
| Springfield: | 0.3% (15) |
| Pennsylvania: | 0.4% (10,060) |