Work and Jobs in Tacoma, Washington (WA) Detailed Stats
Occupations, Industries, Unemployment, Workers, Commute
Settings
X


Recent posts about work in Tacoma, Washington on our local forum with over 2,400,000 registered users:
 | Job Offer in Tacoma! (28 replies) |
| Looking for advice - relocating for jobs, but we can't figure out where to live (42 replies) |
| Job offer in Tacoma, salary enough? (8 replies) |
| Job transfer to Tacoma, but where should I live? (22 replies) |
| Port of Seattle closed due to ILWU labor strife (1 reply) |
| Where to live if working in Seattle and Tacoma? (6 replies) |
Latest news about work in Tacoma, WA collected exclusively by city-data.com from local newspapers, TV, and radio stations
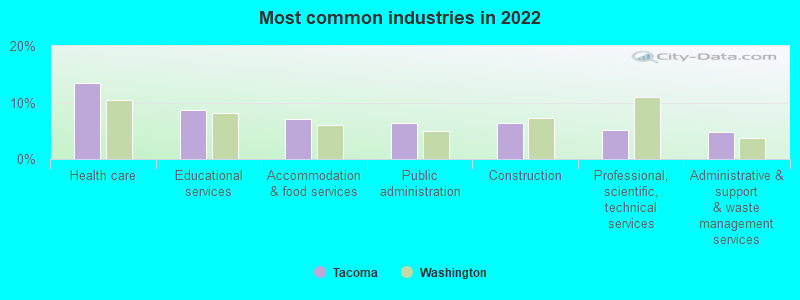
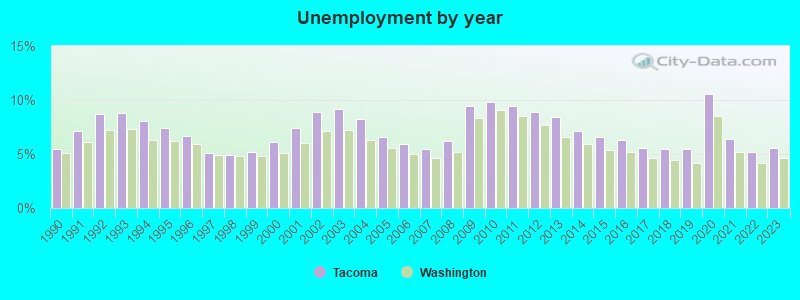
The unemployment rate in 2023 in Tacoma, WA was 5.6%, which was 17.9% greater than the unemployment rate of 4.6% across the entire state of Washington. Compared to the unemployment rate of 8.4% in 2013, this represents a decrease of 50.0%. According to 2022 data, the most common industries in Tacoma are: Health care (13.5% of civilian employees), Educational services (8.8% of civilian employees), Accommodation & food services (7.1% of civilian employees). 75.6% of workers work in Pierce County and 16.5% of all workers work at home. 64.5% of workers are employees of private companies, which is 2.3% less than the rate of 66.0% across the entire state of Washington.
Whole page based on the data from 2000 / 2022 when the population of Tacoma, Washington was 193,556 / 221,790
Whole page based on the data from 2000 / 2022 when the population of Tacoma, Washington was 193,556 / 221,790
Most common industries


Most common industries | Most common industries | |||||
|---|---|---|---|---|---|---|
Industry | All | Males | Females | All | Males | Females |
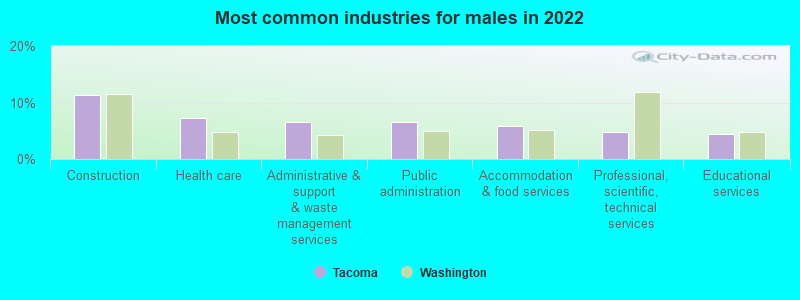
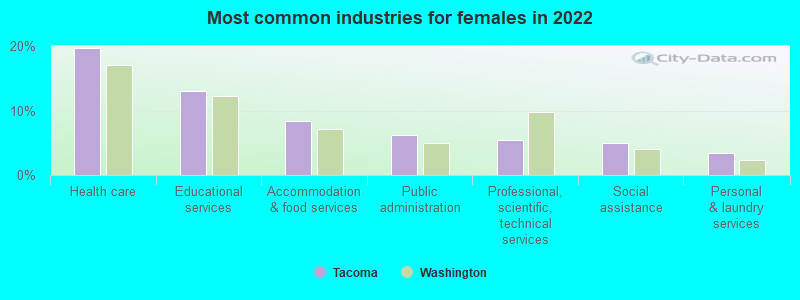
| Health care | 13.5% (14,361) | 7.2% (3,793) | 19.7% (10,568) | 10.4% (8,992) | 4.5% (2,074) | 16.9% (6,918) |
| Educational services | 8.8% (9,304) | 4.4% (2,313) | 13.0% (6,991) | 8.0% (6,972) | 4.6% (2,093) | 11.9% (4,879) |
| Accommodation and food services | 7.1% (7,571) | 5.8% (3,038) | 8.4% (4,533) | 6.5% (5,634) | 5.7% (2,639) | 7.3% (2,995) |
| Public administration | 6.4% (6,788) | 6.6% (3,468) | 6.2% (3,320) | 5.7% (4,905) | 5.7% (2,597) | 5.6% (2,308) |
| Construction | 6.3% (6,741) | 11.4% (5,964) | 1.4% (777) | 6.3% (5,476) | 10.5% (4,815) | 1.6% (661) |
| Professional, scientific, and technical services | 5.1% (5,418) | 4.7% (2,463) | 5.5% (2,955) | 4.1% (3,548) | 3.9% (1,813) | 4.2% (1,735) |
| Administrative and support and waste management services | 4.8% (5,152) | 6.6% (3,471) | 3.1% (1,681) | 4.0% (3,505) | 4.7% (2,156) | 3.3% (1,349) |
| Arts, entertainment, and recreation | 3.1% (3,344) | 3.0% (1,575) | 3.3% (1,769) | 2.7% (2,336) | 2.5% (1,166) | 2.9% (1,170) |
| Social assistance | 3.1% (3,258) | 1.2% (621) | 4.9% (2,637) | 2.9% (2,501) | 0.9% (407) | 5.1% (2,094) |
| Finance and insurance | 2.9% (3,062) | 2.4% (1,234) | 3.4% (1,828) | 3.6% (3,154) | 2.4% (1,097) | 5.0% (2,057) |
| Real estate and rental and leasing | 2.5% (2,657) | 3.1% (1,645) | 1.9% (1,012) | 2.1% (1,838) | 2.2% (1,003) | 2.0% (835) |
| Transportation equipment | 2.4% (2,543) | 3.1% (1,634) | 1.7% (909) | 3.2% (2,793) | 4.7% (2,162) | 1.5% (631) |
| Food and beverage stores | 2.3% (2,493) | 2.6% (1,354) | 2.1% (1,139) | 2.2% (1,933) | 1.7% (788) | 2.8% (1,145) |
| Other transportation, and support activities, and couriers | 2.2% (2,330) | 3.6% (1,889) | 0.8% (441) | 1.8% (1,592) | 2.6% (1,183) | 1.0% (409) |
| Personal and laundry services | 2.1% (2,266) | 0.8% (419) | 3.4% (1,847) | 1.4% (1,231) | 0.8% (363) | 2.1% (868) |
| Department and other general merchandise stores | 1.8% (1,918) | 2.0% (1,049) | 1.6% (869) | 1.9% (1,654) | 1.0% (457) | 2.9% (1,197) |
| Truck transportation | 1.4% (1,491) | 2.5% (1,310) | 0.3% (181) | 1.5% (1,274) | 2.5% (1,128) | 0.4% (146) |
| Religious, grantmaking, civic, professional, and similar organizations | 1.4% (1,476) | 1.0% (530) | 1.8% (946) | 1.9% (1,645) | 1.6% (740) | 2.2% (905) |
| Broadcasting and telecommunications | 1.2% (1,313) | 1.5% (778) | 1.0% (535) | 1.0% (847) | 1.2% (533) | 0.8% (314) |
| Motor vehicle and parts dealers | 1.2% (1,283) | 2.0% (1,065) | 0.4% (218) | 1.6% (1,420) | 2.4% (1,099) | 0.8% (321) |
| Repair and maintenance | 1.2% (1,272) | 2.1% (1,111) | 0.3% (161) | 1.8% (1,554) | 3.2% (1,451) | 0.3% (103) |
| Pharmacies and drug stores | 0.9% (967) | 0.5% (252) | 1.3% (715) | 0.5% (415) | 0.3% (124) | 0.7% (291) |
| Used merchandise, gift, novelty, and souvenir, and other miscellaneous stores | 0.8% (842) | 0.5% (286) | 1.0% (556) | 1.0% (901) | 0.8% (346) | 1.4% (555) |
| Miscellaneous manufacturing | 0.8% (835) | 1.1% (554) | 0.5% (281) | 0.8% (653) | 0.9% (406) | 0.6% (247) |
| Food | 0.7% (775) | 0.5% (283) | 0.9% (492) | 1.2% (1,004) | 1.1% (524) | 1.2% (480) |
| Groceries and related products merchant wholesalers | 0.7% (745) | 1.1% (579) | 0.3% (166) | 1.0% (860) | 1.3% (617) | 0.6% (243) |
| Clothing and accessories, including shoe, stores | 0.7% (692) | 0.3% (142) | 1.0% (550) | 0.4% (334) | 0.3% (127) | 0.5% (207) |
| Building material and garden equipment and supplies dealers | 0.6% (656) | 0.7% (351) | 0.6% (305) | 0.9% (774) | 1.2% (540) | 0.6% (234) |
| Metal and metal products | 0.6% (646) | 1.2% (608) | 0.1% (38) | 1.1% (995) | 1.9% (867) | 0.3% (128) |
| Agriculture, forestry, fishing and hunting | 0.6% (617) | 0.7% (385) | 0.4% (232) | 0.9% (762) | 1.3% (618) | 0.4% (144) |
| Private households | 0.5% (548) | 0.1% (32) | 1.0% (516) | 0.5% (425) | 0.1% (59) | 0.9% (366) |
| Utilities | 0.5% (515) | 0.9% (449) | 0.1% (66) | 0.7% (613) | 1.0% (457) | 0.4% (156) |
| Computer and electronic products | 0.5% (509) | 0.7% (364) | 0.3% (145) | 0.6% (561) | 0.9% (415) | 0.4% (146) |
| Wood products | 0.5% (505) | 0.7% (379) | 0.2% (126) | 1.2% (1,071) | 1.9% (861) | 0.5% (210) |
| U. S. Postal service | 0.5% (490) | 0.7% (378) | 0.2% (112) | 0.7% (648) | 1.0% (455) | 0.5% (193) |
| Other direct selling establishments | 0.5% (483) | 0.1% (51) | 0.8% (432) | 0.5% (439) | 0.3% (130) | 0.8% (309) |
| Plastics and rubber products | 0.4% (462) | 0.9% (462) | 0.0% (0) | 0.7% (613) | 0.9% (413) | 0.5% (200) |
| Air transportation | 0.4% (451) | 0.3% (174) | 0.5% (277) | 1.0% (836) | 0.9% (410) | 1.0% (426) |
| Gasoline stations | 0.4% (447) | 0.3% (174) | 0.5% (273) | 0.2% (205) | 0.2% (105) | 0.2% (100) |
| Sporting goods, camera, and hobby and toy stores | 0.4% (432) | 0.4% (236) | 0.4% (196) | 0.5% (474) | 0.6% (277) | 0.5% (197) |
| Paper | 0.4% (396) | 0.4% (229) | 0.3% (167) | 0.5% (445) | 0.8% (372) | 0.2% (73) |
| Chemicals | 0.4% (392) | 0.4% (229) | 0.3% (163) | 0.3% (263) | 0.4% (203) | 0.1% (60) |
| Warehousing and storage | 0.4% (386) | 0.5% (288) | 0.2% (98) | 0.2% (156) | 0.2% (111) | 0.1% (45) |
| Furniture and home furnishings, and household appliance stores | 0.4% (375) | 0.6% (295) | 0.1% (80) | 0.5% (422) | 0.6% (296) | 0.3% (126) |
| Publishing, and motion picture and sound recording industries | 0.3% (362) | 0.5% (237) | 0.2% (125) | 0.9% (751) | 0.9% (422) | 0.8% (329) |
| Motor vehicles, parts and supplies merchant wholesalers | 0.3% (359) | 0.6% (317) | 0.1% (42) | 0.3% (223) | 0.3% (159) | 0.2% (64) |
| Data processing, libraries, and other information services | 0.3% (354) | 0.1% (57) | 0.6% (297) | 0.5% (404) | 0.3% (153) | 0.6% (251) |
| Professional and commercial equipment and supplies merchant wholesalers | 0.3% (354) | 0.3% (175) | 0.3% (179) | 0.3% (228) | 0.3% (147) | 0.2% (81) |
| Radio, TV, and computer stores | 0.3% (351) | 0.4% (218) | 0.2% (133) | 0.4% (363) | 0.6% (263) | 0.2% (100) |
| Nonmetallic mineral products | 0.3% (344) | 0.3% (163) | 0.3% (181) | 0.4% (381) | 0.7% (323) | 0.1% (58) |
| Machinery, equipment, and supplies merchant wholesalers | 0.3% (319) | 0.5% (262) | 0.1% (57) | 0.4% (321) | 0.6% (269) | 0.1% (52) |
| Furniture and related product manufacturing | 0.2% (262) | 0.4% (190) | 0.1% (72) | 0.7% (613) | 1.0% (440) | 0.4% (173) |
| Machinery | 0.2% (251) | 0.3% (182) | 0.1% (69) | 0.4% (323) | 0.6% (260) | 0.2% (63) |
| Miscellaneous nondurable goods merchant wholesalers | 0.2% (249) | 0.4% (223) | 0.0% (26) | 0.4% (307) | 0.4% (166) | 0.3% (141) |
| Health and personal care, except drug, stores | 0.2% (245) | 0.0% (14) | 0.4% (231) | 0.2% (148) | 0.0% (14) | 0.3% (134) |
| Electronic shopping and mail-order houses | 0.2% (240) | 0.3% (176) | 0.1% (64) | 0.1% (113) | 0.2% (87) | 0.1% (26) |
| Printing and related support activities | 0.2% (239) | 0.4% (231) | 0.0% (8) | 0.6% (560) | 0.7% (344) | 0.5% (216) |
| Petroleum and coal products | 0.2% (216) | 0.4% (187) | 0.1% (29) | 0.1% (95) | 0.2% (85) | 0.0% (10) |
| Book stores and news dealers | 0.2% (212) | 0.2% (99) | 0.2% (113) | 0.2% (167) | 0.1% (62) | 0.3% (105) |
| Office supplies and stationery stores | 0.2% (205) | 0.4% (196) | 0.0% (9) | 0.1% (84) | 0.1% (29) | 0.1% (55) |
| Music stores | 0.2% (199) | 0.3% (159) | 0.1% (40) | 0.2% (140) | 0.2% (78) | 0.2% (62) |
| Water transportation | 0.2% (187) | 0.3% (163) | 0.0% (24) | 0.4% (348) | 0.7% (326) | 0.1% (22) |
| Lumber and other construction materials merchant wholesalers | 0.2% (187) | 0.3% (163) | 0.0% (24) | 0.4% (388) | 0.7% (339) | 0.1% (49) |
| Jewelry, luggage, and leather goods stores | 0.1% (150) | 0.0% (5) | 0.3% (145) | 0.1% (123) | 0.1% (45) | 0.2% (78) |
| Electrical equipment, appliances, and components | 0.1% (149) | 0.1% (66) | 0.2% (83) | 0.1% (59) | 0.1% (44) | 0.0% (15) |
| Paper and paper products merchant wholesalers | 0.1% (142) | 0.3% (142) | 0.0% (0) | 0.1% (90) | 0.1% (66) | 0.1% (24) |
| Petroleum and petroleum products merchant wholesalers | 0.1% (140) | 0.3% (140) | 0.0% (0) | 0.1% (55) | 0.1% (44) | 0.0% (11) |
| Rail transportation | 0.1% (129) | 0.1% (66) | 0.1% (63) | 0.1% (120) | 0.3% (120) | 0.0% (0) |
| Hardware, plumbing and heating equipment, and supplies merchant wholesalers | 0.1% (103) | 0.2% (103) | 0.0% (0) | 0.1% (91) | 0.2% (80) | 0.0% (11) |
| Beverage and tobacco products | 0.1% (89) | 0.0% (16) | 0.1% (73) | 0.1% (80) | 0.2% (78) | 0.0% (2) |
| Fuel dealers | 0.1% (89) | 0.1% (72) | 0.0% (17) | 0.0% (31) | 0.0% (15) | 0.0% (16) |
| Recyclable material merchant wholesalers | 0.1% (87) | 0.2% (87) | 0.0% (0) | 0.1% (121) | 0.2% (101) | 0.0% (20) |
| Drugs, sundries, and chemical and allied products merchant wholesalers | 0.1% (86) | 0.1% (76) | 0.0% (10) | 0.1% (94) | 0.1% (68) | 0.1% (26) |
| Miscellaneous durable goods merchant wholesalers | 0.1% (66) | 0.1% (35) | 0.1% (31) | 0.3% (234) | 0.4% (177) | 0.1% (57) |
| Furniture and home furnishing merchant wholesalers | 0.1% (64) | 0.1% (36) | 0.1% (28) | 0.1% (123) | 0.3% (123) | 0.0% (0) |
| Electrical and electronic goods merchant wholesalers | 0.1% (55) | 0.1% (55) | 0.0% (0) | 0.2% (145) | 0.2% (98) | 0.1% (47) |
| Apparel | 0.0% (48) | 0.0% (15) | 0.1% (33) | 0.3% (218) | 0.2% (81) | 0.3% (137) |
| Textile mills and textile products | 0.0% (39) | 0.0% (11) | 0.1% (28) | 0.1% (95) | 0.0% (8) | 0.2% (87) |
| Alcoholic beverages merchant wholesalers | 0.0% (16) | 0.0% (16) | 0.0% (0) | 0.1% (114) | 0.2% (102) | 0.0% (12) |
| Retail florists | 0.0% (10) | 0.0% (0) | 0.0% (10) | 0.1% (111) | 0.1% (36) | 0.2% (75) |
| Metals and minerals, except petroleum, merchant wholesalers | 0.0% (0) | 0.0% (0) | 0.0% (0) | 0.1% (62) | 0.1% (55) | 0.0% (7) |
Unemployment in Tacoma
- Unemployment by race in 2022
- Unemployment rate for White non-Hispanic residents
- 6.0%Males
- 4.1%Females
- Unemployment rate for Black residents
- 13.2%Males
- 8.2%Females
- Unemployment rate for American Indian and Alaska Native residents
- 4.9%Males
- 4.7%Females
- Unemployment rate for Asian residents
- 5.4%Males
- 2.8%Females
- Unemployment rate for other race residents
- 6.5%Males
- 3.0%Females
- Unemployment rate for two or more race residents
- 9.4%Males
- 4.7%Females
- Unemployment rate for Hispanic or Latino residents
- 11.9%Males
- 11.1%Females
- Unemployment by race in 2000
- Unemployment rate for White non-Hispanic residents
- 6.7%Males
- 6.7%Females
- Unemployment rate for Black residents
- 11.4%Males
- 11.5%Females
- Unemployment rate for American Indian and Alaska Native residents
- 14.6%Males
- 13.0%Females
- Unemployment rate for Asian residents
- 8.8%Males
- 6.7%Females
- Unemployment rate for other race residents
- 10.0%Males
- 18.3%Females
- Unemployment rate for two or more race residents
- 6.8%Males
- 12.4%Females
- Unemployment rate for Hispanic or Latino residents
- 9.3%Males
- 15.8%Females
Unemployment in 2023:
| Tacoma: | 5.6% |
| Washington: | 4.6% |
Unemployment in 2022:
| Tacoma: | 5.2% |
| Washington: | 4.2% |
Unemployment in 2021:
| Tacoma: | 6.4% |
| Washington: | 5.2% |
Unemployment in 2020:
| Tacoma: | 10.6% |
| Washington: | 8.5% |
Unemployment in 2019:
| Tacoma: | 5.5% |
| Washington: | 4.2% |
Unemployment in 2018:
| Tacoma: | 5.5% |
| Washington: | 4.4% |
Unemployment in 2017:
| Tacoma: | 5.6% |
| Washington: | 4.6% |
Unemployment in 2016:
| Tacoma: | 6.3% |
| Washington: | 5.2% |
Unemployment in 2015:
| Tacoma: | 6.6% |
| Washington: | 5.4% |
Unemployment in 2014:
| Tacoma: | 7.1% |
| Washington: | 5.9% |
Unemployment in 2013:
| Tacoma: | 8.4% |
| Washington: | 6.6% |
Unemployment in 2012:
| Tacoma: | 8.9% |
| Washington: | 7.7% |
Unemployment in 2011:
| Tacoma: | 9.4% |
| Washington: | 8.5% |
Unemployment in 2010:
| Tacoma: | 9.8% |
| Washington: | 9.1% |
Unemployment in 2009:
| Tacoma: | 9.4% |
| Washington: | 8.3% |
Unemployment in 2008:
| Tacoma: | 6.2% |
| Washington: | 5.2% |
Unemployment in 2007:
| Tacoma: | 5.5% |
| Washington: | 4.6% |
Unemployment in 2006:
| Tacoma: | 5.9% |
| Washington: | 5.0% |
Unemployment in 2005:
| Tacoma: | 6.6% |
| Washington: | 5.6% |
Unemployment in 2004:
| Tacoma: | 8.2% |
| Washington: | 6.3% |
Unemployment in 2003:
| Tacoma: | 9.2% |
| Washington: | 7.2% |
Unemployment in 2002:
| Tacoma: | 8.9% |
| Washington: | 7.1% |
Unemployment in 2001:
| Tacoma: | 7.4% |
| Washington: | 6.0% |
Unemployment in 2000:
| Tacoma: | 6.1% |
| Washington: | 5.1% |
Unemployment in 1999:
| Tacoma: | 5.2% |
| Washington: | 4.8% |
Unemployment in 1998:
| Tacoma: | 4.9% |
| Washington: | 4.8% |
Unemployment in 1997:
| Tacoma: | 5.1% |
| Washington: | 4.9% |
Unemployment in 1996:
| Tacoma: | 6.7% |
| Washington: | 5.9% |
Unemployment in 1995:
| Tacoma: | 7.4% |
| Washington: | 6.2% |
Unemployment in 1994:
| Tacoma: | 8.1% |
| Washington: | 6.3% |
Unemployment in 1993:
| Tacoma: | 8.8% |
| Washington: | 7.3% |
Unemployment in 1992:
| Tacoma: | 8.7% |
| Washington: | 7.2% |
Unemployment in 1991:
| Tacoma: | 7.1% |
| Washington: | 6.1% |
Unemployment in 1990:
| Tacoma: | 5.5% |
| Washington: | 5.1% |
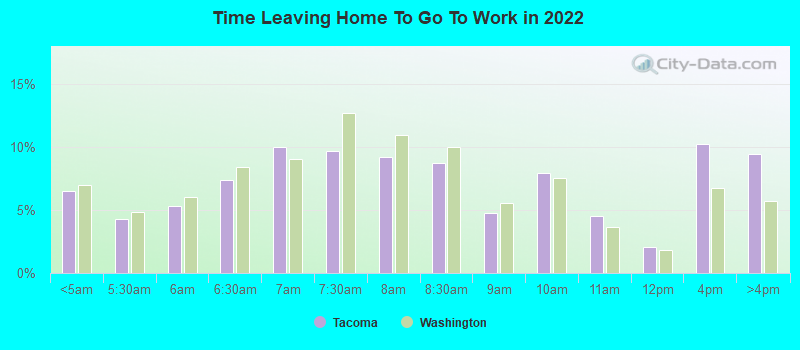
Time leaving home to go to work
12:00 a.m. to 4:59 a.m.:
| Tacoma: | 6.5% (5,853) |
| Washington: | 7.0% (213,920) |
5:00 a.m. to 5:29 a.m.:
| Tacoma: | 4.3% (3,866) |
| Washington: | 4.8% (147,787) |
5:30 a.m. to 5:59 a.m.:
| Tacoma: | 5.3% (4,825) |
| Washington: | 6.1% (185,330) |
6:00 a.m. to 6:29 a.m.:
| Tacoma: | 7.4% (6,672) |
| Washington: | 8.4% (257,617) |
6:30 a.m. to 6:59 a.m.:
| Tacoma: | 10.0% (9,063) |
| Washington: | 9.1% (277,560) |
7:00 a.m. to 7:29 a.m.:
| Tacoma: | 9.7% (8,748) |
| Washington: | 12.7% (387,691) |
7:30 a.m. to 7:59 a.m.:
| Tacoma: | 9.2% (8,317) |
| Washington: | 11.0% (335,322) |
8:00 a.m. to 8:29 a.m.:
| Tacoma: | 8.8% (7,919) |
| Washington: | 10.0% (304,814) |
8:30 a.m. to 8:59 a.m.:
| Tacoma: | 4.8% (4,308) |
| Washington: | 5.5% (169,492) |
9:00 a.m. to 9:59 a.m.:
| Tacoma: | 7.9% (7,151) |
| Washington: | 7.6% (231,053) |
10:00 a.m. to 10:59 a.m.:
| Tacoma: | 4.5% (4,088) |
| Washington: | 3.7% (111,784) |
11:00 a.m. to 11:59 a.m.:
| Tacoma: | 2.1% (1,870) |
| Washington: | 1.8% (55,138) |
12:00 p.m. to 3:59 p.m.:
| Tacoma: | 10.2% (9,230) |
| Washington: | 6.7% (205,284) |
4:00 p.m. to 11:59 p.m.:
| Tacoma: | 9.4% (8,538) |
| Washington: | 5.7% (174,677) |

<5am:
| Tacoma: | 4.9% (4,264) |
| Washington: | 4.2% (115,997) |
5:30am:
| Tacoma: | 4.4% (3,778) |
| Washington: | 3.7% (102,868) |
6am:
| Tacoma: | 5.5% (4,722) |
| Washington: | 5.3% (147,812) |
6:30am:
| Tacoma: | 8.4% (7,285) |
| Washington: | 8.9% (248,462) |
7am:
| Tacoma: | 9.9% (8,605) |
| Washington: | 10.3% (288,005) |
7:30am:
| Tacoma: | 12.2% (10,520) |
| Washington: | 13.5% (375,030) |
8am:
| Tacoma: | 12.2% (10,559) |
| Washington: | 13.4% (372,576) |
8:30am:
| Tacoma: | 8.4% (7,248) |
| Washington: | 9.0% (252,058) |
9am:
| Tacoma: | 4.9% (4,204) |
| Washington: | 5.1% (141,936) |
10am:
| Tacoma: | 5.3% (4,620) |
| Washington: | 5.8% (161,204) |
11am:
| Tacoma: | 2.7% (2,297) |
| Washington: | 2.5% (70,123) |
12pm:
| Tacoma: | 1.6% (1,418) |
| Washington: | 1.3% (35,612) |
4pm:
| Tacoma: | 8.1% (7,014) |
| Washington: | 6.8% (190,565) |
>4pm:
| Tacoma: | 7.9% (6,830) |
| Washington: | 5.8% (162,401) |

12:00 a.m. to 4:59 a.m. - Males:
| Tacoma: | 8.5% (4,266) |
| Washington: | 9.3% (158,516) |
5:00 a.m. to 5:29 a.m. - Males:
| Tacoma: | 5.4% (2,679) |
| Washington: | 6.5% (110,295) |
5:30 a.m. to 5:59 a.m. - Males:
| Tacoma: | 4.8% (2,398) |
| Washington: | 7.1% (120,772) |
6:00 a.m. to 6:29 a.m. - Males:
| Tacoma: | 7.0% (3,507) |
| Washington: | 9.8% (166,050) |
6:30 a.m. to 6:59 a.m. - Males:
| Tacoma: | 11.3% (5,647) |
| Washington: | 9.3% (158,128) |
7:00 a.m. to 7:29 a.m. - Males:
| Tacoma: | 10.1% (5,066) |
| Washington: | 11.7% (198,720) |
7:30 a.m. to 7:59 a.m. - Males:
| Tacoma: | 7.5% (3,763) |
| Washington: | 9.6% (162,900) |
8:00 a.m. to 8:29 a.m. - Males:
| Tacoma: | 6.1% (3,050) |
| Washington: | 8.8% (149,907) |
8:30 a.m. to 8:59 a.m. - Males:
| Tacoma: | 4.3% (2,166) |
| Washington: | 4.5% (76,772) |
9:00 a.m. to 9:59 a.m. - Males:
| Tacoma: | 6.5% (3,230) |
| Washington: | 6.5% (111,251) |
10:00 a.m. to 10:59 a.m. - Males:
| Tacoma: | 3.5% (1,731) |
| Washington: | 2.9% (49,968) |
11:00 a.m. to 11:59 a.m. - Males:
| Tacoma: | 2.3% (1,142) |
| Washington: | 1.6% (27,588) |
12:00 p.m. to 3:59 p.m. - Males:
| Tacoma: | 13.4% (6,717) |
| Washington: | 6.8% (115,643) |
4:00 p.m. to 11:59 p.m. - Males:
| Tacoma: | 9.2% (4,587) |
| Washington: | 5.6% (95,440) |

12:00 a.m. to 4:59 a.m. - Females:
| Tacoma: | 3.9% (1,587) |
| Washington: | 4.1% (55,404) |
5:00 a.m. to 5:29 a.m. - Females:
| Tacoma: | 2.9% (1,187) |
| Washington: | 2.8% (37,492) |
5:30 a.m. to 5:59 a.m. - Females:
| Tacoma: | 6.0% (2,427) |
| Washington: | 4.8% (64,558) |
6:00 a.m. to 6:29 a.m. - Females:
| Tacoma: | 7.8% (3,165) |
| Washington: | 6.8% (91,567) |
6:30 a.m. to 6:59 a.m. - Females:
| Tacoma: | 8.4% (3,416) |
| Washington: | 8.8% (119,432) |
7:00 a.m. to 7:29 a.m. - Females:
| Tacoma: | 9.1% (3,682) |
| Washington: | 13.9% (188,971) |
7:30 a.m. to 7:59 a.m. - Females:
| Tacoma: | 11.2% (4,554) |
| Washington: | 12.7% (172,422) |
8:00 a.m. to 8:29 a.m. - Females:
| Tacoma: | 12.0% (4,869) |
| Washington: | 11.4% (154,907) |
8:30 a.m. to 8:59 a.m. - Females:
| Tacoma: | 5.3% (2,142) |
| Washington: | 6.8% (92,720) |
9:00 a.m. to 9:59 a.m. - Females:
| Tacoma: | 9.7% (3,921) |
| Washington: | 8.8% (119,802) |
10:00 a.m. to 10:59 a.m. - Females:
| Tacoma: | 5.8% (2,357) |
| Washington: | 4.6% (61,816) |
11:00 a.m. to 11:59 a.m. - Females:
| Tacoma: | 1.8% (728) |
| Washington: | 2.0% (27,550) |
12:00 p.m. to 3:59 p.m. - Females:
| Tacoma: | 6.2% (2,513) |
| Washington: | 6.6% (89,641) |
4:00 p.m. to 11:59 p.m. - Females:
| Tacoma: | 9.8% (3,951) |
| Washington: | 5.8% (79,237) |
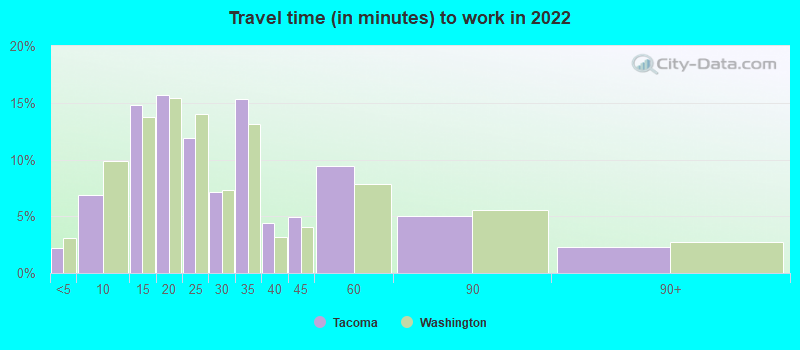
Travel time to work
Percentage of workers working in this county: 75.6%
Number of people working at home: 17,880 (16.5% of all workers)
Daytime population change due to commuting: +20,487 (+10.6%)
Workers who live and work in this city: 41,097 (47.5%)
Number of people working at home: 17,880 (16.5% of all workers)
Daytime population change due to commuting: +20,487 (+10.6%)
Workers who live and work in this city: 41,097 (47.5%)


Less than 5 minutes:
| Tacoma: | 2.2% (2,287) |
| Washington: | 3.1% (93,865) |
5 to 9 minutes:
| Tacoma: | 6.9% (7,100) |
| Washington: | 9.9% (298,868) |
10 to 14 minutes:
| Tacoma: | 14.8% (15,210) |
| Washington: | 13.7% (416,060) |
15 to 19 minutes:
| Tacoma: | 15.6% (16,105) |
| Washington: | 15.4% (467,690) |
20 to 24 minutes:
| Tacoma: | 11.9% (12,280) |
| Washington: | 14.0% (423,366) |
25 to 29 minutes:
| Tacoma: | 7.1% (7,304) |
| Washington: | 7.3% (221,791) |
30 to 34 minutes:
| Tacoma: | 15.4% (15,809) |
| Washington: | 13.1% (396,980) |
35 to 39 minutes:
| Tacoma: | 4.4% (4,548) |
| Washington: | 3.2% (96,888) |
40 to 44 minutes:
| Tacoma: | 4.9% (5,053) |
| Washington: | 4.1% (123,302) |
45 to 59 minutes:
| Tacoma: | 9.4% (9,729) |
| Washington: | 7.8% (237,234) |
60 to 89 minutes:
| Tacoma: | 5.0% (5,149) |
| Washington: | 5.6% (169,056) |
90 or more minutes:
| Tacoma: | 2.3% (2,383) |
| Washington: | 2.7% (82,273) |


Less than 5 minutes:
| Tacoma: | 2.8% (2,431) |
| Washington: | 3.3% (91,132) |
5 to 9 minutes:
| Tacoma: | 9.6% (8,324) |
| Washington: | 10.3% (286,517) |
10 to 14 minutes:
| Tacoma: | 15.9% (13,786) |
| Washington: | 14.1% (391,606) |
15 to 19 minutes:
| Tacoma: | 17.3% (14,981) |
| Washington: | 15.0% (418,990) |
20 to 24 minutes:
| Tacoma: | 13.4% (11,585) |
| Washington: | 14.2% (394,209) |
25 to 29 minutes:
| Tacoma: | 5.1% (4,383) |
| Washington: | 5.8% (162,590) |
30 to 34 minutes:
| Tacoma: | 10.9% (9,427) |
| Washington: | 12.5% (348,311) |
35 to 39 minutes:
| Tacoma: | 2.6% (2,209) |
| Washington: | 2.6% (73,592) |
40 to 44 minutes:
| Tacoma: | 3.6% (3,075) |
| Washington: | 3.4% (95,182) |
45 to 59 minutes:
| Tacoma: | 6.9% (5,987) |
| Washington: | 7.0% (195,343) |
60 to 89 minutes:
| Tacoma: | 5.6% (4,873) |
| Washington: | 4.7% (131,691) |
90 or more minutes:
| Tacoma: | 2.7% (2,303) |
| Washington: | 2.7% (75,486) |

Less than 5 minutes - Males:
| Tacoma: | 1.5% (745) |
| Washington: | 3.0% (50,336) |
5 to 9 minutes - Males:
| Tacoma: | 4.9% (2,506) |
| Washington: | 8.8% (147,562) |
10 to 14 minutes - Males:
| Tacoma: | 16.1% (8,217) |
| Washington: | 12.7% (213,520) |
15 to 19 minutes - Males:
| Tacoma: | 15.4% (7,897) |
| Washington: | 14.9% (250,079) |
20 to 24 minutes - Males:
| Tacoma: | 11.7% (5,981) |
| Washington: | 13.7% (231,264) |
25 to 29 minutes - Males:
| Tacoma: | 6.8% (3,476) |
| Washington: | 7.3% (122,887) |
30 to 34 minutes - Males:
| Tacoma: | 14.9% (7,596) |
| Washington: | 13.5% (227,959) |
35 to 39 minutes - Males:
| Tacoma: | 4.9% (2,520) |
| Washington: | 3.4% (56,993) |
40 to 44 minutes - Males:
| Tacoma: | 7.3% (3,735) |
| Washington: | 4.6% (77,594) |
45 to 59 minutes - Males:
| Tacoma: | 9.6% (4,897) |
| Washington: | 8.5% (143,199) |
60 to 89 minutes - Males:
| Tacoma: | 4.6% (2,338) |
| Washington: | 6.3% (105,858) |
90 or more minutes - Males:
| Tacoma: | 2.4% (1,237) |
| Washington: | 3.3% (55,331) |

Less than 5 minutes - Females:
| Tacoma: | 3.0% (1,542) |
| Washington: | 3.2% (43,529) |
5 to 9 minutes - Females:
| Tacoma: | 8.9% (4,594) |
| Washington: | 11.3% (151,306) |
10 to 14 minutes - Females:
| Tacoma: | 13.5% (6,993) |
| Washington: | 15.1% (202,540) |
15 to 19 minutes - Females:
| Tacoma: | 15.8% (8,208) |
| Washington: | 16.2% (217,611) |
20 to 24 minutes - Females:
| Tacoma: | 12.2% (6,299) |
| Washington: | 14.3% (192,102) |
25 to 29 minutes - Females:
| Tacoma: | 7.4% (3,828) |
| Washington: | 7.4% (98,904) |
30 to 34 minutes - Females:
| Tacoma: | 15.9% (8,213) |
| Washington: | 12.6% (169,021) |
35 to 39 minutes - Females:
| Tacoma: | 3.9% (2,028) |
| Washington: | 3.0% (39,895) |
40 to 44 minutes - Females:
| Tacoma: | 2.5% (1,318) |
| Washington: | 3.4% (45,708) |
45 to 59 minutes - Females:
| Tacoma: | 9.3% (4,832) |
| Washington: | 7.0% (94,035) |
60 to 89 minutes - Females:
| Tacoma: | 5.4% (2,811) |
| Washington: | 4.7% (63,198) |
90 or more minutes - Females:
| Tacoma: | 2.2% (1,146) |
| Washington: | 2.0% (26,942) |
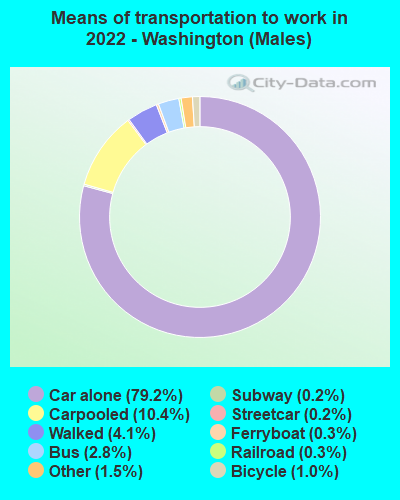
Means of transportation to work
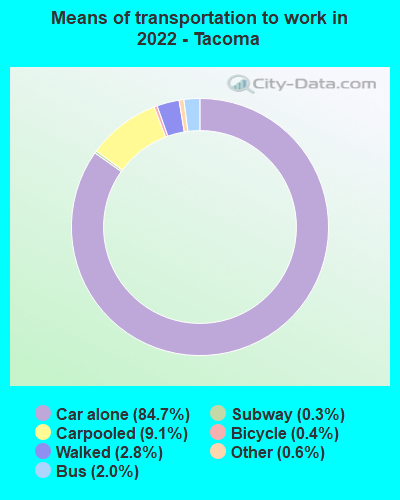
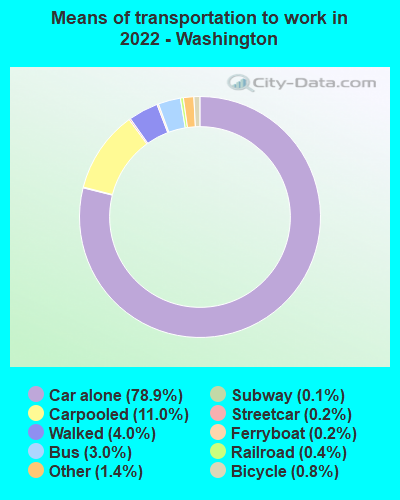
Drove car alone:
| Tacoma: | 84.7% (87,154) |
| Washington: | 78.9% (1,056,632) |
Carpooled:
| Tacoma: | 9.1% (9,413) |
| Washington: | 11.0% (157,303) |
Bus:
| Tacoma: | 2.0% (2,108) |
| Washington: | 3.0% (43,847) |
Long-distance train or commuter rail:
| Tacoma: | 0.3% (306) |
| Washington: | 0.1% (1,643) |
Light rail, streetcar or trolley:
| Tacoma: | 0.1% (86) |
| Washington: | 0.4% (6,524) |
Bicycle:
| Tacoma: | 0.4% (387) |
| Washington: | 0.8% (6,274) |
Walked:
| Tacoma: | 2.8% (2,921) |
| Washington: | 4.0% (52,284) |
Other means:
| Tacoma: | 0.6% (582) |
| Washington: | 1.4% (15,651) |


Drove car alone:
| Tacoma: | 72.4% (62,660) |
| Washington: | 73.3% (2,040,833) |
Carpooled:
| Tacoma: | 13.9% (12,052) |
| Washington: | 12.8% (357,742) |
Bus or trolley bus:
| Tacoma: | 5.2% (4,457) |
| Washington: | 4.5% (124,450) |
Streetcar or trolley car:
| Tacoma: | 0.0% (5) |
| Washington: | 0.0% (589) |
Subway or elevated:
| Tacoma: | 0.0% (9) |
| Washington: | 0.0% (598) |
Ferryboat:
| Tacoma: | 0.0% (37) |
| Washington: | 0.3% (8,923) |
Taxicab:
| Tacoma: | 0.0% (39) |
| Washington: | 0.1% (1,417) |
Motorcycle:
| Tacoma: | 0.1% (126) |
| Washington: | 0.2% (4,353) |
Bicycle:
| Tacoma: | 0.3% (258) |
| Washington: | 0.6% (16,205) |
Walked:
| Tacoma: | 3.5% (3,005) |
| Washington: | 3.2% (89,739) |
Other means:
| Tacoma: | 0.8% (716) |
| Washington: | 0.7% (19,499) |

Drove car alone - Males:
| Tacoma: | 84.3% (43,090) |
| Washington: | 79.2% (1,056,632) |
Carpooled - Males:
| Tacoma: | 9.5% (4,839) |
| Washington: | 10.4% (157,303) |
Bus - Males:
| Tacoma: | 1.4% (713) |
| Washington: | 2.8% (43,847) |
Long-distance train or commuter rail - Males:
| Tacoma: | 0.6% (306) |
| Washington: | 0.2% (1,643) |
Light rail, streetcar or trolley - Males:
| Tacoma: | 0.2% (86) |
| Washington: | 0.3% (6,524) |
Bicycle - Males:
| Tacoma: | 0.6% (322) |
| Washington: | 1.0% (6,274) |
Walked - Males:
| Tacoma: | 3.0% (1,531) |
| Washington: | 4.1% (52,284) |
Other means - Males:
| Tacoma: | 0.5% (258) |
| Washington: | 1.5% (15,651) |

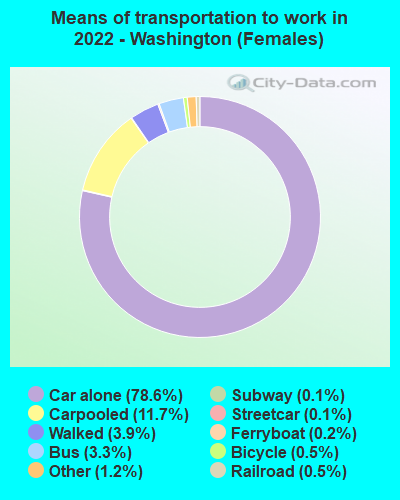
Drove car alone - Females:
| Tacoma: | 85.0% (44,064) |
| Washington: | 78.6% (1,056,632) |
Carpooled - Females:
| Tacoma: | 8.8% (4,574) |
| Washington: | 11.7% (157,303) |
Bus - Females:
| Tacoma: | 2.7% (1,395) |
| Washington: | 3.3% (43,847) |
Bicycle - Females:
| Tacoma: | 0.1% (65) |
| Washington: | 0.5% (6,274) |
Walked - Females:
| Tacoma: | 2.7% (1,390) |
| Washington: | 3.9% (52,284) |
Other means - Females:
| Tacoma: | 0.6% (324) |
| Washington: | 1.2% (15,651) |
Private vehicle occupancy

Drove alone:
| Tacoma: | 89.8% (73,320) |
| Washington: | 87.8% (2,415,775) |
In 2 person carpool:
| Tacoma: | 7.8% (6,401) |
| Washington: | 9.2% (252,715) |
In 3 person carpool:
| Tacoma: | 1.5% (1,254) |
| Washington: | 1.6% (44,943) |
In 4 person carpool:
| Tacoma: | 0.1% (105) |
| Washington: | 0.6% (17,361) |
In 5-6 person carpool:
| Tacoma: | 0.7% (541) |
| Washington: | 0.4% (10,530) |
In 7+ person carpool:
| Tacoma: | 0.0% (16) |
| Washington: | 0.3% (9,435) |

Drove alone:
| Tacoma: | 83.9% (62,660) |
| Washington: | 85.1% (2,040,833) |
In 2 person carpool:
| Tacoma: | 12.9% (9,611) |
| Washington: | 11.8% (282,638) |
In 3 person carpool:
| Tacoma: | 1.8% (1,338) |
| Washington: | 1.9% (44,791) |
In 4 person carpool:
| Tacoma: | 0.6% (474) |
| Washington: | 0.6% (14,195) |
In 5-6 person carpool:
| Tacoma: | 0.3% (238) |
| Washington: | 0.3% (7,914) |
In 7+ person carpool:
| Tacoma: | 0.5% (391) |
| Washington: | 0.3% (8,204) |
Class of workers
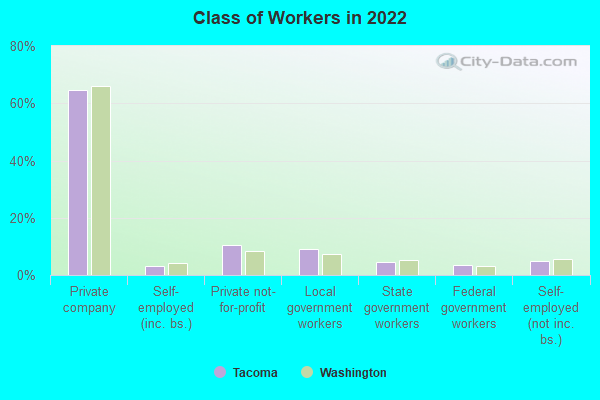
Employee of private company:
| Tacoma: | 64.5% (70,662) |
| Washington: | 66.0% (2,552,907) |
Self-employed in own incorporated business:
| Tacoma: | 3.2% (3,502) |
| Washington: | 4.2% (161,426) |
Private not-for-profit wage and salary workers:
| Tacoma: | 10.4% (11,415) |
| Washington: | 8.6% (330,637) |
Local government workers:
| Tacoma: | 9.0% (9,863) |
| Washington: | 7.3% (281,034) |
State government workers:
| Tacoma: | 4.5% (4,950) |
| Washington: | 5.2% (201,670) |
Federal government workers:
| Tacoma: | 3.4% (3,677) |
| Washington: | 3.1% (118,044) |
Self-employed workers in own not incorporated business:
| Tacoma: | 5.0% (5,447) |
| Washington: | 5.5% (212,937) |

Employee of private company:
| Tacoma: | 67.0% (58,107) |
| Washington: | 66.0% (1,843,000) |
Self-employed in own incorporated business:
| Tacoma: | 1.8% (1,585) |
| Washington: | 3.2% (90,102) |
Private not-for-profit wage and salary workers:
| Tacoma: | 8.5% (7,336) |
| Washington: | 6.9% (191,927) |
Local government workers:
| Tacoma: | 7.2% (6,214) |
| Washington: | 6.4% (178,161) |
State government workers:
| Tacoma: | 6.0% (5,250) |
| Washington: | 6.9% (192,408) |
Federal government workers:
| Tacoma: | 3.4% (2,970) |
| Washington: | 3.2% (89,153) |
Self-employed workers in own not incorporated business:
| Tacoma: | 5.9% (5,117) |
| Washington: | 7.2% (199,827) |
Unpaid family workers:
| Tacoma: | 0.2% (208) |
| Washington: | 0.3% (9,144) |

Employee of private company - Males:
| Tacoma: | 73.5% (42,127) |
| Washington: | 71.1% (1,491,511) |
Self-employed in own incorporated business - Males:
| Tacoma: | 4.2% (2,382) |
| Washington: | 4.9% (103,049) |
Private not-for-profit wage and salary workers - Males:
| Tacoma: | 5.4% (3,123) |
| Washington: | 5.5% (116,374) |
Local government workers - Males:
| Tacoma: | 6.4% (3,693) |
| Washington: | 5.4% (114,033) |
State government workers - Males:
| Tacoma: | 2.4% (1,354) |
| Washington: | 4.1% (84,969) |
Federal government workers - Males:
| Tacoma: | 2.8% (1,623) |
| Washington: | 3.4% (70,622) |
Self-employed workers in own not incorporated business - Males:
| Tacoma: | 5.3% (3,040) |
| Washington: | 5.4% (113,810) |

Employee of private company - Females:
| Tacoma: | 54.7% (28,535) |
| Washington: | 60.0% (1,061,396) |
Self-employed in own incorporated business - Females:
| Tacoma: | 2.1% (1,120) |
| Washington: | 3.3% (58,377) |
Private not-for-profit wage and salary workers - Females:
| Tacoma: | 15.9% (8,292) |
| Washington: | 12.1% (214,263) |
Local government workers - Females:
| Tacoma: | 11.8% (6,170) |
| Washington: | 9.4% (167,001) |
State government workers - Females:
| Tacoma: | 6.9% (3,596) |
| Washington: | 6.6% (116,701) |
Federal government workers - Females:
| Tacoma: | 3.9% (2,054) |
| Washington: | 2.7% (47,422) |
Self-employed workers in own not incorporated business - Females:
| Tacoma: | 4.6% (2,407) |
| Washington: | 5.6% (99,127) |