Work and Jobs in Thornton, Idaho (ID) Detailed Stats
Occupations, Industries, Unemployment, Workers, Commute
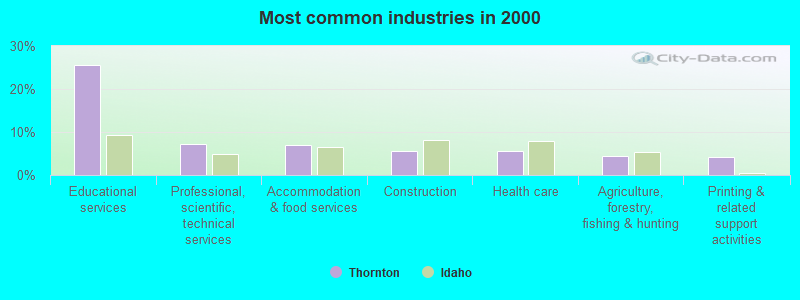
The most common industries in Thornton are: Educational services (25.6% of civilian employees), Professional, scientific, technical services (7.2% of civilian employees), Accommodation & food services (7.0% of civilian employees). 66.0% of workers are employees of private companies, which is 2.7% greater than the rate of 64.3% across the entire state of Idaho.
Most common industries
Most common industries | |||
|---|---|---|---|
Industry | All | Males | Females |
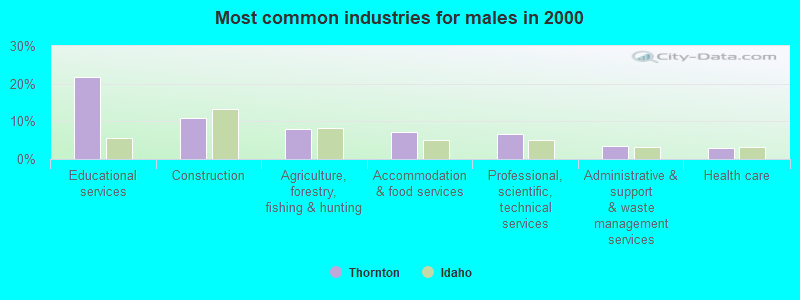
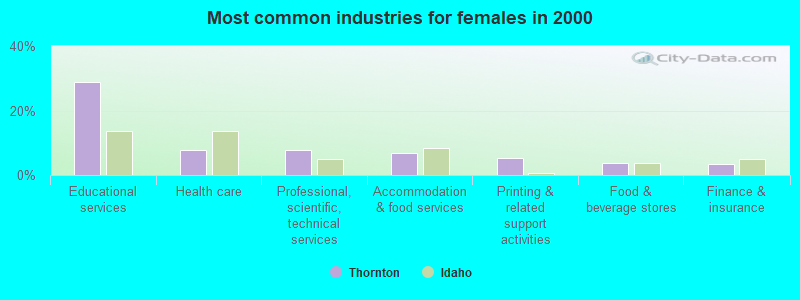
| Educational services | 25.6% (1,953) | 21.8% (790) | 29.0% (1,163) |
| Professional, scientific, and technical services | 7.2% (549) | 6.7% (243) | 7.6% (306) |
| Accommodation and food services | 7.0% (536) | 7.2% (262) | 6.8% (274) |
| Construction | 5.7% (435) | 10.8% (390) | 1.1% (45) |
| Health care | 5.5% (423) | 3.0% (109) | 7.8% (314) |
| Agriculture, forestry, fishing and hunting | 4.5% (345) | 7.9% (287) | 1.4% (58) |
| Printing and related support activities | 4.1% (313) | 2.6% (96) | 5.4% (217) |
| Finance and insurance | 3.0% (229) | 2.6% (94) | 3.4% (135) |
| Food | 2.9% (219) | 3.0% (107) | 2.8% (112) |
| Food and beverage stores | 2.8% (216) | 1.9% (70) | 3.6% (146) |
| Administrative and support and waste management services | 2.7% (203) | 3.4% (122) | 2.0% (81) |
| Real estate and rental and leasing | 2.2% (168) | 1.3% (47) | 3.0% (121) |
| Public administration | 2.1% (163) | 2.2% (81) | 2.0% (82) |
| Personal and laundry services | 1.8% (134) | 0.0% (0) | 3.3% (134) |
| Social assistance | 1.6% (123) | 0.7% (26) | 2.4% (97) |
| Motor vehicle and parts dealers | 1.5% (112) | 2.7% (98) | 0.3% (14) |
| Department and other general merchandise stores | 1.3% (103) | 1.4% (50) | 1.3% (53) |
| Building material and garden equipment and supplies dealers | 1.3% (102) | 1.4% (50) | 1.3% (52) |
| Groceries and related products merchant wholesalers | 1.3% (101) | 1.8% (66) | 0.9% (35) |
| Repair and maintenance | 1.1% (83) | 1.5% (55) | 0.7% (28) |
| Arts, entertainment, and recreation | 1.0% (74) | 1.4% (52) | 0.5% (22) |
| Truck transportation | 0.9% (71) | 1.6% (58) | 0.3% (13) |
| Used merchandise, gift, novelty, and souvenir, and other miscellaneous stores | 0.9% (70) | 1.1% (40) | 0.7% (30) |
| Gasoline stations | 0.9% (66) | 0.7% (24) | 1.0% (42) |
| Broadcasting and telecommunications | 0.8% (62) | 0.8% (28) | 0.8% (34) |
| Other transportation, and support activities, and couriers | 0.6% (45) | 0.7% (24) | 0.5% (21) |
| Religious, grantmaking, civic, professional, and similar organizations | 0.5% (42) | 1.2% (42) | 0.0% (0) |
| Miscellaneous manufacturing | 0.5% (41) | 0.5% (19) | 0.5% (22) |
| Sporting goods, camera, and hobby and toy stores | 0.5% (39) | 0.0% (0) | 1.0% (39) |
| Machinery, equipment, and supplies merchant wholesalers | 0.5% (39) | 0.7% (26) | 0.3% (13) |
| Publishing, and motion picture and sound recording industries | 0.5% (39) | 0.5% (17) | 0.5% (22) |
| Radio, TV, and computer stores | 0.4% (30) | 0.7% (24) | 0.1% (6) |
| Data processing, libraries, and other information services | 0.4% (30) | 0.2% (7) | 0.6% (23) |
| Furniture and home furnishings, and household appliance stores | 0.3% (26) | 0.5% (18) | 0.2% (8) |
| U. S. Postal service | 0.3% (25) | 0.6% (20) | 0.1% (5) |
| Clothing and accessories, including shoe, stores | 0.3% (25) | 0.0% (0) | 0.6% (25) |
| Textile mills and textile products | 0.3% (23) | 0.0% (0) | 0.6% (23) |
| Paper | 0.3% (23) | 0.4% (16) | 0.2% (7) |
| Retail florists | 0.3% (22) | 0.0% (0) | 0.5% (22) |
| Nonmetallic mineral products | 0.3% (22) | 0.6% (22) | 0.0% (0) |
| Private households | 0.3% (21) | 0.0% (0) | 0.5% (21) |
| Book stores and news dealers | 0.3% (20) | 0.0% (0) | 0.5% (20) |
| Furniture and related product manufacturing | 0.2% (19) | 0.4% (14) | 0.1% (5) |
| Computer and electronic products | 0.2% (19) | 0.0% (0) | 0.5% (19) |
| Health and personal care, except drug, stores | 0.2% (19) | 0.0% (0) | 0.5% (19) |
| Electronic shopping and mail-order houses | 0.2% (17) | 0.4% (13) | 0.1% (4) |
| Professional and commercial equipment and supplies merchant wholesalers | 0.2% (15) | 0.2% (8) | 0.2% (7) |
| Pharmacies and drug stores | 0.2% (12) | 0.0% (0) | 0.3% (12) |
| Sewing, needlework, and piece goods stores | 0.2% (12) | 0.0% (0) | 0.3% (12) |
| Mining, quarrying, and oil and gas extraction | 0.1% (11) | 0.1% (5) | 0.1% (6) |
| Warehousing and storage | 0.1% (11) | 0.0% (0) | 0.3% (11) |
| Machinery | 0.1% (11) | 0.3% (11) | 0.0% (0) |
| Apparel | 0.1% (10) | 0.3% (10) | 0.0% (0) |
| Office supplies and stationery stores | 0.1% (10) | 0.0% (0) | 0.2% (10) |
| Other direct selling establishments | 0.1% (10) | 0.3% (10) | 0.0% (0) |
| Paper and paper products merchant wholesalers | 0.1% (10) | 0.3% (10) | 0.0% (0) |
| Jewelry, luggage, and leather goods stores | 0.1% (9) | 0.2% (9) | 0.0% (0) |
| Utilities | 0.1% (9) | 0.2% (9) | 0.0% (0) |
| Hardware, plumbing and heating equipment, and supplies merchant wholesalers | 0.1% (9) | 0.2% (9) | 0.0% (0) |
| Miscellaneous nondurable goods merchant wholesalers | 0.1% (8) | 0.2% (8) | 0.0% (0) |
| Motor vehicles, parts and supplies merchant wholesalers | 0.1% (8) | 0.0% (0) | 0.2% (8) |
| Leather and allied products | 0.1% (7) | 0.2% (7) | 0.0% (0) |
| Metal and metal products | 0.1% (7) | 0.2% (7) | 0.0% (0) |
| Transportation equipment | 0.1% (6) | 0.2% (6) | 0.0% (0) |
| Miscellaneous durable goods merchant wholesalers | 0.1% (6) | 0.2% (6) | 0.0% (0) |
| Electrical and electronic goods merchant wholesalers | 0.1% (4) | 0.1% (4) | 0.0% (0) |
Unemployment in Thornton
- Unemployment by race in 2000
- Unemployment rate for White non-Hispanic residents
- 8.2%Males
- 8.3%Females
- Unemployment rate for American Indian and Alaska Native residents
- 20.7%Females
- Unemployment rate for Asian residents
- 71.4%Females
- Unemployment rate for other race residents
- 20.8%Females
- Unemployment rate for two or more race residents
- 20.5%Males
- Unemployment rate for Hispanic or Latino residents
- 17.5%Males
- 23.3%Females
Time leaving home to go to work

<5am:
| Thornton: | 2.9% (216) |
| Idaho: | 3.0% (17,746) |
5:30am:
| Thornton: | 0.6% (47) |
| Idaho: | 2.6% (15,758) |
6am:
| Thornton: | 3.0% (222) |
| Idaho: | 3.9% (23,486) |
6:30am:
| Thornton: | 3.0% (221) |
| Idaho: | 6.7% (40,014) |
7am:
| Thornton: | 4.6% (341) |
| Idaho: | 9.9% (58,652) |
7:30am:
| Thornton: | 8.5% (634) |
| Idaho: | 13.7% (81,453) |
8am:
| Thornton: | 17.3% (1,295) |
| Idaho: | 17.8% (106,105) |
8:30am:
| Thornton: | 8.7% (652) |
| Idaho: | 10.2% (60,766) |
9am:
| Thornton: | 5.6% (416) |
| Idaho: | 5.1% (30,303) |
10am:
| Thornton: | 4.8% (360) |
| Idaho: | 5.1% (30,263) |
11am:
| Thornton: | 3.7% (273) |
| Idaho: | 2.4% (14,138) |
12pm:
| Thornton: | 2.5% (189) |
| Idaho: | 1.3% (7,838) |
4pm:
| Thornton: | 16.9% (1,261) |
| Idaho: | 6.4% (38,225) |
>4pm:
| Thornton: | 12.4% (930) |
| Idaho: | 7.0% (41,894) |
Travel time to work


Less than 5 minutes:
| Thornton: | 10.8% (810) |
| Idaho: | 5.6% (33,498) |
5 to 9 minutes:
| Thornton: | 31.9% (2,385) |
| Idaho: | 16.5% (97,904) |
10 to 14 minutes:
| Thornton: | 22.7% (1,697) |
| Idaho: | 19.2% (114,280) |
15 to 19 minutes:
| Thornton: | 10.4% (777) |
| Idaho: | 16.6% (98,780) |
20 to 24 minutes:
| Thornton: | 5.7% (428) |
| Idaho: | 12.7% (75,542) |
25 to 29 minutes:
| Thornton: | 1.7% (130) |
| Idaho: | 4.2% (25,171) |
30 to 34 minutes:
| Thornton: | 4.0% (300) |
| Idaho: | 8.8% (52,220) |
35 to 39 minutes:
| Thornton: | 0.9% (68) |
| Idaho: | 1.3% (7,971) |
40 to 44 minutes:
| Thornton: | 1.8% (137) |
| Idaho: | 1.8% (10,637) |
45 to 59 minutes:
| Thornton: | 1.4% (105) |
| Idaho: | 4.0% (23,525) |
60 to 89 minutes:
| Thornton: | 1.3% (94) |
| Idaho: | 2.7% (16,010) |
90 or more minutes:
| Thornton: | 1.7% (126) |
| Idaho: | 1.9% (11,103) |
Means of transportation to work

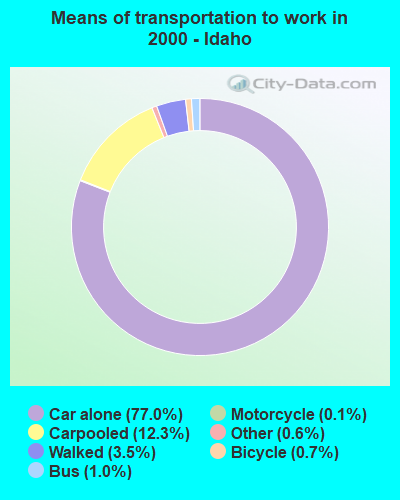
Drove car alone:
| Thornton: | 60.5% (4,517) |
| Idaho: | 77.0% (457,986) |
Carpooled:
| Thornton: | 10.4% (779) |
| Idaho: | 12.3% (73,273) |
Bus or trolley bus:
| Thornton: | 0.7% (51) |
| Idaho: | 1.0% (5,908) |
Streetcar or trolley car:
| Thornton: | 0.1% (7) |
| Idaho: | 0.0% (83) |
Motorcycle:
| Thornton: | 0.2% (16) |
| Idaho: | 0.1% (632) |
Bicycle:
| Thornton: | 0.4% (31) |
| Idaho: | 0.7% (3,942) |
Walked:
| Thornton: | 22.1% (1,650) |
| Idaho: | 3.5% (20,747) |
Other means:
| Thornton: | 0.1% (6) |
| Idaho: | 0.6% (3,786) |
Private vehicle occupancy

Drove alone:
| Thornton: | 85.3% (4,517) |
| Idaho: | 86.2% (457,986) |
In 2 person carpool:
| Thornton: | 11.4% (602) |
| Idaho: | 10.9% (57,673) |
In 3 person carpool:
| Thornton: | 2.6% (139) |
| Idaho: | 1.9% (10,359) |
In 4 person carpool:
| Thornton: | 0.5% (26) |
| Idaho: | 0.6% (3,259) |
In 5-6 person carpool:
| Thornton: | 0.2% (12) |
| Idaho: | 0.2% (1,320) |
Class of workers
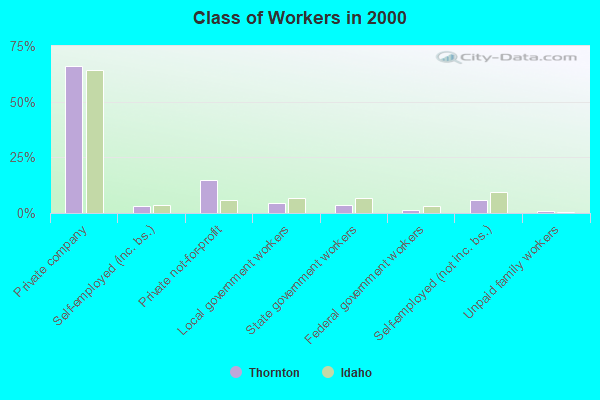
Employee of private company:
| Thornton: | 66.0% (5,047) |
| Idaho: | 64.3% (385,183) |
Self-employed in own incorporated business:
| Thornton: | 3.0% (226) |
| Idaho: | 3.8% (22,846) |
Private not-for-profit wage and salary workers:
| Thornton: | 14.6% (1,119) |
| Idaho: | 5.8% (34,500) |
Local government workers:
| Thornton: | 4.7% (359) |
| Idaho: | 6.5% (39,078) |
State government workers:
| Thornton: | 3.7% (281) |
| Idaho: | 6.7% (40,017) |
Federal government workers:
| Thornton: | 1.1% (86) |
| Idaho: | 3.2% (18,994) |
Self-employed workers in own not incorporated business:
| Thornton: | 6.0% (462) |
| Idaho: | 9.3% (56,018) |
Unpaid family workers:
| Thornton: | 0.8% (62) |
| Idaho: | 0.5% (2,817) |

Employee of private company - Males:
| Thornton: | 60.3% (2,185) |
| Idaho: | 66.4% (217,383) |
Self-employed in own incorporated business - Males:
| Thornton: | 4.8% (174) |
| Idaho: | 5.2% (17,074) |
Private not-for-profit wage and salary workers - Males:
| Thornton: | 16.2% (587) |
| Idaho: | 3.7% (12,013) |
Local government workers - Males:
| Thornton: | 3.5% (128) |
| Idaho: | 5.0% (16,503) |
State government workers - Males:
| Thornton: | 4.0% (146) |
| Idaho: | 5.3% (17,270) |
Federal government workers - Males:
| Thornton: | 1.6% (57) |
| Idaho: | 3.4% (11,135) |
Self-employed workers in own not incorporated business - Males:
| Thornton: | 9.2% (332) |
| Idaho: | 10.6% (34,822) |
Unpaid family workers - Males:
| Thornton: | 0.5% (17) |
| Idaho: | 0.4% (1,308) |

Employee of private company - Females:
| Thornton: | 71.3% (2,862) |
| Idaho: | 61.7% (167,800) |
Self-employed in own incorporated business - Females:
| Thornton: | 1.3% (52) |
| Idaho: | 2.1% (5,772) |
Private not-for-profit wage and salary workers - Females:
| Thornton: | 13.2% (532) |
| Idaho: | 8.3% (22,487) |
Local government workers - Females:
| Thornton: | 5.8% (231) |
| Idaho: | 8.3% (22,575) |
State government workers - Females:
| Thornton: | 3.4% (135) |
| Idaho: | 8.4% (22,747) |
Federal government workers - Females:
| Thornton: | 0.7% (29) |
| Idaho: | 2.9% (7,859) |
Self-employed workers in own not incorporated business - Females:
| Thornton: | 3.2% (130) |
| Idaho: | 7.8% (21,196) |
Unpaid family workers - Females:
| Thornton: | 1.1% (45) |
| Idaho: | 0.6% (1,509) |