Work and Jobs in Twin Valley, Minnesota (MN) Detailed Stats
Data:
Unemployment (%)
Unemployment (% change since 2000)
Unemployment (%) - White
Unemployment (% change since 2000) - White
Unemployment (%) - Black or African American
Unemployment (% change since 2000) - Black or African American
Unemployment (%) - Asian
Unemployment (% change since 2000) - Asian
Unemployment (%) - Hispanic or Latino
Unemployment (% change since 2000) - Hispanic or Latino
Unemployment (%) - American Indian and Alaska Native
Unemployment (% change since 2000) - American Indian and Alaska Native
Unemployment (%) - Multirace
Unemployment (% change since 2000) - Multirace
Unemployment (%) - Other Race
Unemployment (% change since 2000) - Other Race
Industry diversity
Most Common Industries - Agriculture, forestry, fishing and hunting, and mining (%)
Most Common Industries - Agriculture, forestry, fishing and hunting (%)
Most Common Industries - Mining, quarrying, and oil and gas extraction (%)
Most Common Industries - Construction (%)
Most Common Industries - Manufacturing (%)
Most Common Industries - Wholesale trade (%)
Most Common Industries - Retail trade (%)
Most Common Industries - Transportation and warehousing, and utilities (%)
Most Common Industries - Transportation and warehousing (%)
Most Common Industries - Utilities (%)
Most Common Industries - Information (%)
Most Common Industries - Finance and insurance, and real estate and rental and leasing (%)
Most Common Industries - Finance and insurance (%)
Most Common Industries - Real estate and rental and leasing (%)
Most Common Industries - Professional, scientific, and management, and administrative and waste management services (%)
Most Common Industries - Professional, scientific, and technical services (%)
Most Common Industries - Management of companies and enterprises (%)
Most Common Industries - Administrative and support and waste management services (%)
Most Common Industries - Educational services, and health care and social assistance (%)
Most Common Industries - Educational services (%)
Most Common Industries - Health care and social assistance (%)
Most Common Industries - Arts, entertainment, and recreation, and accommodation and food services (%)
Most Common Industries - Arts, entertainment, and recreation (%)
Most Common Industries - Accommodation and food services (%)
Most Common Industries - Other services, except public administration (%)
Most Common Industries - Public administration (%)
Occupation diversity
Most Common Occupations - Management, business, science, and arts occupations (%)
Most Common Occupations - Management, business, and financial occupations (%)
Most Common Occupations - Management occupations (%)
Most Common Occupations - Business and financial operations occupations (%)
Most Common Occupations - Computer, engineering, and science occupations (%)
Most Common Occupations - Computer and mathematical occupations (%)
Most Common Occupations - Architecture and engineering occupations (%)
Most Common Occupations - Life, physical, and social science occupations (%)
Most Common Occupations - Education, legal, community service, arts, and media occupations (%)
Most Common Occupations - Community and social service occupations (%)
Most Common Occupations - Legal occupations (%)
Most Common Occupations - Education, training, and library occupations (%)
Most Common Occupations - Arts, design, entertainment, sports, and media occupations (%)
Most Common Occupations - Healthcare practitioners and technical occupations (%)
Most Common Occupations - Health diagnosing and treating practitioners and other technical occupations (%)
Most Common Occupations - Health technologists and technicians (%)
Most Common Occupations - Service occupations (%)
Most Common Occupations - Healthcare support occupations (%)
Most Common Occupations - Protective service occupations (%)
Most Common Occupations - Fire fighting and prevention, and other protective service workers including supervisors (%)
Most Common Occupations - Law enforcement workers including supervisors (%)
Most Common Occupations - Food preparation and serving related occupations (%)
Most Common Occupations - Building and grounds cleaning and maintenance occupations (%)
Most Common Occupations - Personal care and service occupations (%)
Most Common Occupations - Sales and office occupations (%)
Most Common Occupations - Sales and related occupations (%)
Most Common Occupations - Office and administrative support occupations (%)
Most Common Occupations - Natural resources, construction, and maintenance occupations (%)
Most Common Occupations - Farming, fishing, and forestry occupations (%)
Most Common Occupations - Construction and extraction occupations (%)
Most Common Occupations - Installation, maintenance, and repair occupations (%)
Most Common Occupations - Production, transportation, and material moving occupations (%)
Most Common Occupations - Production occupations (%)
Most Common Occupations - Transportation occupations (%)
Most Common Occupations - Material moving occupations (%)
Private vehicle occupancy - Drove alone (% change since 2000)
Private vehicle occupancy - Carpooled (%)
Private vehicle occupancy - Carpooled (% change since 2000)
Private vehicle occupancy - In 2-person carpool (%)
Private vehicle occupancy - In 2-person carpool (% change since 2000)
Private vehicle occupancy - In 3-person carpool (%)
Private vehicle occupancy - In 3-person carpool (% change since 2000)
Private vehicle occupancy - In 4-person carpool (%)
Private vehicle occupancy - In 4-person carpool (% change since 2000)
Private vehicle occupancy - In 5- or 6-person carpool (%)
Private vehicle occupancy - In 5- or 6-person carpool (% change since 2000)
Private vehicle occupancy - In 7-or-more-person carpool (%)
Private vehicle occupancy - In 7-or-more-person carpool (% change since 2000)
Time Leaving Home To Go To Work - 12:00 a.m. to 4:59 a.m. (%)
Time Leaving Home To Go To Work - 12:00 a.m. to 4:59 a.m. (% change since 2000)
Time Leaving Home To Go To Work - 5:00 a.m. to 5:59 a.m. (%)
Time Leaving Home To Go To Work - 5:00 a.m. to 5:59 a.m. (% change since 2000)
Time Leaving Home To Go To Work - 6:00 a.m. to 6:59 a.m. (%)
Time Leaving Home To Go To Work - 6:00 a.m. to 6:59 a.m. (% change since 2000)
Time Leaving Home To Go To Work - 7:00 a.m. to 7:59 a.m. (%)
Time Leaving Home To Go To Work - 7:00 a.m. to 7:59 a.m. (% change since 2000)
Time Leaving Home To Go To Work - 8:00 a.m. to 8:59 a.m. (%)
Time Leaving Home To Go To Work - 8:00 a.m. to 8:59 a.m. (% change since 2000)
Time Leaving Home To Go To Work - 9:00 a.m. to 9:59 a.m. (%)
Time Leaving Home To Go To Work - 9:00 a.m. to 9:59 a.m. (% change since 2000)
Time Leaving Home To Go To Work - 10:00 a.m. to 10:59 a.m. (%)
Time Leaving Home To Go To Work - 10:00 a.m. to 10:59 a.m. (% change since 2000)
Time Leaving Home To Go To Work - 11:00 a.m. to 11:59 a.m. (%)
Time Leaving Home To Go To Work - 11:00 a.m. to 11:59 a.m. (% change since 2000)
Time Leaving Home To Go To Work - 12:00 p.m. to 3:59 p.m. (%)
Time Leaving Home To Go To Work - 12:00 p.m. to 3:59 p.m. (% change since 2000)
Time Leaving Home To Go To Work - 4:00 p.m. to 11:59 p.m. (%)
Time Leaving Home To Go To Work - 4:00 p.m. to 11:59 p.m. (% change since 2000)
Class of Workers - Employee of private company (%)
Class of Workers - Employee of private company (% change since 2000)
Class of Workers - Self-employed in own incorporated business (%)
Class of Workers - Self-employed in own incorporated business (% change since 2000)
Class of Workers - Private not-for-profit wage and salary workers (%)
Class of Workers - Private not-for-profit wage and salary workers (% change since 2000)
Class of Workers - Local government workers (%)
Class of Workers - Local government workers (% change since 2000)
Class of Workers - State government workers (%)
Class of Workers - State government workers (% change since 2000)
Class of Workers - Federal government workers (%)
Class of Workers - Federal government workers (% change since 2000)
Class of Workers - Self-employed workers in own not incorporated business and Unpaid family workers (%)
Class of Workers - Self-employed workers in own not incorporated business and Unpaid family workers (% change since 2000)
Means of transportation to work - Drove car alone (%)
Means of transportation to work - Drove car alone (% change since 2000)
Means of transportation to work - Carpooled (%)
Means of transportation to work - Carpooled (% change since 2000)
Means of transportation to work - Public transportation (%)
Means of transportation to work - Public transportation (% change since 2000)
Means of transportation to work - Bus or trolley bus (%)
Means of transportation to work - Bus or trolley bus (% change since 2000)
Means of transportation to work - Streetcar or trolley car (%)
Means of transportation to work - Streetcar or trolley car (% change since 2000)
Means of transportation to work - Subway or elevated (%)
Means of transportation to work - Subway or elevated (% change since 2000)
Means of transportation to work - Railroad (%)
Means of transportation to work - Railroad (% change since 2000)
Means of transportation to work - Ferryboat (%)
Means of transportation to work - Ferryboat (% change since 2000)
Means of transportation to work - Taxicab (%)
Means of transportation to work - Taxicab (% change since 2000)
Means of transportation to work - Motorcycle (%)
Means of transportation to work - Motorcycle (% change since 2000)
Means of transportation to work - Bicycle (%)
Means of transportation to work - Bicycle (% change since 2000)
Means of transportation to work - Walked (%)
Means of transportation to work - Walked (% change since 2000)
Means of transportation to work - Other means (%)
Means of transportation to work - Other means (% change since 2000)
Working at home (%)
Working at home (% change since 2000)
Travel time to work - Less than 5 minutes (%)
Travel time to work - Less than 5 minutes (% change since 2000)
Travel time to work - 5 to 9 minutes (%)
Travel time to work - 5 to 9 minutes (% change since 2000)
Travel time to work - 10 to 19 minutes (%)
Travel time to work - 10 to 19 minutes (% change since 2000)
Travel time to work - 20 to 29 minutes (%)
Travel time to work - 20 to 29 minutes (% change since 2000)
Travel time to work - 30 to 39 minutes (%)
Travel time to work - 30 to 39 minutes (% change since 2000)
Travel time to work - 40 to 59 minutes (%)
Travel time to work - 40 to 59 minutes (% change since 2000)
Travel time to work - 60 to 89 minutes (%)
Travel time to work - 60 to 89 minutes (% change since 2000)
Travel time to work - 90 or more minutes (%)
Travel time to work - 90 or more minutes (% change since 2000)
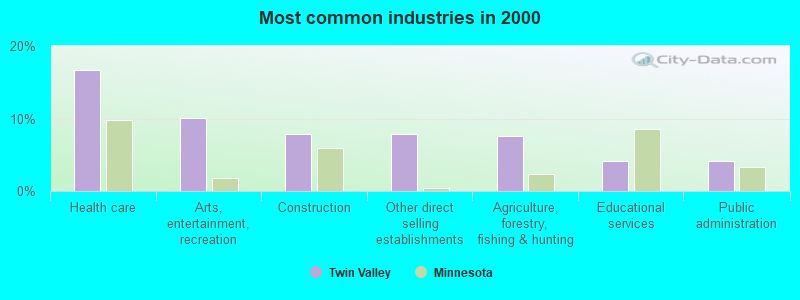
The most common industries in Twin Valley are: Health care (16.7% of civilian employees), Arts, entertainment, recreation (10.1% of civilian employees), Construction (7.9% of civilian employees). 56.3% of workers work in Norman County and 11.5% of all workers work at home. 63.3% of workers are employees of private companies, which is 4.0% less than the rate of 65.9% across the entire state of Minnesota.
Whole page based on the data from 2000 / 2022 when the population of Twin Valley, Minnesota was 865 / 714
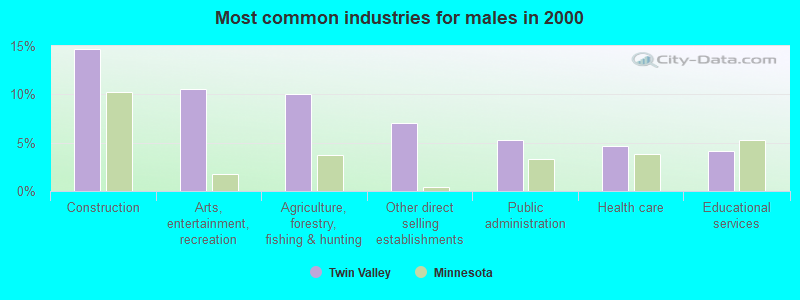
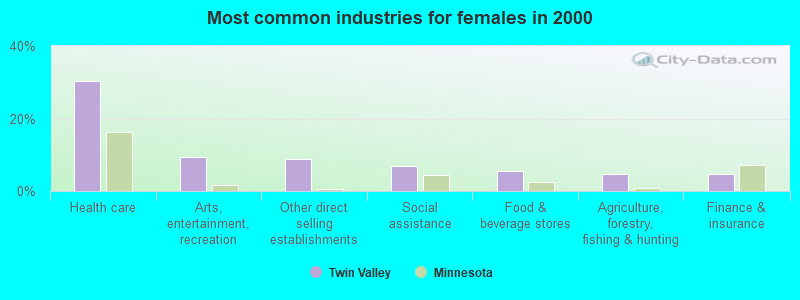
Most common industries
Most common industries Industry All Males Females
Health care 16.7% 4.7% 30.4% Arts, entertainment, and recreation 10.1% 10.6% 9.5% Construction 7.9% 14.7% 0.0% Other direct selling establishments 7.9% 7.1% 8.8% Agriculture, forestry, fishing and hunting 7.5% 10.0% 4.7% Educational services 4.1% 4.1% 4.1% Public administration 4.1% 5.3% 2.7% Food and beverage stores 3.8% 2.4% 5.4% Finance and insurance 3.5% 2.4% 4.7% Social assistance 3.1% 0.0% 6.8% Administrative and support and waste management services 3.1% 2.4% 4.1% Publishing, and motion picture and sound recording industries 3.1% 2.4% 4.1% Personal and laundry services 1.9% 1.2% 2.7% Building material and garden equipment and supplies dealers 1.9% 2.4% 1.4% Truck transportation 1.9% 3.5% 0.0% Metal and metal products 1.9% 3.5% 0.0% Pharmacies and drug stores 1.9% 1.2% 2.7% Department and other general merchandise stores 1.6% 1.2% 2.0% Motor vehicle and parts dealers 1.3% 2.4% 0.0% Broadcasting and telecommunications 1.3% 1.2% 1.4% Religious, grantmaking, civic, professional, and similar organizations 1.3% 2.4% 0.0% Fuel dealers 0.9% 1.8% 0.0% Repair and maintenance 0.9% 1.8% 0.0% Private households 0.9% 0.0% 2.0% Gasoline stations 0.6% 0.0% 1.4% Miscellaneous manufacturing 0.6% 1.2% 0.0% Furniture and home furnishings, and household appliance stores 0.6% 0.0% 1.4% Miscellaneous nondurable goods merchant wholesalers 0.6% 1.2% 0.0% U. S. Postal service 0.6% 1.2% 0.0% Other transportation, and support activities, and couriers 0.6% 1.2% 0.0% Warehousing and storage 0.6% 1.2% 0.0% Farm supplies merchant wholesalers 0.6% 1.2% 0.0% Real estate and rental and leasing 0.6% 1.2% 0.0% Motor vehicles, parts and supplies merchant wholesalers 0.6% 1.2% 0.0% Farm product raw materials merchant wholesalers 0.6% 1.2% 0.0% Accommodation and food services 0.6% 1.2% 0.0%
Unemployment in Twin Valley Unemployment by race in 2022
Unemployment rate for White non-Hispanic residents 3.6% Males7.1% FemalesUnemployment rate for Black residents 100.0% MalesUnemployment rate for American Indian and Alaska Native residents 22.3% MalesUnemployment rate for two or more race residents 32.0% FemalesUnemployment rate for Hispanic or Latino residents 62.8% MalesUnemployment by race in 2000
Unemployment rate for White non-Hispanic residents 7.5% Males1.4% Females
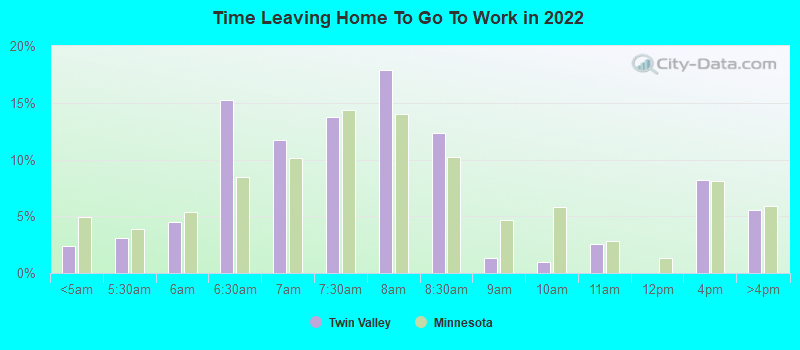
Time leaving home to go to work 12:00 a.m. to 4:59 a.m.: Twin Valley:
2.3% (5)Minnesota:
4.9% (120,781)
5:00 a.m. to 5:29 a.m.: Twin Valley:
3.1% (7)Minnesota:
3.8% (94,357)
5:30 a.m. to 5:59 a.m.: Twin Valley:
4.5% (10)Minnesota:
5.3% (131,116)
6:00 a.m. to 6:29 a.m.: Twin Valley:
15.2% (33)Minnesota:
8.4% (206,641)
6:30 a.m. to 6:59 a.m.: Twin Valley:
11.7% (25)Minnesota:
10.2% (249,032)
7:00 a.m. to 7:29 a.m.: Twin Valley:
13.7% (30)Minnesota:
14.4% (352,698)
7:30 a.m. to 7:59 a.m.: Twin Valley:
17.9% (39)Minnesota:
14.0% (344,046)
8:00 a.m. to 8:29 a.m.: Twin Valley:
12.3% (27)Minnesota:
10.2% (250,244)
8:30 a.m. to 8:59 a.m.: Twin Valley:
1.3% (3)Minnesota:
4.6% (113,732)
9:00 a.m. to 9:59 a.m.: Twin Valley:
0.9% (2)Minnesota:
5.8% (143,250)
10:00 a.m. to 10:59 a.m.: Twin Valley:
2.5% (5)Minnesota:
2.8% (69,598)
12:00 p.m. to 3:59 p.m.: Twin Valley:
8.2% (18)Minnesota:
8.1% (199,389)
4:00 p.m. to 11:59 p.m.: Twin Valley:
5.6% (12)Minnesota:
5.9% (144,679)
<5am: Twin Valley:
3.5% (11)Minnesota:
2.8% (70,312)
5:30am: Twin Valley:
2.2% (7)Minnesota:
2.8% (70,053)
6am: Twin Valley:
6.1% (19)Minnesota:
4.7% (119,123)
6:30am: Twin Valley:
7.3% (23)Minnesota:
8.1% (206,893)
7am: Twin Valley:
8.6% (27)Minnesota:
10.8% (275,657)
7:30am: Twin Valley:
10.2% (32)Minnesota:
14.6% (371,966)
8am: Twin Valley:
18.5% (58)Minnesota:
16.2% (410,487)
8:30am: Twin Valley:
11.5% (36)Minnesota:
9.2% (233,326)
9am: Twin Valley:
3.5% (11)Minnesota:
4.3% (109,027)
10am: Twin Valley:
4.8% (15)Minnesota:
4.6% (117,544)
11am: Twin Valley:
3.2% (10)Minnesota:
1.9% (48,795)
4pm: Twin Valley:
13.4% (42)Minnesota:
7.7% (195,126)
>4pm: Twin Valley:
4.8% (15)Minnesota:
6.8% (171,607)
12:00 a.m. to 4:59 a.m. - Males: Twin Valley:
2.9% (3)Minnesota:
6.3% (82,514)
5:00 a.m. to 5:29 a.m. - Males: Twin Valley:
6.7% (7)Minnesota:
5.4% (70,578)
5:30 a.m. to 5:59 a.m. - Males: Twin Valley:
6.7% (7)Minnesota:
6.6% (86,477)
6:00 a.m. to 6:29 a.m. - Males: Twin Valley:
20.6% (21)Minnesota:
9.7% (127,243)
6:30 a.m. to 6:59 a.m. - Males: Twin Valley:
22.0% (23)Minnesota:
10.4% (136,365)
7:00 a.m. to 7:29 a.m. - Males: Twin Valley:
2.7% (3)Minnesota:
13.7% (179,738)
7:30 a.m. to 7:59 a.m. - Males: Twin Valley:
7.6% (8)Minnesota:
12.0% (158,107)
8:00 a.m. to 8:29 a.m. - Males: Twin Valley:
17.3% (18)Minnesota:
9.4% (123,700)
9:00 a.m. to 9:59 a.m. - Males: Twin Valley:
2.0% (2)Minnesota:
5.3% (69,327)
10:00 a.m. to 10:59 a.m. - Males: Twin Valley:
2.1% (2)Minnesota:
2.4% (32,133)
4:00 p.m. to 11:59 p.m. - Males: Twin Valley:
9.1% (9)Minnesota:
5.9% (77,278)
12:00 a.m. to 4:59 a.m. - Females: Twin Valley:
1.9% (2)Minnesota:
3.4% (38,267)
5:30 a.m. to 5:59 a.m. - Females: Twin Valley:
2.6% (3)Minnesota:
3.9% (44,639)
6:00 a.m. to 6:29 a.m. - Females: Twin Valley:
10.4% (12)Minnesota:
7.0% (79,398)
6:30 a.m. to 6:59 a.m. - Females: Twin Valley:
2.5% (3)Minnesota:
9.9% (112,667)
7:00 a.m. to 7:29 a.m. - Females: Twin Valley:
23.4% (26)Minnesota:
15.2% (172,960)
7:30 a.m. to 7:59 a.m. - Females: Twin Valley:
27.7% (31)Minnesota:
16.4% (185,939)
8:00 a.m. to 8:29 a.m. - Females: Twin Valley:
7.8% (9)Minnesota:
11.1% (126,544)
8:30 a.m. to 8:59 a.m. - Females: Twin Valley:
2.6% (3)Minnesota:
5.6% (63,762)
10:00 a.m. to 10:59 a.m. - Females: Twin Valley:
2.9% (3)Minnesota:
3.3% (37,465)
12:00 p.m. to 3:59 p.m. - Females: Twin Valley:
15.6% (18)Minnesota:
8.2% (93,074)
4:00 p.m. to 11:59 p.m. - Females: Twin Valley:
2.4% (3)Minnesota:
5.9% (67,401)
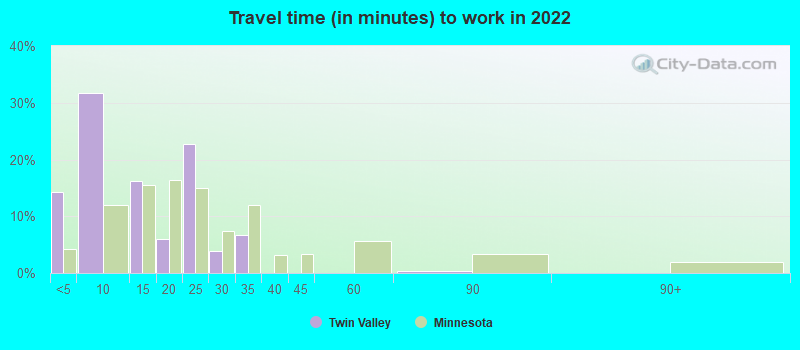
Travel time to work Percentage of workers working in this county: 56.3%Number of people working at home: 29 (11.5% of all workers )
Less than 5 minutes: Twin Valley:
14.2% (32)Minnesota:
4.2% (103,861)
5 to 9 minutes: Twin Valley:
31.7% (70)Minnesota:
12.0% (295,785)
10 to 14 minutes: Twin Valley:
16.3% (36)Minnesota:
15.5% (380,826)
15 to 19 minutes: Twin Valley:
5.9% (13)Minnesota:
16.5% (404,549)
20 to 24 minutes: Twin Valley:
22.7% (50)Minnesota:
15.0% (367,833)
25 to 29 minutes: Twin Valley:
3.9% (9)Minnesota:
7.4% (182,328)
30 to 34 minutes: Twin Valley:
6.7% (15)Minnesota:
12.0% (294,767)
60 to 89 minutes: Twin Valley:
0.4% (1)Minnesota:
3.3% (81,373)
Less than 5 minutes: Twin Valley:
13.7% (43)Minnesota:
4.4% (112,704)
5 to 9 minutes: Twin Valley:
29.4% (92)Minnesota:
13.3% (338,699)
10 to 14 minutes: Twin Valley:
8.6% (27)Minnesota:
15.9% (403,004)
15 to 19 minutes: Twin Valley:
8.0% (25)Minnesota:
15.1% (384,560)
20 to 24 minutes: Twin Valley:
13.1% (41)Minnesota:
14.4% (365,773)
25 to 29 minutes: Twin Valley:
5.1% (16)Minnesota:
6.2% (158,419)
30 to 34 minutes: Twin Valley:
4.8% (15)Minnesota:
11.1% (282,272)
35 to 39 minutes: Twin Valley:
0.6% (2)Minnesota:
2.5% (63,572)
45 to 59 minutes: Twin Valley:
2.6% (8)Minnesota:
5.3% (133,528)
60 to 89 minutes: Twin Valley:
11.2% (35)Minnesota:
2.7% (69,503)
90 or more minutes: Twin Valley:
0.6% (2)Minnesota:
1.5% (38,735)
Less than 5 minutes - Males: Twin Valley:
24.6% (23)Minnesota:
4.1% (54,466)
5 to 9 minutes - Males: Twin Valley:
22.9% (21)Minnesota:
11.1% (146,289)
10 to 14 minutes - Males: Twin Valley:
17.4% (16)Minnesota:
14.4% (189,693)
15 to 19 minutes - Males: Twin Valley:
3.3% (3)Minnesota:
15.5% (204,410)
20 to 24 minutes - Males: Twin Valley:
23.2% (21)Minnesota:
15.1% (199,117)
25 to 29 minutes - Males: Twin Valley:
3.1% (3)Minnesota:
7.3% (96,577)
30 to 34 minutes - Males: Twin Valley:
7.1% (7)Minnesota:
12.5% (163,847)
60 to 89 minutes - Males: Twin Valley:
1.0% (1)Minnesota:
4.1% (53,961)
Less than 5 minutes - Females: Twin Valley:
6.7% (9)Minnesota:
4.3% (49,395)
5 to 9 minutes - Females: Twin Valley:
37.7% (49)Minnesota:
13.1% (149,496)
10 to 14 minutes - Females: Twin Valley:
15.5% (20)Minnesota:
16.7% (191,133)
15 to 19 minutes - Females: Twin Valley:
7.9% (10)Minnesota:
17.5% (200,139)
20 to 24 minutes - Females: Twin Valley:
22.2% (29)Minnesota:
14.8% (168,716)
25 to 29 minutes - Females: Twin Valley:
4.4% (6)Minnesota:
7.5% (85,751)
30 to 34 minutes - Females: Twin Valley:
6.5% (8)Minnesota:
11.5% (130,920)
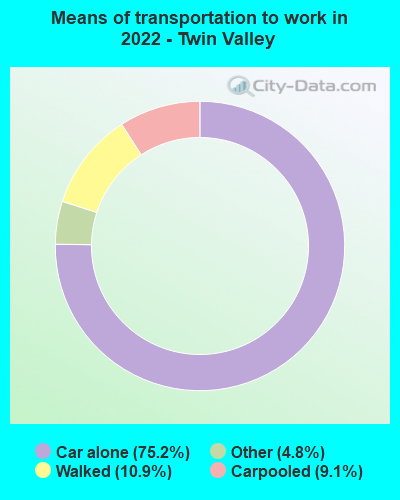
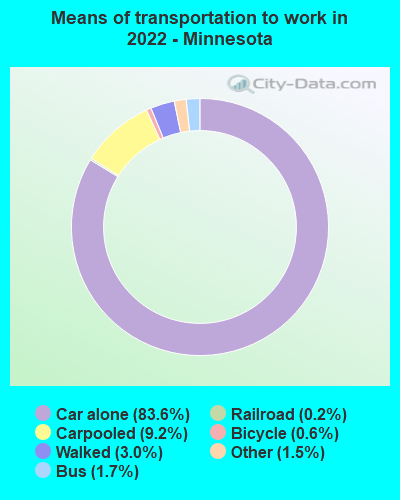
Means of transportation to work Drove car alone: Twin Valley:
75.2% (174)Minnesota:
83.6% (951,223)
Carpooled: Twin Valley:
9.1% (21)Minnesota:
9.2% (113,324)
Walked: Twin Valley:
10.9% (25)Minnesota:
3.0% (35,804)
Other means: Twin Valley:
4.8% (11)Minnesota:
1.5% (16,136)
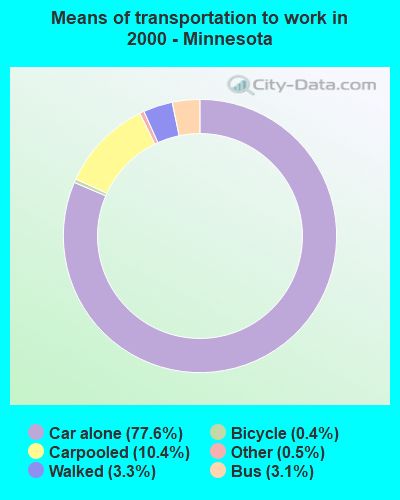
Drove car alone: Twin Valley:
71.6% (224)Minnesota:
77.6% (1,971,668)
Carpooled: Twin Valley:
14.4% (45)Minnesota:
10.4% (264,690)
Walked: Twin Valley:
10.9% (34)Minnesota:
3.3% (84,148)
Other means: Twin Valley:
1.0% (3)Minnesota:
0.5% (11,732)
Drove car alone - Males: Twin Valley:
84.2% (80)Minnesota:
84.0% (951,223)
Carpooled - Males: Twin Valley:
2.1% (2)Minnesota:
8.7% (113,324)
Walked - Males: Twin Valley:
8.4% (8)Minnesota:
3.0% (35,804)
Other means - Males: Twin Valley:
5.3% (5)Minnesota:
1.7% (16,136)
Drove car alone - Females: Twin Valley:
68.9% (94)Minnesota:
83.2% (951,223)
Carpooled - Females: Twin Valley:
14.1% (19)Minnesota:
9.9% (113,324)
Walked - Females: Twin Valley:
12.6% (17)Minnesota:
3.1% (35,804)
Other means - Females: Twin Valley:
4.4% (6)Minnesota:
1.4% (16,136)
Private vehicle occupancy Drove alone: Twin Valley:
89.4% (177)Minnesota:
90.0% (2,050,351)
In 2 person carpool: Twin Valley:
10.3% (20)Minnesota:
7.3% (166,995)
Drove alone: Twin Valley:
83.3% (224)Minnesota:
88.2% (1,971,668)
In 2 person carpool: Twin Valley:
16.4% (44)Minnesota:
9.6% (215,251)
In 4 person carpool: Twin Valley:
0.4% (1)Minnesota:
0.5% (10,144)
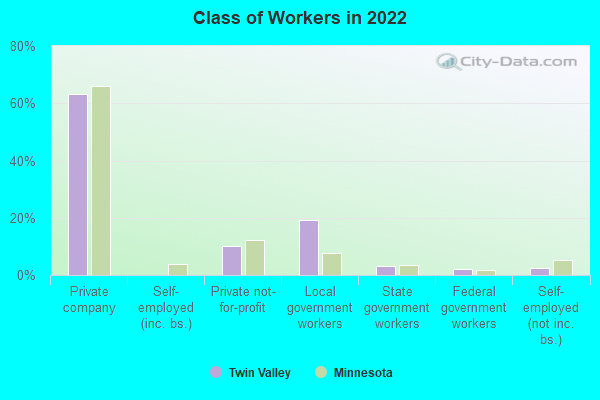
Class of workers
Employee of private company: Twin Valley:
63.3% (165)Minnesota:
65.9% (1,982,190)
Private not-for-profit wage and salary workers: Twin Valley:
10.0% (26)Minnesota:
12.1% (364,175)
Local government workers: Twin Valley:
19.3% (50)Minnesota:
7.5% (226,630)
State government workers: Twin Valley:
3.1% (8)Minnesota:
3.4% (102,331)
Federal government workers: Twin Valley:
1.9% (5)Minnesota:
1.6% (48,213)
Self-employed workers in own not incorporated business: Twin Valley:
2.3% (6)Minnesota:
5.3% (160,154)
Employee of private company: Twin Valley:
63.8% (203)Minnesota:
67.7% (1,747,303)
Self-employed in own incorporated business: Twin Valley:
3.5% (11)Minnesota:
3.3% (85,391)
Private not-for-profit wage and salary workers: Twin Valley:
18.6% (59)Minnesota:
9.4% (241,738)
Local government workers: Twin Valley:
7.9% (25)Minnesota:
6.8% (175,282)
Federal government workers: Twin Valley:
0.6% (2)Minnesota:
1.6% (41,691)
Self-employed workers in own not incorporated business: Twin Valley:
5.7% (18)Minnesota:
6.9% (178,586)
Employee of private company - Males: Twin Valley:
71.8% (90)Minnesota:
71.5% (1,128,925)
Private not-for-profit wage and salary workers - Males: Twin Valley:
11.3% (14)Minnesota:
7.4% (117,071)
Local government workers - Males: Twin Valley:
13.7% (17)Minnesota:
5.3% (83,941)
Self-employed workers in own not incorporated business - Males: Twin Valley:
3.2% (4)Minnesota:
6.0% (94,953)
Employee of private company - Females: Twin Valley:
55.6% (75)Minnesota:
59.6% (853,265)
Private not-for-profit wage and salary workers - Females: Twin Valley:
8.9% (12)Minnesota:
17.3% (247,104)
Local government workers - Females: Twin Valley:
24.4% (33)Minnesota:
10.0% (142,689)
State government workers - Females: Twin Valley:
5.9% (8)Minnesota:
4.0% (57,636)
Federal government workers - Females: Twin Valley:
3.7% (5)Minnesota:
1.6% (22,365)
Self-employed workers in own not incorporated business - Females: Twin Valley:
1.5% (2)Minnesota:
4.6% (65,201)