Work and Jobs in Tyler Run-Queens Gate, Pennsylvania (PA) Detailed Stats
Occupations, Industries, Unemployment, Workers, Commute

Discuss Tyler Run-Queens Gate, Pennsylvania work on our local forum with over 2,400,000 registered users
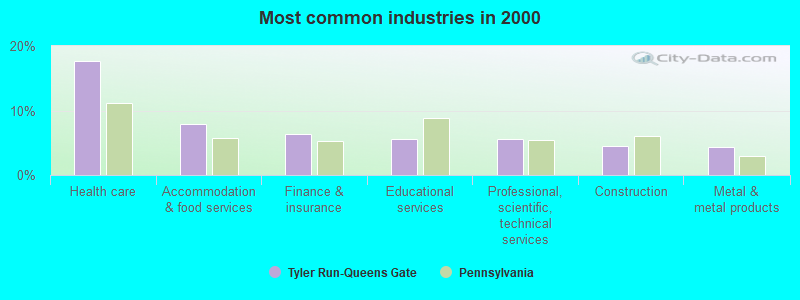
The most common industries in Tyler Run-Queens Gate are: Health care (17.7% of civilian employees), Accommodation & food services (7.9% of civilian employees), Finance & insurance (6.3% of civilian employees). 74.1% of workers are employees of private companies, which is 5.9% greater than the rate of 69.7% across the entire state of Pennsylvania.
Most common industries
Most common industries | |||
|---|---|---|---|
Industry | All | Males | Females |
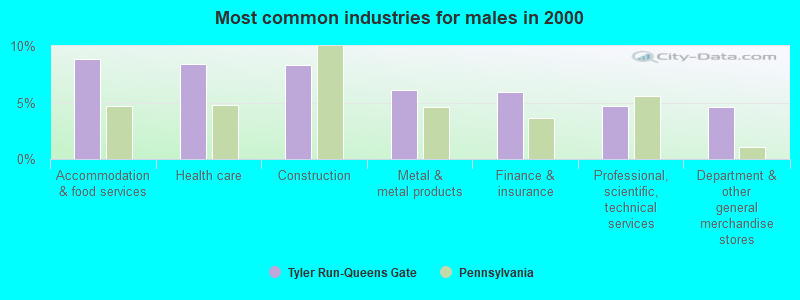
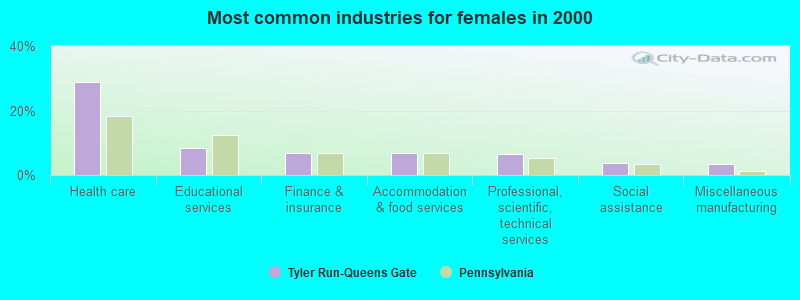
| Health care | 17.7% (260) | 8.4% (68) | 28.9% (192) |
| Accommodation and food services | 7.9% (116) | 8.8% (71) | 6.8% (45) |
| Finance and insurance | 6.3% (93) | 6.0% (48) | 6.8% (45) |
| Educational services | 5.6% (82) | 3.2% (26) | 8.4% (56) |
| Professional, scientific, and technical services | 5.6% (82) | 4.7% (38) | 6.6% (44) |
| Construction | 4.6% (67) | 8.3% (67) | 0.0% (0) |
| Metal and metal products | 4.3% (63) | 6.1% (49) | 2.1% (14) |
| Department and other general merchandise stores | 3.5% (51) | 4.6% (37) | 2.1% (14) |
| Administrative and support and waste management services | 2.6% (38) | 2.0% (16) | 3.3% (22) |
| Public administration | 2.5% (37) | 3.0% (24) | 2.0% (13) |
| Motor vehicle and parts dealers | 2.2% (33) | 3.2% (26) | 1.1% (7) |
| Miscellaneous manufacturing | 2.1% (31) | 1.0% (8) | 3.5% (23) |
| Machinery | 2.1% (31) | 3.8% (31) | 0.0% (0) |
| Food and beverage stores | 2.0% (29) | 2.6% (21) | 1.2% (8) |
| Radio, TV, and computer stores | 1.8% (26) | 3.2% (26) | 0.0% (0) |
| Other transportation, and support activities, and couriers | 1.7% (25) | 3.1% (25) | 0.0% (0) |
| Social assistance | 1.6% (24) | 0.0% (0) | 3.6% (24) |
| Transportation equipment | 1.6% (24) | 3.0% (24) | 0.0% (0) |
| Real estate and rental and leasing | 1.6% (23) | 1.9% (15) | 1.2% (8) |
| Miscellaneous durable goods merchant wholesalers | 1.6% (23) | 2.1% (17) | 0.9% (6) |
| Computer and electronic products | 1.5% (22) | 2.7% (22) | 0.0% (0) |
| Printing and related support activities | 1.3% (19) | 2.4% (19) | 0.0% (0) |
| Broadcasting and telecommunications | 1.3% (19) | 0.6% (5) | 2.1% (14) |
| Electrical equipment, appliances, and components | 1.2% (18) | 0.0% (0) | 2.7% (18) |
| Nonmetallic mineral products | 1.1% (16) | 0.0% (0) | 2.4% (16) |
| Electrical and electronic goods merchant wholesalers | 1.1% (16) | 1.1% (9) | 1.1% (7) |
| Arts, entertainment, and recreation | 1.0% (14) | 0.0% (0) | 2.1% (14) |
| Truck transportation | 0.9% (13) | 1.6% (13) | 0.0% (0) |
| Personal and laundry services | 0.9% (13) | 1.1% (9) | 0.6% (4) |
| Warehousing and storage | 0.8% (12) | 0.0% (0) | 1.8% (12) |
| Paper | 0.8% (12) | 0.0% (0) | 1.8% (12) |
| Apparel | 0.8% (12) | 0.0% (0) | 1.8% (12) |
| Food | 0.7% (11) | 1.4% (11) | 0.0% (0) |
| Professional and commercial equipment and supplies merchant wholesalers | 0.7% (11) | 0.0% (0) | 1.7% (11) |
| Pharmacies and drug stores | 0.7% (10) | 1.2% (10) | 0.0% (0) |
| Furniture and related product manufacturing | 0.7% (10) | 1.2% (10) | 0.0% (0) |
| Religious, grantmaking, civic, professional, and similar organizations | 0.7% (10) | 1.2% (10) | 0.0% (0) |
| Retail florists | 0.6% (9) | 1.1% (9) | 0.0% (0) |
| Office supplies and stationery stores | 0.6% (9) | 1.1% (9) | 0.0% (0) |
| Plastics and rubber products | 0.6% (9) | 0.0% (0) | 1.4% (9) |
| Used merchandise, gift, novelty, and souvenir, and other miscellaneous stores | 0.5% (8) | 0.0% (0) | 1.2% (8) |
| Machinery, equipment, and supplies merchant wholesalers | 0.5% (8) | 1.0% (8) | 0.0% (0) |
| Repair and maintenance | 0.5% (8) | 1.0% (8) | 0.0% (0) |
| Paper and paper products merchant wholesalers | 0.5% (7) | 0.9% (7) | 0.0% (0) |
| Publishing, and motion picture and sound recording industries | 0.5% (7) | 0.0% (0) | 1.1% (7) |
| Agriculture, forestry, fishing and hunting | 0.4% (6) | 0.7% (6) | 0.0% (0) |
| Sporting goods, camera, and hobby and toy stores | 0.3% (4) | 0.5% (4) | 0.0% (0) |
Unemployment in Tyler Run-Queens Gate
- Unemployment by race in 2000
- Unemployment rate for White non-Hispanic residents
- 4.3%Males
- 2.9%Females
Time leaving home to go to work

<5am:
| Tyler Run-Queens Gate: | 4.0% (58) |
| Pennsylvania: | 3.1% (172,304) |
5:30am:
| Tyler Run-Queens Gate: | 1.4% (20) |
| Pennsylvania: | 2.7% (150,168) |
6am:
| Tyler Run-Queens Gate: | 3.3% (48) |
| Pennsylvania: | 4.4% (245,004) |
6:30am:
| Tyler Run-Queens Gate: | 4.8% (70) |
| Pennsylvania: | 8.6% (478,636) |
7am:
| Tyler Run-Queens Gate: | 15.1% (221) |
| Pennsylvania: | 10.8% (599,808) |
7:30am:
| Tyler Run-Queens Gate: | 17.1% (250) |
| Pennsylvania: | 13.7% (759,372) |
8am:
| Tyler Run-Queens Gate: | 14.0% (204) |
| Pennsylvania: | 14.9% (826,968) |
8:30am:
| Tyler Run-Queens Gate: | 12.4% (181) |
| Pennsylvania: | 10.6% (588,440) |
9am:
| Tyler Run-Queens Gate: | 5.4% (79) |
| Pennsylvania: | 5.5% (304,765) |
10am:
| Tyler Run-Queens Gate: | 6.2% (91) |
| Pennsylvania: | 5.1% (280,812) |
11am:
| Tyler Run-Queens Gate: | 3.2% (47) |
| Pennsylvania: | 2.1% (114,676) |
12pm:
| Tyler Run-Queens Gate: | 1.9% (28) |
| Pennsylvania: | 1.0% (57,867) |
4pm:
| Tyler Run-Queens Gate: | 5.3% (78) |
| Pennsylvania: | 7.3% (404,775) |
>4pm:
| Tyler Run-Queens Gate: | 3.6% (52) |
| Pennsylvania: | 7.3% (408,070) |
Travel time to work


Less than 5 minutes:
| Tyler Run-Queens Gate: | 6.4% (94) |
| Pennsylvania: | 3.5% (196,492) |
5 to 9 minutes:
| Tyler Run-Queens Gate: | 15.8% (231) |
| Pennsylvania: | 11.1% (615,919) |
10 to 14 minutes:
| Tyler Run-Queens Gate: | 19.5% (285) |
| Pennsylvania: | 14.9% (825,199) |
15 to 19 minutes:
| Tyler Run-Queens Gate: | 21.8% (319) |
| Pennsylvania: | 15.0% (836,006) |
20 to 24 minutes:
| Tyler Run-Queens Gate: | 12.5% (182) |
| Pennsylvania: | 14.1% (782,790) |
25 to 29 minutes:
| Tyler Run-Queens Gate: | 3.1% (46) |
| Pennsylvania: | 5.9% (327,459) |
30 to 34 minutes:
| Tyler Run-Queens Gate: | 5.3% (77) |
| Pennsylvania: | 11.8% (655,811) |
35 to 39 minutes:
| Tyler Run-Queens Gate: | 2.7% (39) |
| Pennsylvania: | 2.7% (148,906) |
40 to 44 minutes:
| Tyler Run-Queens Gate: | 3.6% (52) |
| Pennsylvania: | 3.4% (187,483) |
45 to 59 minutes:
| Tyler Run-Queens Gate: | 4.0% (58) |
| Pennsylvania: | 7.3% (407,516) |
60 to 89 minutes:
| Tyler Run-Queens Gate: | 2.5% (37) |
| Pennsylvania: | 4.8% (265,759) |
90 or more minutes:
| Tyler Run-Queens Gate: | 0.5% (7) |
| Pennsylvania: | 2.6% (142,325) |
Means of transportation to work


Drove car alone:
| Tyler Run-Queens Gate: | 93.1% (1,360) |
| Pennsylvania: | 76.5% (4,247,836) |
Carpooled:
| Tyler Run-Queens Gate: | 2.1% (30) |
| Pennsylvania: | 10.4% (577,364) |
Bus or trolley bus:
| Tyler Run-Queens Gate: | 0.7% (10) |
| Pennsylvania: | 3.6% (198,036) |
Walked:
| Tyler Run-Queens Gate: | 1.8% (27) |
| Pennsylvania: | 4.1% (229,725) |
Private vehicle occupancy

Drove alone:
| Tyler Run-Queens Gate: | 97.8% (1,360) |
| Pennsylvania: | 88.0% (4,247,836) |
In 2 person carpool:
| Tyler Run-Queens Gate: | 2.2% (30) |
| Pennsylvania: | 9.7% (470,174) |
Class of workers

Employee of private company:
| Tyler Run-Queens Gate: | 74.1% (1,090) |
| Pennsylvania: | 69.7% (3,942,119) |
Self-employed in own incorporated business:
| Tyler Run-Queens Gate: | 2.8% (41) |
| Pennsylvania: | 2.4% (134,871) |
Private not-for-profit wage and salary workers:
| Tyler Run-Queens Gate: | 10.3% (151) |
| Pennsylvania: | 10.3% (580,382) |
Local government workers:
| Tyler Run-Queens Gate: | 1.8% (26) |
| Pennsylvania: | 5.8% (326,222) |
State government workers:
| Tyler Run-Queens Gate: | 1.0% (15) |
| Pennsylvania: | 3.2% (182,232) |
Federal government workers:
| Tyler Run-Queens Gate: | 1.3% (19) |
| Pennsylvania: | 2.3% (130,634) |
Self-employed workers in own not incorporated business:
| Tyler Run-Queens Gate: | 7.7% (113) |
| Pennsylvania: | 6.0% (339,631) |
Unpaid family workers:
| Tyler Run-Queens Gate: | 1.1% (16) |
| Pennsylvania: | 0.3% (17,409) |

Employee of private company - Males:
| Tyler Run-Queens Gate: | 73.6% (593) |
| Pennsylvania: | 72.1% (2,157,103) |
Self-employed in own incorporated business - Males:
| Tyler Run-Queens Gate: | 5.1% (41) |
| Pennsylvania: | 3.4% (103,200) |
Private not-for-profit wage and salary workers - Males:
| Tyler Run-Queens Gate: | 6.1% (49) |
| Pennsylvania: | 6.3% (187,590) |
Local government workers - Males:
| Tyler Run-Queens Gate: | 1.6% (13) |
| Pennsylvania: | 4.8% (143,607) |
State government workers - Males:
| Tyler Run-Queens Gate: | 1.9% (15) |
| Pennsylvania: | 3.1% (91,922) |
Federal government workers - Males:
| Tyler Run-Queens Gate: | 2.4% (19) |
| Pennsylvania: | 2.5% (73,391) |
Self-employed workers in own not incorporated business - Males:
| Tyler Run-Queens Gate: | 9.4% (76) |
| Pennsylvania: | 7.6% (228,618) |

Employee of private company - Females:
| Tyler Run-Queens Gate: | 74.7% (497) |
| Pennsylvania: | 67.1% (1,785,016) |
Private not-for-profit wage and salary workers - Females:
| Tyler Run-Queens Gate: | 15.3% (102) |
| Pennsylvania: | 14.8% (392,792) |
Local government workers - Females:
| Tyler Run-Queens Gate: | 2.0% (13) |
| Pennsylvania: | 6.9% (182,615) |
Self-employed workers in own not incorporated business - Females:
| Tyler Run-Queens Gate: | 5.6% (37) |
| Pennsylvania: | 4.2% (111,013) |
Unpaid family workers - Females:
| Tyler Run-Queens Gate: | 2.4% (16) |
| Pennsylvania: | 0.4% (10,060) |