Work and Jobs in Ventura, California (CA) Detailed Stats
Occupations, Industries, Unemployment, Workers, Commute
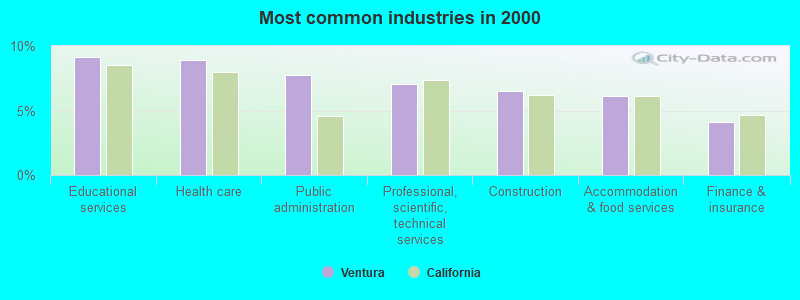
The most common industries in Ventura are: Educational services (9.1% of civilian employees), Health care (8.9% of civilian employees), Public administration (7.7% of civilian employees). 62.7% of workers are employees of private companies, which is 8.5% less than the rate of 68.0% across the entire state of California.
Most common industries
Most common industries | |||
|---|---|---|---|
Industry | All | Males | Females |
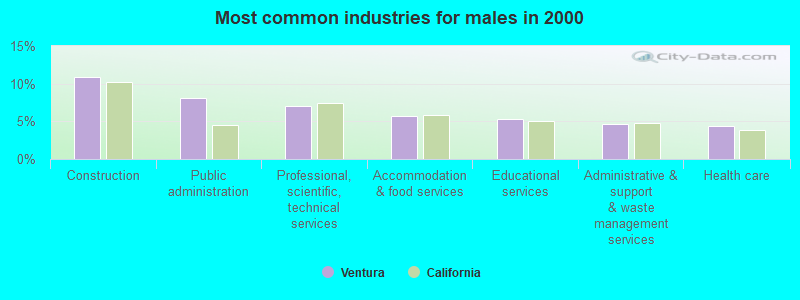
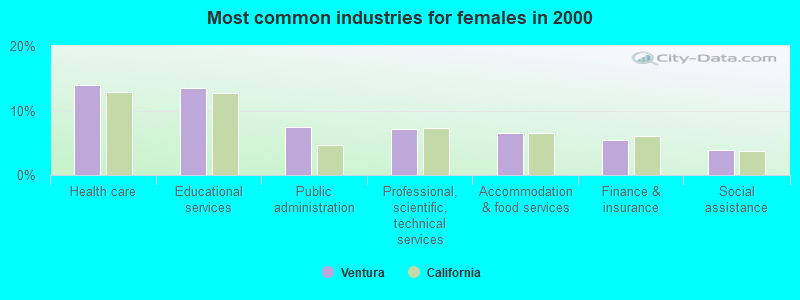
| Educational services | 9.1% (4,766) | 5.4% (1,491) | 13.4% (3,275) |
| Health care | 8.9% (4,639) | 4.4% (1,235) | 14.0% (3,404) |
| Public administration | 7.7% (4,039) | 8.1% (2,244) | 7.4% (1,795) |
| Professional, scientific, and technical services | 7.1% (3,694) | 7.0% (1,956) | 7.1% (1,738) |
| Construction | 6.5% (3,405) | 10.8% (3,015) | 1.6% (390) |
| Accommodation and food services | 6.1% (3,181) | 5.7% (1,577) | 6.6% (1,604) |
| Finance and insurance | 4.1% (2,127) | 3.0% (824) | 5.3% (1,303) |
| Administrative and support and waste management services | 4.1% (2,119) | 4.7% (1,306) | 3.3% (813) |
| Real estate and rental and leasing | 2.5% (1,303) | 2.5% (698) | 2.5% (605) |
| Social assistance | 2.2% (1,128) | 0.6% (179) | 3.9% (949) |
| Miscellaneous manufacturing | 2.1% (1,113) | 2.6% (723) | 1.6% (390) |
| Arts, entertainment, and recreation | 1.9% (985) | 2.0% (552) | 1.8% (433) |
| Computer and electronic products | 1.7% (905) | 2.0% (567) | 1.4% (338) |
| Department and other general merchandise stores | 1.7% (875) | 1.1% (304) | 2.3% (571) |
| Food and beverage stores | 1.7% (874) | 1.6% (446) | 1.8% (428) |
| Publishing, and motion picture and sound recording industries | 1.7% (861) | 1.9% (516) | 1.4% (345) |
| Repair and maintenance | 1.6% (812) | 2.5% (683) | 0.5% (129) |
| Personal and laundry services | 1.5% (785) | 1.0% (278) | 2.1% (507) |
| Agriculture, forestry, fishing and hunting | 1.5% (760) | 2.0% (567) | 0.8% (193) |
| Other transportation, and support activities, and couriers | 1.3% (676) | 1.7% (476) | 0.8% (200) |
| Motor vehicle and parts dealers | 1.3% (663) | 2.1% (570) | 0.4% (93) |
| Broadcasting and telecommunications | 1.2% (644) | 1.7% (472) | 0.7% (172) |
| Religious, grantmaking, civic, professional, and similar organizations | 1.1% (586) | 0.8% (234) | 1.4% (352) |
| Metal and metal products | 1.1% (576) | 1.4% (391) | 0.8% (185) |
| Transportation equipment | 1.0% (517) | 1.4% (389) | 0.5% (128) |
| Truck transportation | 1.0% (507) | 1.5% (407) | 0.4% (100) |
| Mining, quarrying, and oil and gas extraction | 0.9% (485) | 1.5% (424) | 0.3% (61) |
| Printing and related support activities | 0.9% (451) | 0.8% (216) | 1.0% (235) |
| Used merchandise, gift, novelty, and souvenir, and other miscellaneous stores | 0.9% (445) | 0.7% (185) | 1.1% (260) |
| Utilities | 0.8% (413) | 1.2% (324) | 0.4% (89) |
| Clothing and accessories, including shoe, stores | 0.8% (412) | 0.5% (132) | 1.1% (280) |
| Machinery | 0.8% (393) | 1.0% (287) | 0.4% (106) |
| Groceries and related products merchant wholesalers | 0.7% (390) | 1.1% (315) | 0.3% (75) |
| Radio, TV, and computer stores | 0.6% (329) | 0.9% (245) | 0.3% (84) |
| Chemicals | 0.6% (327) | 0.8% (219) | 0.4% (108) |
| Building material and garden equipment and supplies dealers | 0.6% (319) | 0.8% (222) | 0.4% (97) |
| Furniture and home furnishings, and household appliance stores | 0.6% (318) | 0.6% (161) | 0.6% (157) |
| U. S. Postal service | 0.6% (294) | 0.9% (238) | 0.2% (56) |
| Private households | 0.5% (277) | 0.1% (36) | 1.0% (241) |
| Pharmacies and drug stores | 0.5% (247) | 0.4% (109) | 0.6% (138) |
| Data processing, libraries, and other information services | 0.5% (244) | 0.4% (108) | 0.6% (136) |
| Food | 0.5% (235) | 0.4% (111) | 0.5% (124) |
| Apparel | 0.4% (229) | 0.2% (57) | 0.7% (172) |
| Machinery, equipment, and supplies merchant wholesalers | 0.4% (226) | 0.7% (195) | 0.1% (31) |
| Miscellaneous nondurable goods merchant wholesalers | 0.4% (219) | 0.5% (127) | 0.4% (92) |
| Professional and commercial equipment and supplies merchant wholesalers | 0.4% (207) | 0.6% (158) | 0.2% (49) |
| Other direct selling establishments | 0.4% (190) | 0.2% (66) | 0.5% (124) |
| Electrical and electronic goods merchant wholesalers | 0.4% (189) | 0.4% (107) | 0.3% (82) |
| Paper | 0.3% (175) | 0.5% (145) | 0.1% (30) |
| Electronic shopping and mail-order houses | 0.3% (163) | 0.3% (87) | 0.3% (76) |
| Gasoline stations | 0.3% (156) | 0.4% (100) | 0.2% (56) |
| Sporting goods, camera, and hobby and toy stores | 0.3% (149) | 0.3% (74) | 0.3% (75) |
| Electrical equipment, appliances, and components | 0.3% (142) | 0.3% (83) | 0.2% (59) |
| Plastics and rubber products | 0.3% (141) | 0.3% (93) | 0.2% (48) |
| Jewelry, luggage, and leather goods stores | 0.3% (137) | 0.2% (51) | 0.4% (86) |
| Furniture and related product manufacturing | 0.3% (136) | 0.4% (99) | 0.2% (37) |
| Health and personal care, except drug, stores | 0.2% (116) | 0.0% (5) | 0.5% (111) |
| Farm supplies merchant wholesalers | 0.2% (108) | 0.1% (40) | 0.3% (68) |
| Air transportation | 0.2% (105) | 0.2% (54) | 0.2% (51) |
| Book stores and news dealers | 0.2% (102) | 0.1% (32) | 0.3% (70) |
| Alcoholic beverages merchant wholesalers | 0.2% (92) | 0.3% (87) | 0.0% (5) |
| Nonmetallic mineral products | 0.2% (90) | 0.2% (69) | 0.1% (21) |
| Miscellaneous durable goods merchant wholesalers | 0.2% (90) | 0.2% (52) | 0.2% (38) |
| Retail florists | 0.2% (82) | 0.2% (54) | 0.1% (28) |
| Hardware, plumbing and heating equipment, and supplies merchant wholesalers | 0.1% (66) | 0.2% (63) | 0.0% (3) |
| Office supplies and stationery stores | 0.1% (65) | 0.1% (39) | 0.1% (26) |
| Recyclable material merchant wholesalers | 0.1% (65) | 0.2% (45) | 0.1% (20) |
| Beverage and tobacco products | 0.1% (65) | 0.2% (58) | 0.0% (7) |
| Drugs, sundries, and chemical and allied products merchant wholesalers | 0.1% (60) | 0.0% (11) | 0.2% (49) |
| Motor vehicles, parts and supplies merchant wholesalers | 0.1% (58) | 0.2% (52) | 0.0% (6) |
| Warehousing and storage | 0.1% (43) | 0.1% (34) | 0.0% (9) |
| Music stores | 0.1% (43) | 0.2% (43) | 0.0% (0) |
| Metals and minerals, except petroleum, merchant wholesalers | 0.1% (35) | 0.1% (30) | 0.0% (5) |
Unemployment in Ventura
- Unemployment by race in 2000
- Unemployment rate for White non-Hispanic residents
- 5.5%Males
- 3.6%Females
- Unemployment rate for Black residents
- 10.9%Males
- 6.1%Females
- Unemployment rate for American Indian and Alaska Native residents
- 2.1%Females
- Unemployment rate for Asian residents
- 4.1%Males
- 4.1%Females
- Unemployment rate for other race residents
- 6.1%Males
- 7.5%Females
- Unemployment rate for two or more race residents
- 5.9%Males
- 5.6%Females
- Unemployment rate for Hispanic or Latino residents
- 5.8%Males
- 7.3%Females
Time leaving home to go to work

<5am:
| Ventura: | 3.4% (1,725) |
| California: | 4.2% (606,086) |
5:30am:
| Ventura: | 2.5% (1,299) |
| California: | 3.6% (523,209) |
6am:
| Ventura: | 3.8% (1,953) |
| California: | 4.8% (692,256) |
6:30am:
| Ventura: | 7.1% (3,627) |
| California: | 8.4% (1,216,867) |
7am:
| Ventura: | 10.5% (5,371) |
| California: | 9.4% (1,362,830) |
7:30am:
| Ventura: | 15.3% (7,839) |
| California: | 13.8% (2,006,950) |
8am:
| Ventura: | 18.1% (9,235) |
| California: | 13.7% (1,986,831) |
8:30am:
| Ventura: | 10.7% (5,460) |
| California: | 10.9% (1,577,815) |
9am:
| Ventura: | 5.5% (2,789) |
| California: | 5.4% (778,152) |
10am:
| Ventura: | 6.2% (3,181) |
| California: | 6.7% (972,355) |
11am:
| Ventura: | 2.8% (1,421) |
| California: | 2.9% (414,479) |
12pm:
| Ventura: | 1.1% (579) |
| California: | 1.3% (189,005) |
4pm:
| Ventura: | 4.3% (2,206) |
| California: | 6.0% (865,284) |
>4pm:
| Ventura: | 4.6% (2,364) |
| California: | 5.3% (776,167) |
Travel time to work


Less than 5 minutes:
| Ventura: | 2.5% (1,269) |
| California: | 2.2% (324,703) |
5 to 9 minutes:
| Ventura: | 12.8% (6,559) |
| California: | 8.8% (1,280,443) |
10 to 14 minutes:
| Ventura: | 19.6% (10,048) |
| California: | 13.3% (1,930,263) |
15 to 19 minutes:
| Ventura: | 17.8% (9,120) |
| California: | 14.9% (2,157,970) |
20 to 24 minutes:
| Ventura: | 13.7% (7,025) |
| California: | 13.8% (2,004,060) |
25 to 29 minutes:
| Ventura: | 4.8% (2,452) |
| California: | 5.4% (782,241) |
30 to 34 minutes:
| Ventura: | 9.9% (5,074) |
| California: | 13.9% (2,025,657) |
35 to 39 minutes:
| Ventura: | 1.7% (845) |
| California: | 2.5% (366,487) |
40 to 44 minutes:
| Ventura: | 2.7% (1,372) |
| California: | 3.6% (528,043) |
45 to 59 minutes:
| Ventura: | 4.6% (2,358) |
| California: | 7.9% (1,151,598) |
60 to 89 minutes:
| Ventura: | 3.3% (1,698) |
| California: | 6.4% (933,123) |
90 or more minutes:
| Ventura: | 2.4% (1,229) |
| California: | 3.3% (483,698) |
Means of transportation to work


Drove car alone:
| Ventura: | 79.0% (40,389) |
| California: | 71.8% (10,432,462) |
Carpooled:
| Ventura: | 11.5% (5,903) |
| California: | 14.5% (2,113,313) |
Bus or trolley bus:
| Ventura: | 1.2% (633) |
| California: | 3.8% (549,425) |
Railroad:
| Ventura: | 0.1% (54) |
| California: | 0.3% (41,022) |
Ferryboat:
| Ventura: | 0.0% (6) |
| California: | 0.0% (6,831) |
Taxicab:
| Ventura: | 0.0% (20) |
| California: | 0.1% (9,890) |
Motorcycle:
| Ventura: | 0.2% (79) |
| California: | 0.2% (36,262) |
Bicycle:
| Ventura: | 0.8% (426) |
| California: | 0.8% (120,567) |
Walked:
| Ventura: | 2.5% (1,294) |
| California: | 2.9% (414,581) |
Other means:
| Ventura: | 0.5% (245) |
| California: | 0.8% (115,064) |
Private vehicle occupancy

Drove alone:
| Ventura: | 87.2% (40,389) |
| California: | 83.2% (10,432,462) |
In 2 person carpool:
| Ventura: | 9.7% (4,468) |
| California: | 12.5% (1,564,905) |
In 3 person carpool:
| Ventura: | 1.9% (887) |
| California: | 2.6% (330,732) |
In 4 person carpool:
| Ventura: | 0.6% (282) |
| California: | 1.0% (119,364) |
In 5-6 person carpool:
| Ventura: | 0.4% (174) |
| California: | 0.5% (57,036) |
In 7+ person carpool:
| Ventura: | 0.2% (92) |
| California: | 0.3% (41,276) |
Class of workers

Employee of private company:
| Ventura: | 62.7% (32,690) |
| California: | 68.0% (10,009,465) |
Self-employed in own incorporated business:
| Ventura: | 2.3% (1,211) |
| California: | 2.7% (402,392) |
Private not-for-profit wage and salary workers:
| Ventura: | 5.5% (2,883) |
| California: | 5.7% (845,536) |
Local government workers:
| Ventura: | 12.7% (6,606) |
| California: | 8.3% (1,218,764) |
State government workers:
| Ventura: | 3.3% (1,703) |
| California: | 4.0% (594,953) |
Federal government workers:
| Ventura: | 3.2% (1,668) |
| California: | 2.3% (344,354) |
Self-employed workers in own not incorporated business:
| Ventura: | 10.0% (5,196) |
| California: | 8.5% (1,249,530) |
Unpaid family workers:
| Ventura: | 0.4% (195) |
| California: | 0.4% (53,934) |

Employee of private company - Males:
| Ventura: | 65.9% (18,323) |
| California: | 71.1% (5,716,697) |
Self-employed in own incorporated business - Males:
| Ventura: | 3.0% (834) |
| California: | 3.6% (290,657) |
Private not-for-profit wage and salary workers - Males:
| Ventura: | 3.4% (936) |
| California: | 3.8% (303,997) |
Local government workers - Males:
| Ventura: | 10.2% (2,834) |
| California: | 6.2% (495,927) |
State government workers - Males:
| Ventura: | 2.4% (665) |
| California: | 3.2% (255,434) |
Federal government workers - Males:
| Ventura: | 3.9% (1,081) |
| California: | 2.5% (198,555) |
Self-employed workers in own not incorporated business - Males:
| Ventura: | 11.1% (3,084) |
| California: | 9.5% (760,853) |
Unpaid family workers - Males:
| Ventura: | 0.1% (36) |
| California: | 0.3% (23,230) |

Employee of private company - Females:
| Ventura: | 59.0% (14,367) |
| California: | 64.3% (4,292,768) |
Self-employed in own incorporated business - Females:
| Ventura: | 1.5% (377) |
| California: | 1.7% (111,735) |
Private not-for-profit wage and salary workers - Females:
| Ventura: | 8.0% (1,947) |
| California: | 8.1% (541,539) |
Local government workers - Females:
| Ventura: | 15.5% (3,772) |
| California: | 10.8% (722,837) |
State government workers - Females:
| Ventura: | 4.3% (1,038) |
| California: | 5.1% (339,519) |
Federal government workers - Females:
| Ventura: | 2.4% (587) |
| California: | 2.2% (145,799) |
Self-employed workers in own not incorporated business - Females:
| Ventura: | 8.7% (2,112) |
| California: | 7.3% (488,677) |
Unpaid family workers - Females:
| Ventura: | 0.7% (159) |
| California: | 0.5% (30,704) |