Work and Jobs in Warren, Texas (TX) Detailed Stats
Occupations, Industries, Unemployment, Workers, Commute
Settings
X


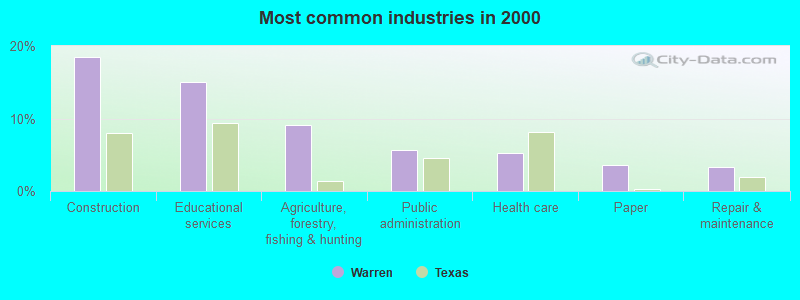
The most common industries in Warren are: Construction (18.5% of civilian employees), Educational services (15.1% of civilian employees), Agriculture, forestry, fishing & hunting (9.1% of civilian employees). 62.0% of workers are employees of private companies, which is 12.2% less than the rate of 69.6% across the entire state of Texas.
Most common industries
Most common industries | |||
|---|---|---|---|
Industry | All | Males | Females |
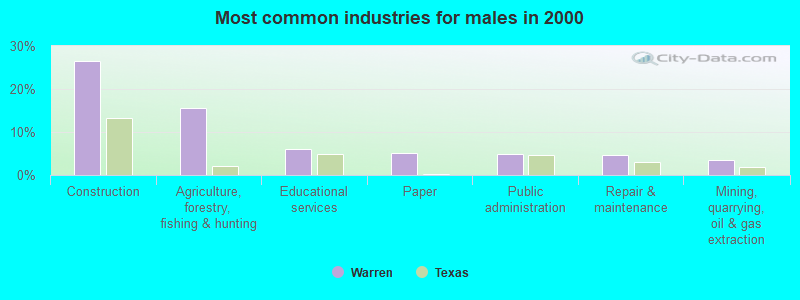
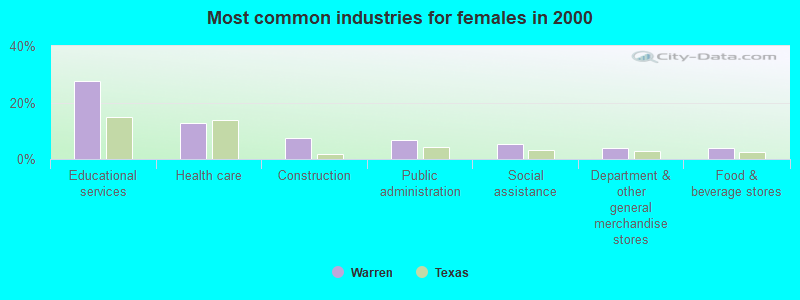
| Construction | 18.5% (195) | 26.5% (163) | 7.3% (32) |
| Educational services | 15.1% (159) | 6.0% (37) | 27.7% (122) |
| Agriculture, forestry, fishing and hunting | 9.1% (96) | 15.6% (96) | 0.0% (0) |
| Public administration | 5.7% (60) | 4.9% (30) | 6.8% (30) |
| Health care | 5.3% (56) | 0.0% (0) | 12.7% (56) |
| Paper | 3.6% (38) | 5.2% (32) | 1.4% (6) |
| Repair and maintenance | 3.3% (35) | 4.7% (29) | 1.4% (6) |
| Administrative and support and waste management services | 2.7% (28) | 1.8% (11) | 3.9% (17) |
| Social assistance | 2.2% (23) | 0.0% (0) | 5.2% (23) |
| Mining, quarrying, and oil and gas extraction | 2.1% (22) | 3.6% (22) | 0.0% (0) |
| Finance and insurance | 2.1% (22) | 2.6% (16) | 1.4% (6) |
| Petroleum and coal products | 2.0% (21) | 3.4% (21) | 0.0% (0) |
| Religious, grantmaking, civic, professional, and similar organizations | 1.9% (20) | 1.1% (7) | 3.0% (13) |
| Real estate and rental and leasing | 1.8% (19) | 1.1% (7) | 2.7% (12) |
| Department and other general merchandise stores | 1.6% (17) | 0.0% (0) | 3.9% (17) |
| Food and beverage stores | 1.6% (17) | 0.0% (0) | 3.9% (17) |
| Chemicals | 1.6% (17) | 2.8% (17) | 0.0% (0) |
| Wood products | 1.5% (16) | 2.6% (16) | 0.0% (0) |
| Professional, scientific, and technical services | 1.3% (14) | 0.6% (4) | 2.3% (10) |
| Utilities | 1.3% (14) | 2.3% (14) | 0.0% (0) |
| Accommodation and food services | 1.1% (12) | 0.0% (0) | 2.7% (12) |
| Air transportation | 1.1% (12) | 1.9% (12) | 0.0% (0) |
| Other direct selling establishments | 1.0% (11) | 0.0% (0) | 2.5% (11) |
| Metal and metal products | 0.9% (10) | 1.6% (10) | 0.0% (0) |
| Arts, entertainment, and recreation | 0.9% (10) | 1.6% (10) | 0.0% (0) |
| Groceries and related products merchant wholesalers | 0.9% (10) | 1.6% (10) | 0.0% (0) |
| Used merchandise, gift, novelty, and souvenir, and other miscellaneous stores | 0.9% (9) | 0.0% (0) | 2.0% (9) |
| Transportation equipment | 0.9% (9) | 1.5% (9) | 0.0% (0) |
| Private households | 0.6% (6) | 0.0% (0) | 1.4% (6) |
| Personal and laundry services | 0.6% (6) | 0.0% (0) | 1.4% (6) |
| Electrical and electronic goods merchant wholesalers | 0.6% (6) | 0.0% (0) | 1.4% (6) |
| Retail florists | 0.6% (6) | 0.0% (0) | 1.4% (6) |
| Machinery | 0.6% (6) | 1.0% (6) | 0.0% (0) |
| Pharmacies and drug stores | 0.5% (5) | 0.0% (0) | 1.1% (5) |
| Water transportation | 0.5% (5) | 0.8% (5) | 0.0% (0) |
| Hardware, plumbing and heating equipment, and supplies merchant wholesalers | 0.5% (5) | 0.8% (5) | 0.0% (0) |
| Building material and garden equipment and supplies dealers | 0.5% (5) | 0.0% (0) | 1.1% (5) |
| Furniture and home furnishings, and household appliance stores | 0.4% (4) | 0.6% (4) | 0.0% (0) |
| Fuel dealers | 0.4% (4) | 0.0% (0) | 0.9% (4) |
| Rail transportation | 0.4% (4) | 0.6% (4) | 0.0% (0) |
| Other transportation, and support activities, and couriers | 0.4% (4) | 0.6% (4) | 0.0% (0) |
| Professional and commercial equipment and supplies merchant wholesalers | 0.4% (4) | 0.6% (4) | 0.0% (0) |
| Machinery, equipment, and supplies merchant wholesalers | 0.4% (4) | 0.6% (4) | 0.0% (0) |
| Lumber and other construction materials merchant wholesalers | 0.4% (4) | 0.6% (4) | 0.0% (0) |
| Motor vehicle and parts dealers | 0.3% (3) | 0.5% (3) | 0.0% (0) |
| Broadcasting and telecommunications | 0.3% (3) | 0.0% (0) | 0.7% (3) |
Unemployment in Warren
- Unemployment by race in 2000
- Unemployment rate for White non-Hispanic residents
- 2.8%Males
- 4.0%Females
- Unemployment rate for Black residents
- 50.0%Females
Time leaving home to go to work

<5am:
| Warren: | 11.9% (122) |
| Texas: | 3.1% (281,361) |
5:30am:
| Warren: | 10.8% (110) |
| Texas: | 2.9% (262,060) |
6am:
| Warren: | 10.7% (109) |
| Texas: | 4.4% (403,423) |
6:30am:
| Warren: | 6.2% (63) |
| Texas: | 8.8% (808,876) |
7am:
| Warren: | 10.4% (106) |
| Texas: | 10.7% (976,557) |
7:30am:
| Warren: | 20.1% (205) |
| Texas: | 16.4% (1,500,904) |
8am:
| Warren: | 6.9% (71) |
| Texas: | 16.8% (1,536,308) |
8:30am:
| Warren: | 4.5% (46) |
| Texas: | 10.0% (913,601) |
9am:
| Warren: | 2.0% (20) |
| Texas: | 4.4% (398,656) |
10am:
| Warren: | 3.5% (36) |
| Texas: | 5.2% (472,592) |
11am:
| Warren: | 0.8% (8) |
| Texas: | 2.2% (197,844) |
4pm:
| Warren: | 4.0% (41) |
| Texas: | 5.5% (503,565) |
>4pm:
| Warren: | 1.1% (11) |
| Texas: | 6.1% (563,107) |
Travel time to work


Less than 5 minutes:
| Warren: | 4.6% (47) |
| Texas: | 3.0% (277,642) |
5 to 9 minutes:
| Warren: | 3.6% (37) |
| Texas: | 10.3% (942,891) |
10 to 14 minutes:
| Warren: | 9.0% (92) |
| Texas: | 14.4% (1,317,555) |
15 to 19 minutes:
| Warren: | 9.9% (101) |
| Texas: | 16.0% (1,467,945) |
20 to 24 minutes:
| Warren: | 9.0% (92) |
| Texas: | 13.9% (1,276,781) |
25 to 29 minutes:
| Warren: | 0.7% (7) |
| Texas: | 5.3% (482,838) |
30 to 34 minutes:
| Warren: | 9.5% (97) |
| Texas: | 14.3% (1,309,699) |
40 to 44 minutes:
| Warren: | 1.4% (14) |
| Texas: | 3.1% (280,916) |
45 to 59 minutes:
| Warren: | 22.3% (228) |
| Texas: | 7.6% (692,006) |
60 to 89 minutes:
| Warren: | 11.4% (117) |
| Texas: | 4.6% (418,905) |
90 or more minutes:
| Warren: | 11.4% (116) |
| Texas: | 2.4% (218,800) |
Means of transportation to work


Drove car alone:
| Warren: | 72.9% (745) |
| Texas: | 77.7% (7,115,590) |
Carpooled:
| Warren: | 16.9% (173) |
| Texas: | 14.5% (1,326,012) |
Ferryboat:
| Warren: | 0.4% (4) |
| Texas: | 0.0% (738) |
Walked:
| Warren: | 0.6% (6) |
| Texas: | 1.9% (173,670) |
Other means:
| Warren: | 2.0% (20) |
| Texas: | 0.9% (86,692) |
Private vehicle occupancy

Drove alone:
| Warren: | 81.2% (745) |
| Texas: | 84.3% (7,115,590) |
In 2 person carpool:
| Warren: | 10.6% (97) |
| Texas: | 11.6% (982,994) |
In 3 person carpool:
| Warren: | 7.1% (65) |
| Texas: | 2.4% (201,602) |
In 4 person carpool:
| Warren: | 1.2% (11) |
| Texas: | 1.0% (83,518) |
Class of workers

Employee of private company:
| Warren: | 62.0% (655) |
| Texas: | 69.6% (6,425,274) |
Self-employed in own incorporated business:
| Warren: | 4.3% (45) |
| Texas: | 2.7% (250,864) |
Private not-for-profit wage and salary workers:
| Warren: | 8.0% (85) |
| Texas: | 5.7% (526,631) |
Local government workers:
| Warren: | 6.2% (66) |
| Texas: | 6.6% (608,479) |
State government workers:
| Warren: | 9.8% (103) |
| Texas: | 5.4% (501,082) |
Federal government workers:
| Warren: | 1.5% (16) |
| Texas: | 2.6% (237,177) |
Self-employed workers in own not incorporated business:
| Warren: | 7.6% (80) |
| Texas: | 7.1% (653,527) |
Unpaid family workers:
| Warren: | 0.6% (6) |
| Texas: | 0.3% (31,338) |

Employee of private company - Males:
| Warren: | 73.9% (455) |
| Texas: | 72.7% (3,684,731) |
Self-employed in own incorporated business - Males:
| Warren: | 3.2% (20) |
| Texas: | 3.6% (183,838) |
Private not-for-profit wage and salary workers - Males:
| Warren: | 2.8% (17) |
| Texas: | 3.4% (173,484) |
Local government workers - Males:
| Warren: | 2.1% (13) |
| Texas: | 5.1% (260,804) |
State government workers - Males:
| Warren: | 7.1% (44) |
| Texas: | 3.8% (190,371) |
Federal government workers - Males:
| Warren: | 1.5% (9) |
| Texas: | 2.6% (133,009) |
Self-employed workers in own not incorporated business - Males:
| Warren: | 9.4% (58) |
| Texas: | 8.4% (428,111) |

Employee of private company - Females:
| Warren: | 45.5% (200) |
| Texas: | 65.8% (2,740,543) |
Self-employed in own incorporated business - Females:
| Warren: | 5.7% (25) |
| Texas: | 1.6% (67,026) |
Private not-for-profit wage and salary workers - Females:
| Warren: | 15.5% (68) |
| Texas: | 8.5% (353,147) |
Local government workers - Females:
| Warren: | 12.0% (53) |
| Texas: | 8.3% (347,675) |
State government workers - Females:
| Warren: | 13.4% (59) |
| Texas: | 7.5% (310,711) |
Federal government workers - Females:
| Warren: | 1.6% (7) |
| Texas: | 2.5% (104,168) |
Self-employed workers in own not incorporated business - Females:
| Warren: | 5.0% (22) |
| Texas: | 5.4% (225,416) |
Unpaid family workers - Females:
| Warren: | 1.4% (6) |
| Texas: | 0.4% (17,000) |