Work and Jobs in Washington, District of Columbia (DC) Detailed Stats
Occupations, Industries, Unemployment, Workers, Commute
Settings
X


Recent posts about work in Washington, District of Columbia on our local forum with over 2,400,000 registered users:

Latest news about work in Washington, DC collected exclusively by city-data.com from local newspapers, TV, and radio stations
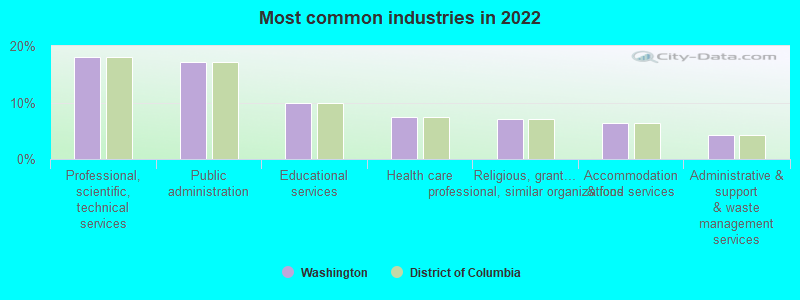
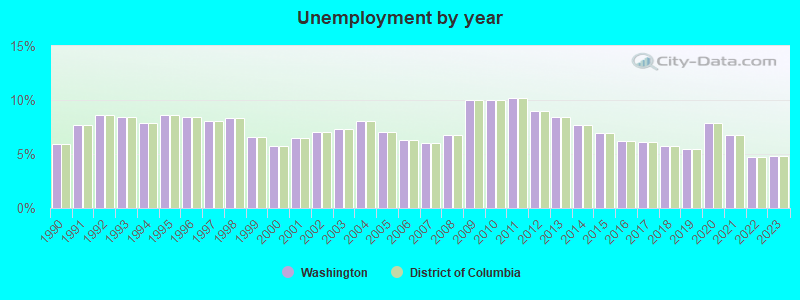
The unemployment rate in 2023 in Washington, DC was 4.8%, which was about the same as the unemployment rate of 4.8% across the entire state of District of Columbia. Compared to the unemployment rate of 8.4% in 2013, this represents a decrease of 75.0%. According to 2022 data, the most common industries in Washington are: Professional, scientific, technical services (18.0% of civilian employees), Public administration (17.1% of civilian employees), Educational services (9.9% of civilian employees). 83.9% of workers work in District of Columbia County and 33.8% of all workers work at home. 45.1% of workers are employees of private companies, which is about the same as the rate of 45.1% across the entire state of District of Columbia.
Whole page based on the data from 2000 / 2022 when the population of Washington, District of Columbia was 572,059 / 671,803
Whole page based on the data from 2000 / 2022 when the population of Washington, District of Columbia was 572,059 / 671,803
Most common industries


Most common industries | Most common industries | |||||
|---|---|---|---|---|---|---|
Industry | All | Males | Females | All | Males | Females |
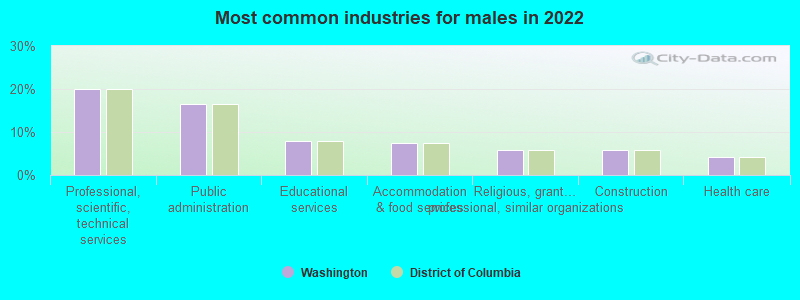
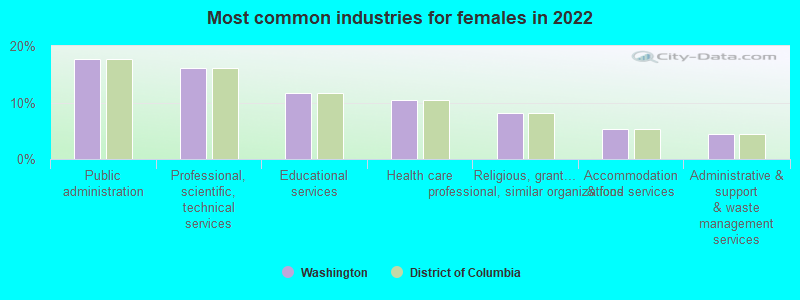
| Professional, scientific, and technical services | 18.0% (64,803) | 20.1% (34,856) | 16.1% (29,947) | 14.1% (37,173) | 15.5% (19,965) | 12.8% (17,208) |
| Public administration | 17.1% (61,760) | 16.6% (28,784) | 17.7% (32,976) | 15.0% (39,501) | 13.1% (16,876) | 16.8% (22,625) |
| Educational services | 9.9% (35,641) | 8.0% (13,939) | 11.6% (21,702) | 9.4% (24,840) | 7.1% (9,156) | 11.7% (15,684) |
| Health care | 7.4% (26,556) | 4.1% (7,173) | 10.4% (19,383) | 6.6% (17,437) | 4.2% (5,448) | 8.9% (11,989) |
| Religious, grantmaking, civic, professional, and similar organizations | 7.0% (25,251) | 5.8% (10,035) | 8.2% (15,216) | 6.6% (17,311) | 5.3% (6,868) | 7.8% (10,443) |
| Accommodation and food services | 6.3% (22,707) | 7.3% (12,760) | 5.3% (9,947) | 6.7% (17,721) | 7.5% (9,595) | 6.0% (8,126) |
| Administrative and support and waste management services | 4.2% (15,186) | 4.1% (7,090) | 4.3% (8,096) | 4.7% (12,304) | 5.1% (6,574) | 4.3% (5,730) |
| Construction | 3.1% (11,211) | 5.7% (9,902) | 0.7% (1,309) | 3.9% (10,337) | 7.0% (9,011) | 1.0% (1,326) |
| Finance and insurance | 2.9% (10,419) | 3.3% (5,713) | 2.5% (4,706) | 4.9% (12,803) | 4.7% (6,094) | 5.0% (6,709) |
| Arts, entertainment, and recreation | 2.9% (10,310) | 3.0% (5,163) | 2.8% (5,147) | 2.3% (6,183) | 2.4% (3,066) | 2.3% (3,117) |
| Social assistance | 2.8% (9,993) | 1.4% (2,414) | 4.1% (7,579) | 1.9% (5,035) | 0.7% (875) | 3.1% (4,160) |
| Real estate and rental and leasing | 2.5% (8,930) | 3.0% (5,222) | 2.0% (3,708) | 2.5% (6,585) | 3.0% (3,847) | 2.0% (2,738) |
| Other transportation, and support activities, and couriers | 1.7% (6,208) | 2.6% (4,485) | 0.9% (1,723) | 1.6% (4,187) | 2.4% (3,093) | 0.8% (1,094) |
| Publishing, and motion picture and sound recording industries | 1.6% (5,792) | 1.8% (3,126) | 1.4% (2,666) | 2.2% (5,844) | 2.5% (3,217) | 2.0% (2,627) |
| Broadcasting and telecommunications | 1.4% (5,188) | 1.6% (2,744) | 1.3% (2,444) | 2.3% (6,102) | 2.5% (3,156) | 2.2% (2,946) |
| Food and beverage stores | 1.3% (4,631) | 1.5% (2,589) | 1.1% (2,042) | 1.2% (3,154) | 1.4% (1,848) | 1.0% (1,306) |
| Personal and laundry services | 1.1% (3,992) | 1.2% (2,065) | 1.0% (1,927) | 1.3% (3,533) | 1.1% (1,447) | 1.6% (2,086) |
| Data processing, libraries, and other information services | 0.9% (3,155) | 0.8% (1,429) | 0.9% (1,726) | 1.9% (4,900) | 2.1% (2,734) | 1.6% (2,166) |
| Private households | 0.7% (2,700) | 0.2% (375) | 1.2% (2,325) | 0.9% (2,289) | 0.2% (222) | 1.5% (2,067) |
| Clothing and accessories, including shoe, stores | 0.7% (2,473) | 0.3% (542) | 1.0% (1,931) | 0.6% (1,515) | 0.4% (572) | 0.7% (943) |
| Department and other general merchandise stores | 0.5% (1,958) | 0.4% (781) | 0.6% (1,177) | 0.7% (1,922) | 0.6% (760) | 0.9% (1,162) |
| Used merchandise, gift, novelty, and souvenir, and other miscellaneous stores | 0.4% (1,459) | 0.4% (728) | 0.4% (731) | 0.4% (1,072) | 0.4% (496) | 0.4% (576) |
| Radio, TV, and computer stores | 0.3% (1,184) | 0.4% (612) | 0.3% (572) | 0.4% (1,057) | 0.5% (664) | 0.3% (393) |
| Truck transportation | 0.3% (1,174) | 0.6% (1,009) | 0.1% (165) | 0.4% (1,010) | 0.7% (866) | 0.1% (144) |
| U. S. Postal service | 0.3% (1,164) | 0.4% (706) | 0.2% (458) | 0.7% (1,940) | 0.8% (1,088) | 0.6% (852) |
| Transportation equipment | 0.3% (1,003) | 0.3% (555) | 0.2% (448) | 0.1% (369) | 0.2% (202) | 0.1% (167) |
| Other direct selling establishments | 0.3% (999) | 0.2% (434) | 0.3% (565) | 0.4% (971) | 0.4% (506) | 0.3% (465) |
| Furniture and home furnishings, and household appliance stores | 0.3% (905) | 0.3% (573) | 0.2% (332) | 0.3% (703) | 0.4% (496) | 0.2% (207) |
| Repair and maintenance | 0.2% (885) | 0.4% (721) | 0.1% (164) | 0.5% (1,312) | 0.9% (1,106) | 0.2% (206) |
| Utilities | 0.2% (871) | 0.3% (555) | 0.2% (316) | 0.3% (919) | 0.4% (563) | 0.3% (356) |
| Pharmacies and drug stores | 0.2% (817) | 0.2% (331) | 0.3% (486) | 0.3% (877) | 0.3% (378) | 0.4% (499) |
| Air transportation | 0.2% (791) | 0.2% (389) | 0.2% (402) | 0.3% (792) | 0.4% (477) | 0.2% (315) |
| Printing and related support activities | 0.2% (617) | 0.3% (449) | 0.1% (168) | 0.5% (1,285) | 0.5% (617) | 0.5% (668) |
| Building material and garden equipment and supplies dealers | 0.2% (606) | 0.3% (494) | 0.1% (112) | 0.2% (499) | 0.3% (416) | 0.1% (83) |
| Sporting goods, camera, and hobby and toy stores | 0.2% (586) | 0.2% (367) | 0.1% (219) | 0.1% (310) | 0.1% (177) | 0.1% (133) |
| Computer and electronic products | 0.2% (584) | 0.1% (187) | 0.2% (397) | 0.2% (604) | 0.3% (390) | 0.2% (214) |
| Groceries and related products merchant wholesalers | 0.1% (526) | 0.2% (358) | 0.1% (168) | 0.2% (456) | 0.3% (392) | 0.0% (64) |
| Food | 0.1% (514) | 0.2% (332) | 0.1% (182) | 0.1% (332) | 0.2% (284) | 0.0% (48) |
| Rail transportation | 0.1% (505) | 0.2% (266) | 0.1% (239) | 0.2% (407) | 0.2% (263) | 0.1% (144) |
| Chemicals | 0.1% (399) | 0.1% (178) | 0.1% (221) | 0.1% (256) | 0.1% (132) | 0.1% (124) |
| Electronic shopping and mail-order houses | 0.1% (390) | 0.1% (253) | 0.1% (137) | 0.1% (274) | 0.2% (221) | 0.0% (53) |
| Miscellaneous manufacturing | 0.1% (359) | 0.1% (251) | 0.1% (108) | 0.2% (503) | 0.3% (329) | 0.1% (174) |
| Warehousing and storage | 0.1% (346) | 0.2% (335) | 0.0% (11) | 0.1% (237) | 0.2% (197) | 0.0% (40) |
| Book stores and news dealers | 0.1% (337) | 0.1% (91) | 0.1% (246) | 0.3% (812) | 0.3% (386) | 0.3% (426) |
| Professional and commercial equipment and supplies merchant wholesalers | 0.1% (312) | 0.1% (206) | 0.1% (106) | 0.2% (494) | 0.3% (345) | 0.1% (149) |
| Motor vehicle and parts dealers | 0.1% (310) | 0.1% (111) | 0.1% (199) | 0.4% (1,005) | 0.6% (797) | 0.2% (208) |
| Furniture and related product manufacturing | 0.1% (251) | 0.1% (251) | 0.0% (0) | 0.0% (131) | 0.1% (105) | 0.0% (26) |
| Health and personal care, except drug, stores | 0.1% (246) | 0.1% (92) | 0.1% (154) | 0.2% (436) | 0.2% (218) | 0.2% (218) |
| Miscellaneous nondurable goods merchant wholesalers | 0.1% (215) | 0.1% (153) | 0.0% (62) | 0.1% (381) | 0.2% (201) | 0.1% (180) |
| Music stores | 0.0% (0) | 0.0% (0) | 0.0% (0) | 0.1% (302) | 0.2% (209) | 0.1% (93) |
Unemployment in Washington
- Unemployment by race in 2022
- Unemployment rate for White non-Hispanic residents
- 2.7%Males
- 2.6%Females
- Unemployment rate for Black residents
- 10.6%Males
- 9.1%Females
- Unemployment rate for American Indian and Alaska Native residents
- 4.0%Males
- Unemployment rate for Asian residents
- 4.4%Males
- 1.5%Females
- Unemployment rate for other race residents
- 5.9%Males
- 7.3%Females
- Unemployment rate for two or more race residents
- 5.2%Males
- 1.0%Females
- Unemployment rate for Hispanic or Latino residents
- 2.9%Males
- 2.1%Females
- Unemployment by race in 2000
- Unemployment rate for White non-Hispanic residents
- 5.7%Males
- 8.0%Females
- Unemployment rate for Black residents
- 15.7%Males
- 13.5%Females
- Unemployment rate for American Indian and Alaska Native residents
- 12.3%Males
- 10.4%Females
- Unemployment rate for Asian residents
- 7.1%Males
- 6.8%Females
- Unemployment rate for other race residents
- 8.5%Males
- 13.7%Females
- Unemployment rate for two or more race residents
- 7.4%Males
- 7.2%Females
- Unemployment rate for Hispanic or Latino residents
- 7.0%Males
- 10.0%Females
Unemployment in 2023:
| Washington: | 4.8% |
| District of Columbia: | 4.8% |
Unemployment in 2022:
| Washington: | 4.7% |
| District of Columbia: | 4.7% |
Unemployment in 2021:
| Washington: | 6.8% |
| District of Columbia: | 6.8% |
Unemployment in 2020:
| Washington: | 7.9% |
| District of Columbia: | 7.9% |
Unemployment in 2019:
| Washington: | 5.5% |
| District of Columbia: | 5.5% |
Unemployment in 2018:
| Washington: | 5.7% |
| District of Columbia: | 5.7% |
Unemployment in 2017:
| Washington: | 6.1% |
| District of Columbia: | 6.1% |
Unemployment in 2016:
| Washington: | 6.2% |
| District of Columbia: | 6.2% |
Unemployment in 2015:
| Washington: | 6.9% |
| District of Columbia: | 6.9% |
Unemployment in 2014:
| Washington: | 7.7% |
| District of Columbia: | 7.7% |
Unemployment in 2013:
| Washington: | 8.4% |
| District of Columbia: | 8.4% |
Unemployment in 2012:
| Washington: | 9.0% |
| District of Columbia: | 9.0% |
Unemployment in 2011:
| Washington: | 10.2% |
| District of Columbia: | 10.2% |
Unemployment in 2010:
| Washington: | 10.0% |
| District of Columbia: | 10.0% |
Unemployment in 2009:
| Washington: | 10.0% |
| District of Columbia: | 10.0% |
Unemployment in 2008:
| Washington: | 6.8% |
| District of Columbia: | 6.8% |
Unemployment in 2007:
| Washington: | 6.0% |
| District of Columbia: | 6.0% |
Unemployment in 2006:
| Washington: | 6.3% |
| District of Columbia: | 6.3% |
Unemployment in 2005:
| Washington: | 7.0% |
| District of Columbia: | 7.0% |
Unemployment in 2004:
| Washington: | 8.1% |
| District of Columbia: | 8.1% |
Unemployment in 2003:
| Washington: | 7.3% |
| District of Columbia: | 7.3% |
Unemployment in 2002:
| Washington: | 7.0% |
| District of Columbia: | 7.0% |
Unemployment in 2001:
| Washington: | 6.5% |
| District of Columbia: | 6.5% |
Unemployment in 2000:
| Washington: | 5.7% |
| District of Columbia: | 5.7% |
Unemployment in 1999:
| Washington: | 6.6% |
| District of Columbia: | 6.6% |
Unemployment in 1998:
| Washington: | 8.3% |
| District of Columbia: | 8.3% |
Unemployment in 1997:
| Washington: | 8.1% |
| District of Columbia: | 8.1% |
Unemployment in 1996:
| Washington: | 8.4% |
| District of Columbia: | 8.4% |
Unemployment in 1995:
| Washington: | 8.6% |
| District of Columbia: | 8.6% |
Unemployment in 1994:
| Washington: | 7.9% |
| District of Columbia: | 7.9% |
Unemployment in 1993:
| Washington: | 8.4% |
| District of Columbia: | 8.4% |
Unemployment in 1992:
| Washington: | 8.6% |
| District of Columbia: | 8.6% |
Unemployment in 1991:
| Washington: | 7.7% |
| District of Columbia: | 7.7% |
Unemployment in 1990:
| Washington: | 5.9% |
| District of Columbia: | 5.9% |
Time leaving home to go to work

12:00 a.m. to 4:59 a.m.:
| Washington: | 2.5% (6,119) |
| District of Columbia: | 2.5% (6,119) |
5:00 a.m. to 5:29 a.m.:
| Washington: | 2.1% (5,312) |
| District of Columbia: | 2.1% (5,312) |
5:30 a.m. to 5:59 a.m.:
| Washington: | 1.5% (3,836) |
| District of Columbia: | 1.5% (3,836) |
6:00 a.m. to 6:29 a.m.:
| Washington: | 3.6% (8,954) |
| District of Columbia: | 3.6% (8,954) |
6:30 a.m. to 6:59 a.m.:
| Washington: | 4.6% (11,480) |
| District of Columbia: | 4.6% (11,480) |
7:00 a.m. to 7:29 a.m.:
| Washington: | 11.9% (29,424) |
| District of Columbia: | 11.9% (29,424) |
7:30 a.m. to 7:59 a.m.:
| Washington: | 11.9% (29,481) |
| District of Columbia: | 11.9% (29,481) |
8:00 a.m. to 8:29 a.m.:
| Washington: | 19.0% (47,058) |
| District of Columbia: | 19.0% (47,058) |
8:30 a.m. to 8:59 a.m.:
| Washington: | 15.3% (38,008) |
| District of Columbia: | 15.3% (38,008) |
9:00 a.m. to 9:59 a.m.:
| Washington: | 13.9% (34,519) |
| District of Columbia: | 13.9% (34,519) |
10:00 a.m. to 10:59 a.m.:
| Washington: | 3.0% (7,548) |
| District of Columbia: | 3.0% (7,548) |
11:00 a.m. to 11:59 a.m.:
| Washington: | 1.7% (4,121) |
| District of Columbia: | 1.7% (4,121) |
12:00 p.m. to 3:59 p.m.:
| Washington: | 5.3% (13,171) |
| District of Columbia: | 5.3% (13,171) |
4:00 p.m. to 11:59 p.m.:
| Washington: | 3.5% (8,653) |
| District of Columbia: | 3.5% (8,653) |

<5am:
| Washington: | 2.1% (5,398) |
| District of Columbia: | 2.1% (5,398) |
5:30am:
| Washington: | 1.9% (5,001) |
| District of Columbia: | 1.9% (5,001) |
6am:
| Washington: | 2.6% (6,829) |
| District of Columbia: | 2.6% (6,829) |
6:30am:
| Washington: | 5.7% (14,820) |
| District of Columbia: | 5.7% (14,820) |
7am:
| Washington: | 6.4% (16,778) |
| District of Columbia: | 6.4% (16,778) |
7:30am:
| Washington: | 11.3% (29,542) |
| District of Columbia: | 11.3% (29,542) |
8am:
| Washington: | 13.8% (36,043) |
| District of Columbia: | 13.8% (36,043) |
8:30am:
| Washington: | 17.0% (44,436) |
| District of Columbia: | 17.0% (44,436) |
9am:
| Washington: | 11.9% (31,140) |
| District of Columbia: | 11.9% (31,140) |
10am:
| Washington: | 9.3% (24,271) |
| District of Columbia: | 9.3% (24,271) |
11am:
| Washington: | 2.9% (7,678) |
| District of Columbia: | 2.9% (7,678) |
12pm:
| Washington: | 1.2% (3,100) |
| District of Columbia: | 1.2% (3,100) |
4pm:
| Washington: | 5.1% (13,252) |
| District of Columbia: | 5.1% (13,252) |
>4pm:
| Washington: | 4.9% (12,666) |
| District of Columbia: | 4.9% (12,666) |

12:00 a.m. to 4:59 a.m. - Males:
| Washington: | 3.6% (4,410) |
| District of Columbia: | 3.6% (4,410) |
5:00 a.m. to 5:29 a.m. - Males:
| Washington: | 2.6% (3,132) |
| District of Columbia: | 2.6% (3,132) |
5:30 a.m. to 5:59 a.m. - Males:
| Washington: | 1.1% (1,319) |
| District of Columbia: | 1.1% (1,319) |
6:00 a.m. to 6:29 a.m. - Males:
| Washington: | 4.3% (5,280) |
| District of Columbia: | 4.3% (5,280) |
6:30 a.m. to 6:59 a.m. - Males:
| Washington: | 4.0% (4,845) |
| District of Columbia: | 4.0% (4,845) |
7:00 a.m. to 7:29 a.m. - Males:
| Washington: | 11.1% (13,592) |
| District of Columbia: | 11.1% (13,592) |
7:30 a.m. to 7:59 a.m. - Males:
| Washington: | 13.1% (16,026) |
| District of Columbia: | 13.1% (16,026) |
8:00 a.m. to 8:29 a.m. - Males:
| Washington: | 18.7% (22,845) |
| District of Columbia: | 18.7% (22,845) |
8:30 a.m. to 8:59 a.m. - Males:
| Washington: | 14.4% (17,583) |
| District of Columbia: | 14.4% (17,583) |
9:00 a.m. to 9:59 a.m. - Males:
| Washington: | 14.0% (17,126) |
| District of Columbia: | 14.0% (17,126) |
10:00 a.m. to 10:59 a.m. - Males:
| Washington: | 2.7% (3,285) |
| District of Columbia: | 2.7% (3,285) |
11:00 a.m. to 11:59 a.m. - Males:
| Washington: | 2.3% (2,833) |
| District of Columbia: | 2.3% (2,833) |
12:00 p.m. to 3:59 p.m. - Males:
| Washington: | 5.1% (6,194) |
| District of Columbia: | 5.1% (6,194) |
4:00 p.m. to 11:59 p.m. - Males:
| Washington: | 3.1% (3,835) |
| District of Columbia: | 3.1% (3,835) |

12:00 a.m. to 4:59 a.m. - Females:
| Washington: | 1.4% (1,709) |
| District of Columbia: | 1.4% (1,709) |
5:00 a.m. to 5:29 a.m. - Females:
| Washington: | 1.7% (2,180) |
| District of Columbia: | 1.7% (2,180) |
5:30 a.m. to 5:59 a.m. - Females:
| Washington: | 2.0% (2,517) |
| District of Columbia: | 2.0% (2,517) |
6:00 a.m. to 6:29 a.m. - Females:
| Washington: | 2.9% (3,674) |
| District of Columbia: | 2.9% (3,674) |
6:30 a.m. to 6:59 a.m. - Females:
| Washington: | 5.3% (6,635) |
| District of Columbia: | 5.3% (6,635) |
7:00 a.m. to 7:29 a.m. - Females:
| Washington: | 12.6% (15,832) |
| District of Columbia: | 12.6% (15,832) |
7:30 a.m. to 7:59 a.m. - Females:
| Washington: | 10.7% (13,455) |
| District of Columbia: | 10.7% (13,455) |
8:00 a.m. to 8:29 a.m. - Females:
| Washington: | 19.3% (24,213) |
| District of Columbia: | 19.3% (24,213) |
8:30 a.m. to 8:59 a.m. - Females:
| Washington: | 16.3% (20,425) |
| District of Columbia: | 16.3% (20,425) |
9:00 a.m. to 9:59 a.m. - Females:
| Washington: | 13.9% (17,393) |
| District of Columbia: | 13.9% (17,393) |
10:00 a.m. to 10:59 a.m. - Females:
| Washington: | 3.4% (4,263) |
| District of Columbia: | 3.4% (4,263) |
11:00 a.m. to 11:59 a.m. - Females:
| Washington: | 1.0% (1,288) |
| District of Columbia: | 1.0% (1,288) |
12:00 p.m. to 3:59 p.m. - Females:
| Washington: | 5.6% (6,977) |
| District of Columbia: | 5.6% (6,977) |
4:00 p.m. to 11:59 p.m. - Females:
| Washington: | 3.8% (4,818) |
| District of Columbia: | 3.8% (4,818) |
Travel time to work
Percentage of workers working in this county: 83.9%
Number of people working at home: 126,259 (33.8% of all workers)
Daytime population change due to commuting: +410,794 (+71.8%)
Workers who live and work in this city: 190,566 (73.0%)
Number of people working at home: 126,259 (33.8% of all workers)
Daytime population change due to commuting: +410,794 (+71.8%)
Workers who live and work in this city: 190,566 (73.0%)


Less than 5 minutes:
| Washington: | 1.0% (5,698) |
| District of Columbia: | 1.0% (5,698) |
5 to 9 minutes:
| Washington: | 2.2% (12,653) |
| District of Columbia: | 2.2% (12,653) |
10 to 14 minutes:
| Washington: | 4.0% (22,782) |
| District of Columbia: | 4.0% (22,782) |
15 to 19 minutes:
| Washington: | 7.7% (43,637) |
| District of Columbia: | 7.7% (43,637) |
20 to 24 minutes:
| Washington: | 10.5% (59,445) |
| District of Columbia: | 10.5% (59,445) |
25 to 29 minutes:
| Washington: | 6.4% (36,151) |
| District of Columbia: | 6.4% (36,151) |
30 to 34 minutes:
| Washington: | 18.0% (102,094) |
| District of Columbia: | 18.0% (102,094) |
35 to 39 minutes:
| Washington: | 5.3% (29,859) |
| District of Columbia: | 5.3% (29,859) |
40 to 44 minutes:
| Washington: | 7.4% (41,732) |
| District of Columbia: | 7.4% (41,732) |
45 to 59 minutes:
| Washington: | 16.0% (90,415) |
| District of Columbia: | 16.0% (90,415) |
60 to 89 minutes:
| Washington: | 16.1% (91,159) |
| District of Columbia: | 16.1% (91,159) |
90 or more minutes:
| Washington: | 5.5% (31,211) |
| District of Columbia: | 5.5% (31,211) |


Less than 5 minutes:
| Washington: | 1.4% (3,782) |
| District of Columbia: | 1.4% (3,782) |
5 to 9 minutes:
| Washington: | 4.8% (12,404) |
| District of Columbia: | 4.8% (12,404) |
10 to 14 minutes:
| Washington: | 8.9% (23,202) |
| District of Columbia: | 8.9% (23,202) |
15 to 19 minutes:
| Washington: | 13.1% (34,257) |
| District of Columbia: | 13.1% (34,257) |
20 to 24 minutes:
| Washington: | 15.5% (40,556) |
| District of Columbia: | 15.5% (40,556) |
25 to 29 minutes:
| Washington: | 6.6% (17,102) |
| District of Columbia: | 6.6% (17,102) |
30 to 34 minutes:
| Washington: | 19.2% (50,138) |
| District of Columbia: | 19.2% (50,138) |
35 to 39 minutes:
| Washington: | 3.6% (9,271) |
| District of Columbia: | 3.6% (9,271) |
40 to 44 minutes:
| Washington: | 4.6% (11,995) |
| District of Columbia: | 4.6% (11,995) |
45 to 59 minutes:
| Washington: | 9.6% (25,167) |
| District of Columbia: | 9.6% (25,167) |
60 to 89 minutes:
| Washington: | 6.1% (15,935) |
| District of Columbia: | 6.1% (15,935) |
90 or more minutes:
| Washington: | 2.7% (7,145) |
| District of Columbia: | 2.7% (7,145) |

Less than 5 minutes - Males:
| Washington: | 1.4% (4,056) |
| District of Columbia: | 1.4% (4,056) |
5 to 9 minutes - Males:
| Washington: | 2.0% (6,006) |
| District of Columbia: | 2.0% (6,006) |
10 to 14 minutes - Males:
| Washington: | 3.7% (11,171) |
| District of Columbia: | 3.7% (11,171) |
15 to 19 minutes - Males:
| Washington: | 6.9% (20,586) |
| District of Columbia: | 6.9% (20,586) |
20 to 24 minutes - Males:
| Washington: | 10.2% (30,616) |
| District of Columbia: | 10.2% (30,616) |
25 to 29 minutes - Males:
| Washington: | 6.3% (19,021) |
| District of Columbia: | 6.3% (19,021) |
30 to 34 minutes - Males:
| Washington: | 17.6% (52,858) |
| District of Columbia: | 17.6% (52,858) |
35 to 39 minutes - Males:
| Washington: | 5.7% (17,010) |
| District of Columbia: | 5.7% (17,010) |
40 to 44 minutes - Males:
| Washington: | 7.3% (21,972) |
| District of Columbia: | 7.3% (21,972) |
45 to 59 minutes - Males:
| Washington: | 16.8% (50,470) |
| District of Columbia: | 16.8% (50,470) |
60 to 89 minutes - Males:
| Washington: | 15.6% (46,841) |
| District of Columbia: | 15.6% (46,841) |
90 or more minutes - Males:
| Washington: | 6.3% (19,018) |
| District of Columbia: | 6.3% (19,018) |

Less than 5 minutes - Females:
| Washington: | 0.6% (1,642) |
| District of Columbia: | 0.6% (1,642) |
5 to 9 minutes - Females:
| Washington: | 2.5% (6,647) |
| District of Columbia: | 2.5% (6,647) |
10 to 14 minutes - Females:
| Washington: | 4.3% (11,611) |
| District of Columbia: | 4.3% (11,611) |
15 to 19 minutes - Females:
| Washington: | 8.6% (23,051) |
| District of Columbia: | 8.6% (23,051) |
20 to 24 minutes - Females:
| Washington: | 10.8% (28,829) |
| District of Columbia: | 10.8% (28,829) |
25 to 29 minutes - Females:
| Washington: | 6.4% (17,130) |
| District of Columbia: | 6.4% (17,130) |
30 to 34 minutes - Females:
| Washington: | 18.4% (49,236) |
| District of Columbia: | 18.4% (49,236) |
35 to 39 minutes - Females:
| Washington: | 4.8% (12,849) |
| District of Columbia: | 4.8% (12,849) |
40 to 44 minutes - Females:
| Washington: | 7.4% (19,760) |
| District of Columbia: | 7.4% (19,760) |
45 to 59 minutes - Females:
| Washington: | 14.9% (39,945) |
| District of Columbia: | 14.9% (39,945) |
60 to 89 minutes - Females:
| Washington: | 16.6% (44,318) |
| District of Columbia: | 16.6% (44,318) |
90 or more minutes - Females:
| Washington: | 4.6% (12,193) |
| District of Columbia: | 4.6% (12,193) |
Means of transportation to work


Drove car alone:
| Washington: | 55.7% (315,829) |
| District of Columbia: | 55.7% (142,605) |
Carpooled:
| Washington: | 8.0% (45,462) |
| District of Columbia: | 8.0% (21,533) |
Bus:
| Washington: | 7.7% (43,620) |
| District of Columbia: | 7.7% (26,704) |
Subway or elevated rail:
| Washington: | 14.7% (83,205) |
| District of Columbia: | 14.7% (40,162) |
Long-distance train or commuter rail:
| Washington: | 1.9% (10,732) |
| District of Columbia: | 1.9% (4,435) |
Light rail, streetcar or trolley:
| Washington: | 0.3% (1,588) |
| District of Columbia: | 0.3% (1,011) |
Ferryboat:
| Washington: | 0.0% (45) |
| District of Columbia: | 0.0% (45) |
Bicycle:
| Washington: | 2.3% (12,831) |
| District of Columbia: | 2.3% (3,548) |
Walked:
| Washington: | 6.8% (38,447) |
| District of Columbia: | 6.8% (20,232) |
Other means:
| Washington: | 2.7% (15,077) |
| District of Columbia: | 2.7% (6,936) |


Drove car alone:
| Washington: | 38.4% (100,168) |
| District of Columbia: | 38.4% (100,168) |
Carpooled:
| Washington: | 11.0% (28,607) |
| District of Columbia: | 11.0% (28,607) |
Bus or trolley bus:
| Washington: | 14.6% (38,163) |
| District of Columbia: | 14.6% (38,163) |
Streetcar or trolley car:
| Washington: | 0.1% (299) |
| District of Columbia: | 0.1% (299) |
Subway or elevated:
| Washington: | 17.4% (45,412) |
| District of Columbia: | 17.4% (45,412) |
Railroad:
| Washington: | 0.2% (577) |
| District of Columbia: | 0.2% (577) |
Ferryboat:
| Washington: | 0.0% (9) |
| District of Columbia: | 0.0% (9) |
Taxicab:
| Washington: | 0.8% (2,033) |
| District of Columbia: | 0.8% (2,033) |
Motorcycle:
| Washington: | 0.1% (202) |
| District of Columbia: | 0.1% (202) |
Bicycle:
| Washington: | 1.2% (3,035) |
| District of Columbia: | 1.2% (3,035) |
Walked:
| Washington: | 11.8% (30,785) |
| District of Columbia: | 11.8% (30,785) |
Other means:
| Washington: | 0.6% (1,664) |
| District of Columbia: | 0.6% (1,664) |


Drove car alone - Males:
| Washington: | 57.8% (173,224) |
| District of Columbia: | 57.8% (142,605) |
Carpooled - Males:
| Washington: | 8.0% (23,929) |
| District of Columbia: | 8.0% (21,533) |
Bus - Males:
| Washington: | 5.6% (16,916) |
| District of Columbia: | 5.6% (26,704) |
Subway or elevated rail - Males:
| Washington: | 14.4% (43,043) |
| District of Columbia: | 14.4% (40,162) |
Long-distance train or commuter rail - Males:
| Washington: | 2.1% (6,297) |
| District of Columbia: | 2.1% (4,435) |
Light rail, streetcar or trolley - Males:
| Washington: | 0.2% (577) |
| District of Columbia: | 0.2% (1,011) |
Bicycle - Males:
| Washington: | 3.1% (9,283) |
| District of Columbia: | 3.1% (3,548) |
Walked - Males:
| Washington: | 6.1% (18,215) |
| District of Columbia: | 6.1% (20,232) |
Other means - Males:
| Washington: | 2.7% (8,141) |
| District of Columbia: | 2.7% (6,936) |


Drove car alone - Females:
| Washington: | 53.4% (142,605) |
| District of Columbia: | 53.4% (142,605) |
Carpooled - Females:
| Washington: | 8.1% (21,533) |
| District of Columbia: | 8.1% (21,533) |
Bus - Females:
| Washington: | 10.0% (26,704) |
| District of Columbia: | 10.0% (26,704) |
Subway or elevated rail - Females:
| Washington: | 15.0% (40,162) |
| District of Columbia: | 15.0% (40,162) |
Long-distance train or commuter rail - Females:
| Washington: | 1.7% (4,435) |
| District of Columbia: | 1.7% (4,435) |
Light rail, streetcar or trolley - Females:
| Washington: | 0.4% (1,011) |
| District of Columbia: | 0.4% (1,011) |
Ferryboat - Females:
| Washington: | 0.0% (45) |
| District of Columbia: | 0.0% (45) |
Bicycle - Females:
| Washington: | 1.3% (3,548) |
| District of Columbia: | 1.3% (3,548) |
Walked - Females:
| Washington: | 7.6% (20,232) |
| District of Columbia: | 7.6% (20,232) |
Other means - Females:
| Washington: | 2.6% (6,936) |
| District of Columbia: | 2.6% (6,936) |
Private vehicle occupancy

Drove alone:
| Washington: | 88.3% (106,315) |
| District of Columbia: | 88.3% (106,315) |
In 2 person carpool:
| Washington: | 9.3% (11,201) |
| District of Columbia: | 9.3% (11,201) |
In 3 person carpool:
| Washington: | 1.1% (1,274) |
| District of Columbia: | 1.1% (1,274) |
In 4 person carpool:
| Washington: | 0.5% (554) |
| District of Columbia: | 0.5% (554) |
In 5-6 person carpool:
| Washington: | 0.6% (691) |
| District of Columbia: | 0.6% (691) |
In 7+ person carpool:
| Washington: | 0.3% (318) |
| District of Columbia: | 0.3% (318) |

Drove alone:
| Washington: | 77.8% (100,168) |
| District of Columbia: | 77.8% (100,168) |
In 2 person carpool:
| Washington: | 16.6% (21,430) |
| District of Columbia: | 16.6% (21,430) |
In 3 person carpool:
| Washington: | 3.5% (4,459) |
| District of Columbia: | 3.5% (4,459) |
In 4 person carpool:
| Washington: | 1.0% (1,266) |
| District of Columbia: | 1.0% (1,266) |
In 5-6 person carpool:
| Washington: | 0.7% (951) |
| District of Columbia: | 0.7% (951) |
In 7+ person carpool:
| Washington: | 0.4% (501) |
| District of Columbia: | 0.4% (501) |
Class of workers
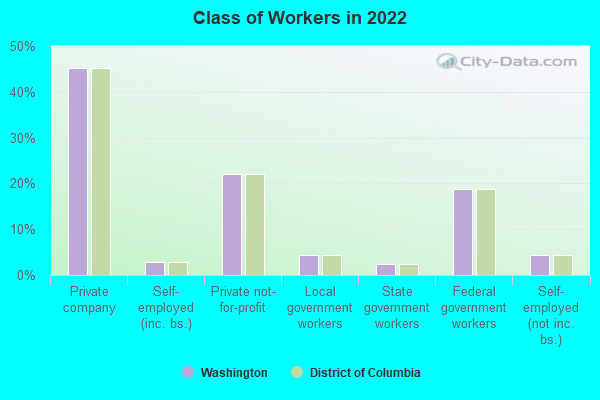
Employee of private company:
| Washington: | 45.1% (169,106) |
| District of Columbia: | 45.1% (169,106) |
Self-employed in own incorporated business:
| Washington: | 2.7% (10,284) |
| District of Columbia: | 2.7% (10,284) |
Private not-for-profit wage and salary workers:
| Washington: | 22.0% (82,656) |
| District of Columbia: | 22.0% (82,656) |
Local government workers:
| Washington: | 4.3% (16,265) |
| District of Columbia: | 4.3% (16,265) |
State government workers:
| Washington: | 2.5% (9,195) |
| District of Columbia: | 2.5% (9,195) |
Federal government workers:
| Washington: | 18.9% (70,717) |
| District of Columbia: | 18.9% (70,717) |
Self-employed workers in own not incorporated business:
| Washington: | 4.3% (16,220) |
| District of Columbia: | 4.3% (16,220) |
Unpaid family workers:
| Washington: | 0.1% (439) |
| District of Columbia: | 0.1% (439) |

Employee of private company:
| Washington: | 50.6% (133,122) |
| District of Columbia: | 50.6% (133,122) |
Self-employed in own incorporated business:
| Washington: | 2.1% (5,452) |
| District of Columbia: | 2.1% (5,452) |
Private not-for-profit wage and salary workers:
| Washington: | 16.1% (42,241) |
| District of Columbia: | 16.1% (42,241) |
Local government workers:
| Washington: | 6.7% (17,524) |
| District of Columbia: | 6.7% (17,524) |
State government workers:
| Washington: | 2.3% (6,090) |
| District of Columbia: | 2.3% (6,090) |
Federal government workers:
| Washington: | 17.0% (44,642) |
| District of Columbia: | 17.0% (44,642) |
Self-employed workers in own not incorporated business:
| Washington: | 5.2% (13,690) |
| District of Columbia: | 5.2% (13,690) |
Unpaid family workers:
| Washington: | 0.1% (347) |
| District of Columbia: | 0.1% (347) |

Employee of private company - Males:
| Washington: | 48.9% (87,279) |
| District of Columbia: | 48.9% (87,279) |
Self-employed in own incorporated business - Males:
| Washington: | 3.9% (6,916) |
| District of Columbia: | 3.9% (6,916) |
Private not-for-profit wage and salary workers - Males:
| Washington: | 17.1% (30,474) |
| District of Columbia: | 17.1% (30,474) |
Local government workers - Males:
| Washington: | 3.8% (6,788) |
| District of Columbia: | 3.8% (6,788) |
State government workers - Males:
| Washington: | 2.0% (3,597) |
| District of Columbia: | 2.0% (3,597) |
Federal government workers - Males:
| Washington: | 18.9% (33,722) |
| District of Columbia: | 18.9% (33,722) |
Self-employed workers in own not incorporated business - Males:
| Washington: | 5.1% (9,113) |
| District of Columbia: | 5.1% (9,113) |
Unpaid family workers - Males:
| Washington: | 0.2% (439) |
| District of Columbia: | 0.2% (439) |

Employee of private company - Females:
| Washington: | 41.6% (81,827) |
| District of Columbia: | 41.6% (81,827) |
Self-employed in own incorporated business - Females:
| Washington: | 1.7% (3,368) |
| District of Columbia: | 1.7% (3,368) |
Private not-for-profit wage and salary workers - Females:
| Washington: | 26.5% (52,182) |
| District of Columbia: | 26.5% (52,182) |
Local government workers - Females:
| Washington: | 4.8% (9,477) |
| District of Columbia: | 4.8% (9,477) |
State government workers - Females:
| Washington: | 2.8% (5,598) |
| District of Columbia: | 2.8% (5,598) |
Federal government workers - Females:
| Washington: | 18.8% (36,995) |
| District of Columbia: | 18.8% (36,995) |
Self-employed workers in own not incorporated business - Females:
| Washington: | 3.6% (7,107) |
| District of Columbia: | 3.6% (7,107) |