Work and Jobs in Washington, Ohio (OH) Detailed Stats
Occupations, Industries, Unemployment, Workers, Commute

Recent posts about work in Washington, Ohio on our local forum with over 2,400,000 registered users:
 | Tell me more about Dayton, Xenia, Beavercreek, and Centerville, please! (72 replies) |
| Ohio, pulled in two directions (157 replies) |
| Ohio's November Unemployment Rate (43 replies) |
| Moving to NE Ohio (Youngstown, Austintown)..Nursing jobs? (21 replies) |
| Mt. Washington neighborhood (10 replies) |
| Accepted job offer in Cincy. Looking to buy a house - where should I look? (27 replies) |
Latest news about work in Washington, OH collected exclusively by city-data.com from local newspapers, TV, and radio stations
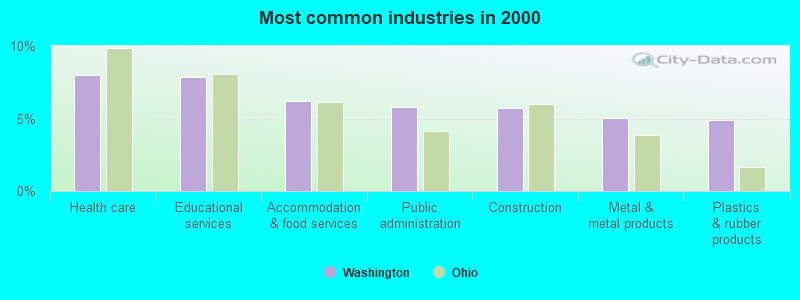
The most common industries in Washington are: Health care (8.0% of civilian employees), Educational services (7.9% of civilian employees), Accommodation & food services (6.2% of civilian employees). 72.4% of workers are employees of private companies, which is about the same as the rate of 71.7% across the entire state of Ohio.
Most common industries
Most common industries | |||
|---|---|---|---|
Industry | All | Males | Females |
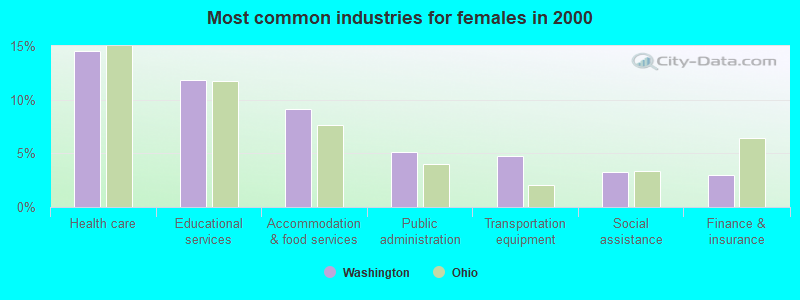
| Health care | 8.0% (494) | 1.7% (55) | 14.6% (439) |
| Educational services | 7.9% (488) | 4.2% (132) | 11.8% (356) |
| Accommodation and food services | 6.2% (383) | 3.4% (107) | 9.2% (276) |
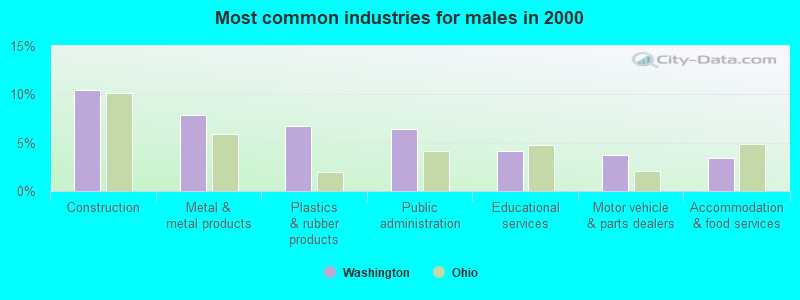
| Public administration | 5.8% (359) | 6.4% (204) | 5.1% (155) |
| Construction | 5.7% (355) | 10.4% (330) | 0.8% (25) |
| Metal and metal products | 5.0% (310) | 7.9% (249) | 2.0% (61) |
| Plastics and rubber products | 4.9% (301) | 6.7% (213) | 2.9% (88) |
| Transportation equipment | 4.0% (248) | 3.3% (105) | 4.7% (143) |
| Food | 2.7% (166) | 2.5% (78) | 2.9% (88) |
| Motor vehicle and parts dealers | 2.6% (160) | 3.7% (117) | 1.4% (43) |
| Administrative and support and waste management services | 2.5% (153) | 2.8% (90) | 2.1% (63) |
| Finance and insurance | 2.5% (153) | 2.0% (64) | 3.0% (89) |
| Air transportation | 2.4% (147) | 2.6% (82) | 2.2% (65) |
| Food and beverage stores | 2.1% (129) | 2.1% (66) | 2.1% (63) |
| Real estate and rental and leasing | 2.0% (126) | 2.1% (67) | 2.0% (59) |
| Truck transportation | 2.0% (123) | 2.9% (93) | 1.0% (30) |
| Religious, grantmaking, civic, professional, and similar organizations | 1.9% (118) | 1.0% (32) | 2.9% (86) |
| Miscellaneous manufacturing | 1.8% (109) | 2.5% (78) | 1.0% (31) |
| Social assistance | 1.8% (109) | 0.4% (12) | 3.2% (97) |
| Department and other general merchandise stores | 1.7% (106) | 1.3% (40) | 2.2% (66) |
| Clothing and accessories, including shoe, stores | 1.7% (104) | 1.4% (45) | 2.0% (59) |
| Building material and garden equipment and supplies dealers | 1.5% (91) | 1.1% (36) | 1.8% (55) |
| Wood products | 1.3% (83) | 2.5% (78) | 0.2% (5) |
| Personal and laundry services | 1.3% (81) | 0.3% (8) | 2.4% (73) |
| Motor vehicles, parts and supplies merchant wholesalers | 1.2% (77) | 0.8% (26) | 1.7% (51) |
| Professional, scientific, and technical services | 1.2% (76) | 0.9% (28) | 1.6% (48) |
| Paper | 1.0% (60) | 0.8% (26) | 1.1% (34) |
| Radio, TV, and computer stores | 0.9% (57) | 1.6% (52) | 0.2% (5) |
| Repair and maintenance | 0.9% (55) | 1.5% (49) | 0.2% (6) |
| Machinery | 0.9% (55) | 1.3% (42) | 0.4% (13) |
| Other transportation, and support activities, and couriers | 0.9% (54) | 1.0% (31) | 0.8% (23) |
| Agriculture, forestry, fishing and hunting | 0.8% (50) | 1.6% (50) | 0.0% (0) |
| Gasoline stations | 0.8% (49) | 0.5% (17) | 1.1% (32) |
| Machinery, equipment, and supplies merchant wholesalers | 0.7% (43) | 1.4% (43) | 0.0% (0) |
| Warehousing and storage | 0.7% (43) | 0.8% (25) | 0.6% (18) |
| Arts, entertainment, and recreation | 0.7% (42) | 0.8% (25) | 0.6% (17) |
| Drugs, sundries, and chemical and allied products merchant wholesalers | 0.7% (42) | 0.6% (18) | 0.8% (24) |
| Chemicals | 0.6% (38) | 1.0% (31) | 0.2% (7) |
| Broadcasting and telecommunications | 0.6% (38) | 1.2% (38) | 0.0% (0) |
| Jewelry, luggage, and leather goods stores | 0.6% (35) | 0.0% (0) | 1.2% (35) |
| Furniture and home furnishings, and household appliance stores | 0.6% (34) | 0.8% (25) | 0.3% (9) |
| Professional and commercial equipment and supplies merchant wholesalers | 0.5% (32) | 0.6% (19) | 0.4% (13) |
| Data processing, libraries, and other information services | 0.5% (31) | 0.2% (5) | 0.9% (26) |
| Publishing, and motion picture and sound recording industries | 0.5% (28) | 0.2% (6) | 0.7% (22) |
| Pharmacies and drug stores | 0.4% (26) | 0.2% (6) | 0.7% (20) |
| Furniture and related product manufacturing | 0.4% (26) | 0.8% (26) | 0.0% (0) |
| Electrical equipment, appliances, and components | 0.4% (24) | 0.6% (20) | 0.1% (4) |
| Used merchandise, gift, novelty, and souvenir, and other miscellaneous stores | 0.4% (23) | 0.2% (7) | 0.5% (16) |
| Groceries and related products merchant wholesalers | 0.3% (21) | 0.5% (16) | 0.2% (5) |
| Other direct selling establishments | 0.3% (21) | 0.2% (7) | 0.5% (14) |
| Printing and related support activities | 0.3% (17) | 0.5% (17) | 0.0% (0) |
| Nonmetallic mineral products | 0.3% (16) | 0.3% (11) | 0.2% (5) |
| Utilities | 0.2% (15) | 0.5% (15) | 0.0% (0) |
| Farm product raw materials merchant wholesalers | 0.2% (12) | 0.2% (7) | 0.2% (5) |
| Farm supplies merchant wholesalers | 0.2% (12) | 0.4% (12) | 0.0% (0) |
| Miscellaneous nondurable goods merchant wholesalers | 0.2% (11) | 0.1% (4) | 0.2% (7) |
| Office supplies and stationery stores | 0.2% (11) | 0.3% (8) | 0.1% (3) |
| Vending machine operators | 0.2% (11) | 0.3% (11) | 0.0% (0) |
| Apparel, fabrics, and notions merchant wholesalers | 0.2% (11) | 0.3% (11) | 0.0% (0) |
| Sporting goods, camera, and hobby and toy stores | 0.2% (10) | 0.3% (10) | 0.0% (0) |
| Lumber and other construction materials merchant wholesalers | 0.2% (10) | 0.3% (10) | 0.0% (0) |
| U. S. Postal service | 0.1% (9) | 0.1% (2) | 0.2% (7) |
| Rail transportation | 0.1% (8) | 0.3% (8) | 0.0% (0) |
| Textile mills and textile products | 0.1% (8) | 0.3% (8) | 0.0% (0) |
| Paper and paper products merchant wholesalers | 0.1% (7) | 0.2% (7) | 0.0% (0) |
| Computer and electronic products | 0.1% (5) | 0.2% (5) | 0.0% (0) |
| Recyclable material merchant wholesalers | 0.1% (5) | 0.2% (5) | 0.0% (0) |
Unemployment in Washington
- Unemployment by race in 2000
- Unemployment rate for White non-Hispanic residents
- 6.4%Males
- 4.9%Females
- Unemployment rate for two or more race residents
- 19.0%Males
- 42.9%Females
- Unemployment rate for Hispanic or Latino residents
- 11.8%Males
Time leaving home to go to work

<5am:
| Washington: | 3.3% (198) |
| Ohio: | 3.1% (165,876) |
5:30am:
| Washington: | 3.2% (193) |
| Ohio: | 2.6% (138,561) |
6am:
| Washington: | 2.7% (166) |
| Ohio: | 4.4% (233,427) |
6:30am:
| Washington: | 9.5% (578) |
| Ohio: | 7.9% (418,394) |
7am:
| Washington: | 11.6% (705) |
| Ohio: | 10.7% (567,735) |
7:30am:
| Washington: | 9.8% (591) |
| Ohio: | 13.7% (729,122) |
8am:
| Washington: | 13.6% (821) |
| Ohio: | 15.2% (806,468) |
8:30am:
| Washington: | 8.8% (535) |
| Ohio: | 9.8% (518,682) |
9am:
| Washington: | 6.8% (412) |
| Ohio: | 5.1% (271,364) |
10am:
| Washington: | 4.3% (263) |
| Ohio: | 5.0% (262,742) |
11am:
| Washington: | 1.0% (58) |
| Ohio: | 2.1% (114,110) |
12pm:
| Washington: | 1.2% (72) |
| Ohio: | 1.1% (57,549) |
4pm:
| Washington: | 10.5% (638) |
| Ohio: | 8.2% (433,530) |
>4pm:
| Washington: | 11.1% (671) |
| Ohio: | 8.4% (443,689) |
Travel time to work
Daytime population change due to commuting: +250 (+1.8%)
Workers who live and work in this city: 3,026 (50.0%)
Workers who live and work in this city: 3,026 (50.0%)


Less than 5 minutes:
| Washington: | 6.9% (420) |
| Ohio: | 3.5% (187,324) |
5 to 9 minutes:
| Washington: | 22.6% (1,366) |
| Ohio: | 11.5% (611,242) |
10 to 14 minutes:
| Washington: | 17.9% (1,086) |
| Ohio: | 15.4% (816,266) |
15 to 19 minutes:
| Washington: | 10.9% (660) |
| Ohio: | 16.3% (867,583) |
20 to 24 minutes:
| Washington: | 6.3% (381) |
| Ohio: | 16.0% (851,177) |
25 to 29 minutes:
| Washington: | 2.8% (172) |
| Ohio: | 7.0% (370,059) |
30 to 34 minutes:
| Washington: | 9.0% (542) |
| Ohio: | 11.9% (630,615) |
35 to 39 minutes:
| Washington: | 2.2% (135) |
| Ohio: | 2.6% (137,481) |
40 to 44 minutes:
| Washington: | 2.1% (126) |
| Ohio: | 2.8% (150,288) |
45 to 59 minutes:
| Washington: | 6.3% (380) |
| Ohio: | 5.4% (286,488) |
60 to 89 minutes:
| Washington: | 6.6% (401) |
| Ohio: | 2.9% (155,240) |
90 or more minutes:
| Washington: | 3.8% (232) |
| Ohio: | 1.8% (97,486) |
Means of transportation to work

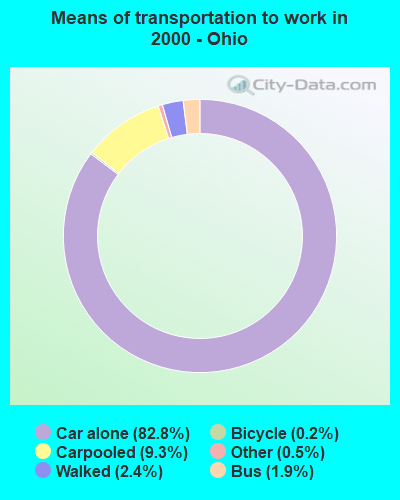
Drove car alone:
| Washington: | 80.7% (4,884) |
| Ohio: | 82.8% (4,392,059) |
Carpooled:
| Washington: | 12.1% (734) |
| Ohio: | 9.3% (494,602) |
Bus or trolley bus:
| Washington: | 0.1% (7) |
| Ohio: | 1.9% (99,481) |
Taxicab:
| Washington: | 0.2% (14) |
| Ohio: | 0.1% (4,815) |
Bicycle:
| Washington: | 0.1% (5) |
| Ohio: | 0.2% (9,535) |
Walked:
| Washington: | 3.1% (186) |
| Ohio: | 2.4% (125,882) |
Other means:
| Washington: | 1.2% (71) |
| Ohio: | 0.5% (26,528) |
Private vehicle occupancy

Drove alone:
| Washington: | 86.9% (4,884) |
| Ohio: | 89.9% (4,392,059) |
In 2 person carpool:
| Washington: | 10.8% (605) |
| Ohio: | 8.4% (410,255) |
In 3 person carpool:
| Washington: | 1.8% (103) |
| Ohio: | 1.1% (54,916) |
In 4 person carpool:
| Washington: | 0.2% (14) |
| Ohio: | 0.4% (17,290) |
In 5-6 person carpool:
| Washington: | 0.2% (12) |
| Ohio: | 0.2% (7,498) |
Class of workers

Employee of private company:
| Washington: | 72.4% (4,472) |
| Ohio: | 71.7% (3,871,510) |
Self-employed in own incorporated business:
| Washington: | 1.4% (86) |
| Ohio: | 2.5% (137,721) |
Private not-for-profit wage and salary workers:
| Washington: | 5.6% (348) |
| Ohio: | 7.8% (422,430) |
Local government workers:
| Washington: | 9.0% (554) |
| Ohio: | 7.1% (382,502) |
State government workers:
| Washington: | 4.0% (247) |
| Ohio: | 3.3% (176,542) |
Federal government workers:
| Washington: | 0.8% (52) |
| Ohio: | 1.9% (102,527) |
Self-employed workers in own not incorporated business:
| Washington: | 6.6% (410) |
| Ohio: | 5.5% (295,088) |
Unpaid family workers:
| Washington: | 0.2% (12) |
| Ohio: | 0.3% (13,855) |

Employee of private company - Males:
| Washington: | 75.5% (2,393) |
| Ohio: | 74.9% (2,129,758) |
Self-employed in own incorporated business - Males:
| Washington: | 1.7% (54) |
| Ohio: | 3.6% (102,054) |
Private not-for-profit wage and salary workers - Males:
| Washington: | 2.5% (79) |
| Ohio: | 4.4% (125,856) |
Local government workers - Males:
| Washington: | 7.1% (226) |
| Ohio: | 5.6% (159,771) |
State government workers - Males:
| Washington: | 4.2% (134) |
| Ohio: | 2.7% (77,710) |
Federal government workers - Males:
| Washington: | 1.1% (34) |
| Ohio: | 1.9% (54,034) |
Self-employed workers in own not incorporated business - Males:
| Washington: | 7.7% (244) |
| Ohio: | 6.7% (189,395) |
Unpaid family workers - Males:
| Washington: | 0.2% (6) |
| Ohio: | 0.2% (6,576) |

Employee of private company - Females:
| Washington: | 69.0% (2,079) |
| Ohio: | 68.1% (1,741,752) |
Self-employed in own incorporated business - Females:
| Washington: | 1.1% (32) |
| Ohio: | 1.4% (35,667) |
Private not-for-profit wage and salary workers - Females:
| Washington: | 8.9% (269) |
| Ohio: | 11.6% (296,574) |
Local government workers - Females:
| Washington: | 10.9% (328) |
| Ohio: | 8.7% (222,731) |
State government workers - Females:
| Washington: | 3.8% (113) |
| Ohio: | 3.9% (98,832) |
Federal government workers - Females:
| Washington: | 0.6% (18) |
| Ohio: | 1.9% (48,493) |
Self-employed workers in own not incorporated business - Females:
| Washington: | 5.5% (166) |
| Ohio: | 4.1% (105,693) |
Unpaid family workers - Females:
| Washington: | 0.2% (6) |
| Ohio: | 0.3% (7,279) |