Work and Jobs in Westside, California (CA) Detailed Stats
Occupations, Industries, Unemployment, Workers, Commute
Settings
X

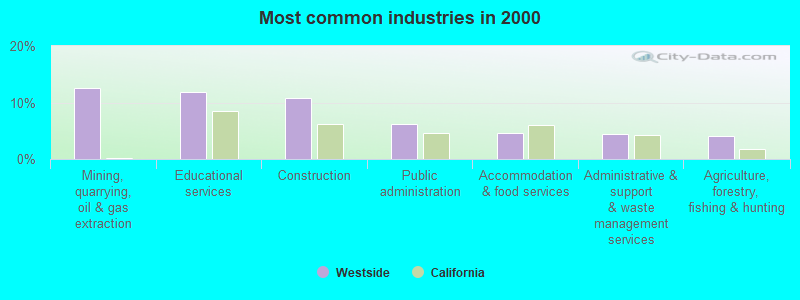
The most common industries in Westside are: Mining, quarrying, oil & gas extraction (12.6% of civilian employees), Educational services (11.9% of civilian employees), Construction (10.8% of civilian employees). 65.4% of workers are employees of private companies, which is 4.0% less than the rate of 68.0% across the entire state of California.
Most common industries
Most common industries | |||
|---|---|---|---|
Industry | All | Males | Females |
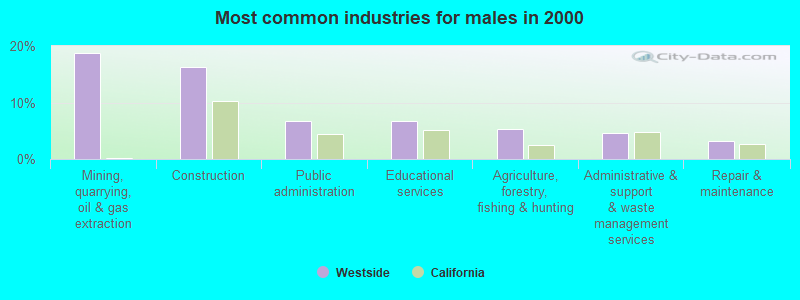
| Mining, quarrying, and oil and gas extraction | 12.6% (1,099) | 18.7% (985) | 3.3% (114) |
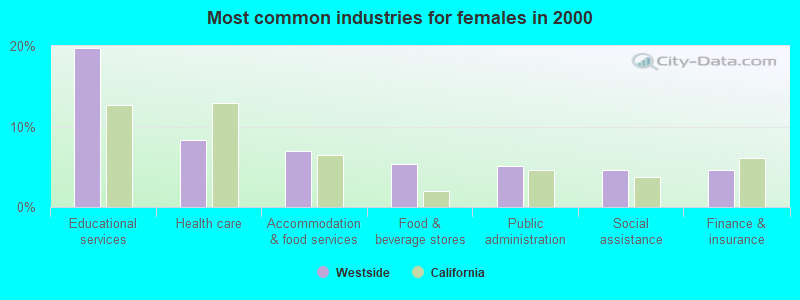
| Educational services | 11.9% (1,038) | 6.7% (350) | 19.8% (688) |
| Construction | 10.8% (940) | 16.2% (852) | 2.5% (88) |
| Public administration | 6.1% (535) | 6.8% (358) | 5.1% (177) |
| Accommodation and food services | 4.7% (410) | 3.2% (169) | 6.9% (241) |
| Administrative and support and waste management services | 4.4% (388) | 4.6% (240) | 4.3% (148) |
| Agriculture, forestry, fishing and hunting | 4.0% (350) | 5.3% (280) | 2.0% (70) |
| Health care | 3.7% (326) | 0.7% (36) | 8.3% (290) |
| Food and beverage stores | 3.0% (261) | 1.4% (74) | 5.4% (187) |
| Professional, scientific, and technical services | 2.5% (220) | 1.5% (78) | 4.1% (142) |
| Arts, entertainment, and recreation | 2.4% (211) | 2.1% (110) | 2.9% (101) |
| Repair and maintenance | 2.4% (208) | 3.3% (171) | 1.1% (37) |
| Real estate and rental and leasing | 2.3% (197) | 2.7% (142) | 1.6% (55) |
| Finance and insurance | 2.2% (196) | 0.7% (38) | 4.5% (158) |
| Truck transportation | 2.0% (171) | 3.0% (159) | 0.3% (12) |
| Utilities | 1.9% (163) | 2.0% (104) | 1.7% (59) |
| Social assistance | 1.9% (162) | 0.0% (0) | 4.7% (162) |
| Department and other general merchandise stores | 1.4% (121) | 0.5% (25) | 2.8% (96) |
| Miscellaneous manufacturing | 1.2% (103) | 1.9% (99) | 0.1% (4) |
| Other transportation, and support activities, and couriers | 1.1% (99) | 1.3% (70) | 0.8% (29) |
| Religious, grantmaking, civic, professional, and similar organizations | 1.1% (95) | 0.8% (43) | 1.5% (52) |
| U. S. Postal service | 1.1% (93) | 0.4% (20) | 2.1% (73) |
| Nonmetallic mineral products | 1.0% (91) | 1.5% (81) | 0.3% (10) |
| Motor vehicle and parts dealers | 1.0% (84) | 0.9% (45) | 1.1% (39) |
| Machinery, equipment, and supplies merchant wholesalers | 0.9% (83) | 1.4% (72) | 0.3% (11) |
| Gasoline stations | 0.9% (79) | 0.4% (20) | 1.7% (59) |
| Computer and electronic products | 0.8% (72) | 1.0% (54) | 0.5% (18) |
| Personal and laundry services | 0.7% (62) | 0.0% (2) | 1.7% (60) |
| Chemicals | 0.7% (62) | 1.0% (54) | 0.2% (8) |
| Metal and metal products | 0.6% (54) | 1.0% (50) | 0.1% (4) |
| Publishing, and motion picture and sound recording industries | 0.5% (45) | 0.7% (37) | 0.2% (8) |
| Printing and related support activities | 0.4% (39) | 0.7% (39) | 0.0% (0) |
| Broadcasting and telecommunications | 0.4% (38) | 0.7% (38) | 0.0% (0) |
| Petroleum and petroleum products merchant wholesalers | 0.4% (37) | 0.7% (37) | 0.0% (0) |
| Transportation equipment | 0.4% (34) | 0.4% (23) | 0.3% (11) |
| Other direct selling establishments | 0.4% (32) | 0.1% (4) | 0.8% (28) |
| Groceries and related products merchant wholesalers | 0.4% (32) | 0.3% (16) | 0.5% (16) |
| Drugs, sundries, and chemical and allied products merchant wholesalers | 0.4% (31) | 0.3% (15) | 0.5% (16) |
| Private households | 0.3% (30) | 0.0% (0) | 0.9% (30) |
| Miscellaneous durable goods merchant wholesalers | 0.3% (27) | 0.3% (14) | 0.4% (13) |
| Used merchandise, gift, novelty, and souvenir, and other miscellaneous stores | 0.3% (25) | 0.4% (20) | 0.1% (5) |
| Furniture and home furnishings, and household appliance stores | 0.3% (25) | 0.4% (19) | 0.2% (6) |
| Machinery | 0.3% (24) | 0.2% (8) | 0.5% (16) |
| Food | 0.3% (23) | 0.4% (23) | 0.0% (0) |
| Professional and commercial equipment and supplies merchant wholesalers | 0.3% (23) | 0.1% (5) | 0.5% (18) |
| Beverage and tobacco products | 0.3% (22) | 0.3% (15) | 0.2% (7) |
| Building material and garden equipment and supplies dealers | 0.3% (22) | 0.4% (22) | 0.0% (0) |
| Motor vehicles, parts and supplies merchant wholesalers | 0.2% (21) | 0.2% (11) | 0.3% (10) |
| Miscellaneous nondurable goods merchant wholesalers | 0.2% (21) | 0.2% (11) | 0.3% (10) |
| Clothing and accessories, including shoe, stores | 0.2% (19) | 0.0% (0) | 0.5% (19) |
| Book stores and news dealers | 0.2% (18) | 0.1% (5) | 0.4% (13) |
| Warehousing and storage | 0.2% (17) | 0.2% (12) | 0.1% (5) |
| Electrical and electronic goods merchant wholesalers | 0.1% (13) | 0.2% (10) | 0.1% (3) |
| Management of companies and enterprises | 0.1% (12) | 0.0% (0) | 0.3% (12) |
| Radio, TV, and computer stores | 0.1% (12) | 0.2% (10) | 0.1% (2) |
| Health and personal care, except drug, stores | 0.1% (12) | 0.0% (0) | 0.3% (12) |
| Data processing, libraries, and other information services | 0.1% (11) | 0.1% (4) | 0.2% (7) |
| Pharmacies and drug stores | 0.1% (11) | 0.1% (4) | 0.2% (7) |
| Paper | 0.1% (11) | 0.2% (11) | 0.0% (0) |
| Leather and allied products | 0.1% (9) | 0.2% (9) | 0.0% (0) |
| Electronic shopping and mail-order houses | 0.1% (9) | 0.0% (0) | 0.3% (9) |
| Furniture and related product manufacturing | 0.1% (9) | 0.2% (9) | 0.0% (0) |
| Electrical equipment, appliances, and components | 0.1% (9) | 0.2% (9) | 0.0% (0) |
| Metals and minerals, except petroleum, merchant wholesalers | 0.1% (8) | 0.2% (8) | 0.0% (0) |
| Lumber and other construction materials merchant wholesalers | 0.1% (8) | 0.2% (8) | 0.0% (0) |
| Petroleum and coal products | 0.1% (7) | 0.1% (7) | 0.0% (0) |
| Alcoholic beverages merchant wholesalers | 0.1% (6) | 0.1% (6) | 0.0% (0) |
Unemployment in Westside
- Unemployment by race in 2000
- Unemployment rate for White non-Hispanic residents
- 7.7%Males
- 8.5%Females
- Unemployment rate for American Indian and Alaska Native residents
- 8.3%Males
- 23.8%Females
- Unemployment rate for Asian residents
- 15.7%Females
- Unemployment rate for other race residents
- 30.6%Males
- 40.3%Females
- Unemployment rate for two or more race residents
- 31.8%Males
- 23.5%Females
- Unemployment rate for Hispanic or Latino residents
- 23.3%Males
- 31.3%Females
Time leaving home to go to work

<5am:
| Westside: | 9.0% (772) |
| California: | 4.2% (606,086) |
5:30am:
| Westside: | 6.9% (587) |
| California: | 3.6% (523,209) |
6am:
| Westside: | 9.9% (849) |
| California: | 4.8% (692,256) |
6:30am:
| Westside: | 16.0% (1,370) |
| California: | 8.4% (1,216,867) |
7am:
| Westside: | 9.1% (775) |
| California: | 9.4% (1,362,830) |
7:30am:
| Westside: | 8.6% (735) |
| California: | 13.8% (2,006,950) |
8am:
| Westside: | 10.1% (863) |
| California: | 13.7% (1,986,831) |
8:30am:
| Westside: | 6.6% (563) |
| California: | 10.9% (1,577,815) |
9am:
| Westside: | 2.3% (201) |
| California: | 5.4% (778,152) |
10am:
| Westside: | 3.5% (301) |
| California: | 6.7% (972,355) |
11am:
| Westside: | 2.0% (168) |
| California: | 2.9% (414,479) |
12pm:
| Westside: | 0.6% (54) |
| California: | 1.3% (189,005) |
4pm:
| Westside: | 5.4% (462) |
| California: | 6.0% (865,284) |
>4pm:
| Westside: | 7.2% (615) |
| California: | 5.3% (776,167) |
Travel time to work


Less than 5 minutes:
| Westside: | 7.7% (657) |
| California: | 2.2% (324,703) |
5 to 9 minutes:
| Westside: | 21.3% (1,819) |
| California: | 8.8% (1,280,443) |
10 to 14 minutes:
| Westside: | 16.8% (1,437) |
| California: | 13.3% (1,930,263) |
15 to 19 minutes:
| Westside: | 11.1% (948) |
| California: | 14.9% (2,157,970) |
20 to 24 minutes:
| Westside: | 6.1% (523) |
| California: | 13.8% (2,004,060) |
25 to 29 minutes:
| Westside: | 1.6% (137) |
| California: | 5.4% (782,241) |
30 to 34 minutes:
| Westside: | 8.6% (737) |
| California: | 13.9% (2,025,657) |
35 to 39 minutes:
| Westside: | 0.5% (45) |
| California: | 2.5% (366,487) |
40 to 44 minutes:
| Westside: | 2.0% (173) |
| California: | 3.6% (528,043) |
45 to 59 minutes:
| Westside: | 8.0% (687) |
| California: | 7.9% (1,151,598) |
60 to 89 minutes:
| Westside: | 8.6% (737) |
| California: | 6.4% (933,123) |
90 or more minutes:
| Westside: | 4.9% (415) |
| California: | 3.3% (483,698) |
Means of transportation to work


Drove car alone:
| Westside: | 72.8% (6,228) |
| California: | 71.8% (10,432,462) |
Carpooled:
| Westside: | 18.2% (1,561) |
| California: | 14.5% (2,113,313) |
Bus or trolley bus:
| Westside: | 0.3% (23) |
| California: | 3.8% (549,425) |
Subway or elevated:
| Westside: | 0.1% (8) |
| California: | 0.7% (107,711) |
Taxicab:
| Westside: | 0.4% (32) |
| California: | 0.1% (9,890) |
Motorcycle:
| Westside: | 0.2% (13) |
| California: | 0.2% (36,262) |
Bicycle:
| Westside: | 0.3% (24) |
| California: | 0.8% (120,567) |
Walked:
| Westside: | 3.6% (309) |
| California: | 2.9% (414,581) |
Other means:
| Westside: | 1.4% (117) |
| California: | 0.8% (115,064) |
Private vehicle occupancy

Drove alone:
| Westside: | 80.0% (6,228) |
| California: | 83.2% (10,432,462) |
In 2 person carpool:
| Westside: | 13.9% (1,081) |
| California: | 12.5% (1,564,905) |
In 3 person carpool:
| Westside: | 4.3% (332) |
| California: | 2.6% (330,732) |
In 4 person carpool:
| Westside: | 0.9% (67) |
| California: | 1.0% (119,364) |
In 5-6 person carpool:
| Westside: | 0.6% (44) |
| California: | 0.5% (57,036) |
In 7+ person carpool:
| Westside: | 0.5% (37) |
| California: | 0.3% (41,276) |
Class of workers

Employee of private company:
| Westside: | 65.4% (5,718) |
| California: | 68.0% (10,009,465) |
Self-employed in own incorporated business:
| Westside: | 2.5% (215) |
| California: | 2.7% (402,392) |
Private not-for-profit wage and salary workers:
| Westside: | 3.5% (303) |
| California: | 5.7% (845,536) |
Local government workers:
| Westside: | 10.4% (910) |
| California: | 8.3% (1,218,764) |
State government workers:
| Westside: | 4.7% (413) |
| California: | 4.0% (594,953) |
Federal government workers:
| Westside: | 3.6% (318) |
| California: | 2.3% (344,354) |
Self-employed workers in own not incorporated business:
| Westside: | 8.9% (782) |
| California: | 8.5% (1,249,530) |
Unpaid family workers:
| Westside: | 0.9% (83) |
| California: | 0.4% (53,934) |

Employee of private company - Males:
| Westside: | 71.0% (3,734) |
| California: | 71.1% (5,716,697) |
Self-employed in own incorporated business - Males:
| Westside: | 3.0% (156) |
| California: | 3.6% (290,657) |
Private not-for-profit wage and salary workers - Males:
| Westside: | 1.3% (70) |
| California: | 3.8% (303,997) |
Local government workers - Males:
| Westside: | 8.0% (421) |
| California: | 6.2% (495,927) |
State government workers - Males:
| Westside: | 3.9% (205) |
| California: | 3.2% (255,434) |
Federal government workers - Males:
| Westside: | 2.8% (145) |
| California: | 2.5% (198,555) |
Self-employed workers in own not incorporated business - Males:
| Westside: | 9.3% (487) |
| California: | 9.5% (760,853) |
Unpaid family workers - Males:
| Westside: | 0.8% (43) |
| California: | 0.3% (23,230) |

Employee of private company - Females:
| Westside: | 57.0% (1,984) |
| California: | 64.3% (4,292,768) |
Self-employed in own incorporated business - Females:
| Westside: | 1.7% (59) |
| California: | 1.7% (111,735) |
Private not-for-profit wage and salary workers - Females:
| Westside: | 6.7% (233) |
| California: | 8.1% (541,539) |
Local government workers - Females:
| Westside: | 14.0% (489) |
| California: | 10.8% (722,837) |
State government workers - Females:
| Westside: | 6.0% (208) |
| California: | 5.1% (339,519) |
Federal government workers - Females:
| Westside: | 5.0% (173) |
| California: | 2.2% (145,799) |
Self-employed workers in own not incorporated business - Females:
| Westside: | 8.5% (295) |
| California: | 7.3% (488,677) |
Unpaid family workers - Females:
| Westside: | 1.1% (40) |
| California: | 0.5% (30,704) |