Work and Jobs in Williams, Arizona (AZ) Detailed Stats
Data:
Unemployment (%)
Unemployment (% change since 2000)
Unemployment (%) - White
Unemployment (% change since 2000) - White
Unemployment (%) - Black or African American
Unemployment (% change since 2000) - Black or African American
Unemployment (%) - Asian
Unemployment (% change since 2000) - Asian
Unemployment (%) - Hispanic or Latino
Unemployment (% change since 2000) - Hispanic or Latino
Unemployment (%) - American Indian and Alaska Native
Unemployment (% change since 2000) - American Indian and Alaska Native
Unemployment (%) - Multirace
Unemployment (% change since 2000) - Multirace
Unemployment (%) - Other Race
Unemployment (% change since 2000) - Other Race
Industry diversity
Most Common Industries - Agriculture, forestry, fishing and hunting, and mining (%)
Most Common Industries - Agriculture, forestry, fishing and hunting (%)
Most Common Industries - Mining, quarrying, and oil and gas extraction (%)
Most Common Industries - Construction (%)
Most Common Industries - Manufacturing (%)
Most Common Industries - Wholesale trade (%)
Most Common Industries - Retail trade (%)
Most Common Industries - Transportation and warehousing, and utilities (%)
Most Common Industries - Transportation and warehousing (%)
Most Common Industries - Utilities (%)
Most Common Industries - Information (%)
Most Common Industries - Finance and insurance, and real estate and rental and leasing (%)
Most Common Industries - Finance and insurance (%)
Most Common Industries - Real estate and rental and leasing (%)
Most Common Industries - Professional, scientific, and management, and administrative and waste management services (%)
Most Common Industries - Professional, scientific, and technical services (%)
Most Common Industries - Management of companies and enterprises (%)
Most Common Industries - Administrative and support and waste management services (%)
Most Common Industries - Educational services, and health care and social assistance (%)
Most Common Industries - Educational services (%)
Most Common Industries - Health care and social assistance (%)
Most Common Industries - Arts, entertainment, and recreation, and accommodation and food services (%)
Most Common Industries - Arts, entertainment, and recreation (%)
Most Common Industries - Accommodation and food services (%)
Most Common Industries - Other services, except public administration (%)
Most Common Industries - Public administration (%)
Occupation diversity
Most Common Occupations - Management, business, science, and arts occupations (%)
Most Common Occupations - Management, business, and financial occupations (%)
Most Common Occupations - Management occupations (%)
Most Common Occupations - Business and financial operations occupations (%)
Most Common Occupations - Computer, engineering, and science occupations (%)
Most Common Occupations - Computer and mathematical occupations (%)
Most Common Occupations - Architecture and engineering occupations (%)
Most Common Occupations - Life, physical, and social science occupations (%)
Most Common Occupations - Education, legal, community service, arts, and media occupations (%)
Most Common Occupations - Community and social service occupations (%)
Most Common Occupations - Legal occupations (%)
Most Common Occupations - Education, training, and library occupations (%)
Most Common Occupations - Arts, design, entertainment, sports, and media occupations (%)
Most Common Occupations - Healthcare practitioners and technical occupations (%)
Most Common Occupations - Health diagnosing and treating practitioners and other technical occupations (%)
Most Common Occupations - Health technologists and technicians (%)
Most Common Occupations - Service occupations (%)
Most Common Occupations - Healthcare support occupations (%)
Most Common Occupations - Protective service occupations (%)
Most Common Occupations - Fire fighting and prevention, and other protective service workers including supervisors (%)
Most Common Occupations - Law enforcement workers including supervisors (%)
Most Common Occupations - Food preparation and serving related occupations (%)
Most Common Occupations - Building and grounds cleaning and maintenance occupations (%)
Most Common Occupations - Personal care and service occupations (%)
Most Common Occupations - Sales and office occupations (%)
Most Common Occupations - Sales and related occupations (%)
Most Common Occupations - Office and administrative support occupations (%)
Most Common Occupations - Natural resources, construction, and maintenance occupations (%)
Most Common Occupations - Farming, fishing, and forestry occupations (%)
Most Common Occupations - Construction and extraction occupations (%)
Most Common Occupations - Installation, maintenance, and repair occupations (%)
Most Common Occupations - Production, transportation, and material moving occupations (%)
Most Common Occupations - Production occupations (%)
Most Common Occupations - Transportation occupations (%)
Most Common Occupations - Material moving occupations (%)
Private vehicle occupancy - Drove alone (% change since 2000)
Private vehicle occupancy - Carpooled (%)
Private vehicle occupancy - Carpooled (% change since 2000)
Private vehicle occupancy - In 2-person carpool (%)
Private vehicle occupancy - In 2-person carpool (% change since 2000)
Private vehicle occupancy - In 3-person carpool (%)
Private vehicle occupancy - In 3-person carpool (% change since 2000)
Private vehicle occupancy - In 4-person carpool (%)
Private vehicle occupancy - In 4-person carpool (% change since 2000)
Private vehicle occupancy - In 5- or 6-person carpool (%)
Private vehicle occupancy - In 5- or 6-person carpool (% change since 2000)
Private vehicle occupancy - In 7-or-more-person carpool (%)
Private vehicle occupancy - In 7-or-more-person carpool (% change since 2000)
Time Leaving Home To Go To Work - 12:00 a.m. to 4:59 a.m. (%)
Time Leaving Home To Go To Work - 12:00 a.m. to 4:59 a.m. (% change since 2000)
Time Leaving Home To Go To Work - 5:00 a.m. to 5:59 a.m. (%)
Time Leaving Home To Go To Work - 5:00 a.m. to 5:59 a.m. (% change since 2000)
Time Leaving Home To Go To Work - 6:00 a.m. to 6:59 a.m. (%)
Time Leaving Home To Go To Work - 6:00 a.m. to 6:59 a.m. (% change since 2000)
Time Leaving Home To Go To Work - 7:00 a.m. to 7:59 a.m. (%)
Time Leaving Home To Go To Work - 7:00 a.m. to 7:59 a.m. (% change since 2000)
Time Leaving Home To Go To Work - 8:00 a.m. to 8:59 a.m. (%)
Time Leaving Home To Go To Work - 8:00 a.m. to 8:59 a.m. (% change since 2000)
Time Leaving Home To Go To Work - 9:00 a.m. to 9:59 a.m. (%)
Time Leaving Home To Go To Work - 9:00 a.m. to 9:59 a.m. (% change since 2000)
Time Leaving Home To Go To Work - 10:00 a.m. to 10:59 a.m. (%)
Time Leaving Home To Go To Work - 10:00 a.m. to 10:59 a.m. (% change since 2000)
Time Leaving Home To Go To Work - 11:00 a.m. to 11:59 a.m. (%)
Time Leaving Home To Go To Work - 11:00 a.m. to 11:59 a.m. (% change since 2000)
Time Leaving Home To Go To Work - 12:00 p.m. to 3:59 p.m. (%)
Time Leaving Home To Go To Work - 12:00 p.m. to 3:59 p.m. (% change since 2000)
Time Leaving Home To Go To Work - 4:00 p.m. to 11:59 p.m. (%)
Time Leaving Home To Go To Work - 4:00 p.m. to 11:59 p.m. (% change since 2000)
Class of Workers - Employee of private company (%)
Class of Workers - Employee of private company (% change since 2000)
Class of Workers - Self-employed in own incorporated business (%)
Class of Workers - Self-employed in own incorporated business (% change since 2000)
Class of Workers - Private not-for-profit wage and salary workers (%)
Class of Workers - Private not-for-profit wage and salary workers (% change since 2000)
Class of Workers - Local government workers (%)
Class of Workers - Local government workers (% change since 2000)
Class of Workers - State government workers (%)
Class of Workers - State government workers (% change since 2000)
Class of Workers - Federal government workers (%)
Class of Workers - Federal government workers (% change since 2000)
Class of Workers - Self-employed workers in own not incorporated business and Unpaid family workers (%)
Class of Workers - Self-employed workers in own not incorporated business and Unpaid family workers (% change since 2000)
Means of transportation to work - Drove car alone (%)
Means of transportation to work - Drove car alone (% change since 2000)
Means of transportation to work - Carpooled (%)
Means of transportation to work - Carpooled (% change since 2000)
Means of transportation to work - Public transportation (%)
Means of transportation to work - Public transportation (% change since 2000)
Means of transportation to work - Bus or trolley bus (%)
Means of transportation to work - Bus or trolley bus (% change since 2000)
Means of transportation to work - Streetcar or trolley car (%)
Means of transportation to work - Streetcar or trolley car (% change since 2000)
Means of transportation to work - Subway or elevated (%)
Means of transportation to work - Subway or elevated (% change since 2000)
Means of transportation to work - Railroad (%)
Means of transportation to work - Railroad (% change since 2000)
Means of transportation to work - Ferryboat (%)
Means of transportation to work - Ferryboat (% change since 2000)
Means of transportation to work - Taxicab (%)
Means of transportation to work - Taxicab (% change since 2000)
Means of transportation to work - Motorcycle (%)
Means of transportation to work - Motorcycle (% change since 2000)
Means of transportation to work - Bicycle (%)
Means of transportation to work - Bicycle (% change since 2000)
Means of transportation to work - Walked (%)
Means of transportation to work - Walked (% change since 2000)
Means of transportation to work - Other means (%)
Means of transportation to work - Other means (% change since 2000)
Working at home (%)
Working at home (% change since 2000)
Travel time to work - Less than 5 minutes (%)
Travel time to work - Less than 5 minutes (% change since 2000)
Travel time to work - 5 to 9 minutes (%)
Travel time to work - 5 to 9 minutes (% change since 2000)
Travel time to work - 10 to 19 minutes (%)
Travel time to work - 10 to 19 minutes (% change since 2000)
Travel time to work - 20 to 29 minutes (%)
Travel time to work - 20 to 29 minutes (% change since 2000)
Travel time to work - 30 to 39 minutes (%)
Travel time to work - 30 to 39 minutes (% change since 2000)
Travel time to work - 40 to 59 minutes (%)
Travel time to work - 40 to 59 minutes (% change since 2000)
Travel time to work - 60 to 89 minutes (%)
Travel time to work - 60 to 89 minutes (% change since 2000)
Travel time to work - 90 or more minutes (%)
Travel time to work - 90 or more minutes (% change since 2000)
Latest news about work in Williams, AZ collected exclusively by city-data.com from local newspapers, TV, and radio stations
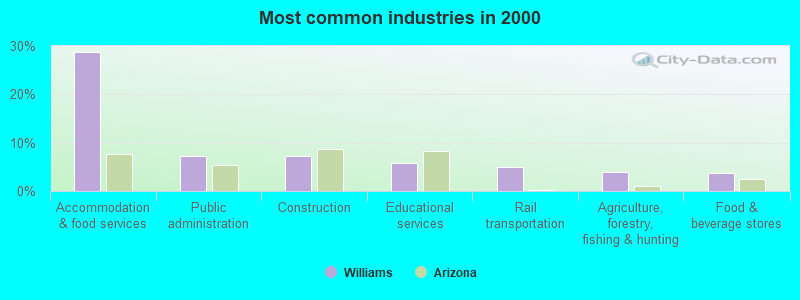
The most common industries in Williams are: Accommodation & food services (28.8% of civilian employees), Public administration (7.2% of civilian employees), Construction (7.2% of civilian employees). 94.8% of workers work in Coconino County and 4.9% of all workers work at home. 73.8% of workers are employees of private companies, which is 6.1% greater than the rate of 69.3% across the entire state of Arizona.
Whole page based on the data from 2000 / 2022 when the population of Williams, Arizona was 2,842 / 3,260
Most common industries
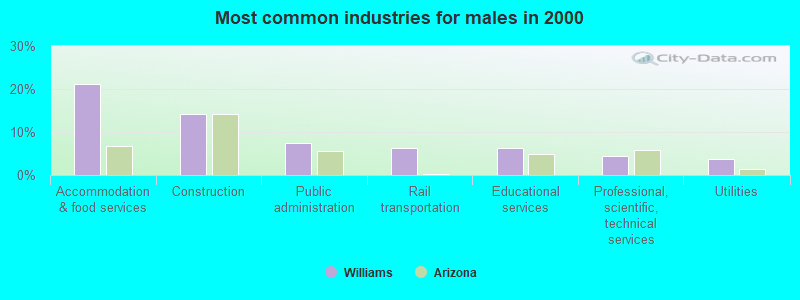
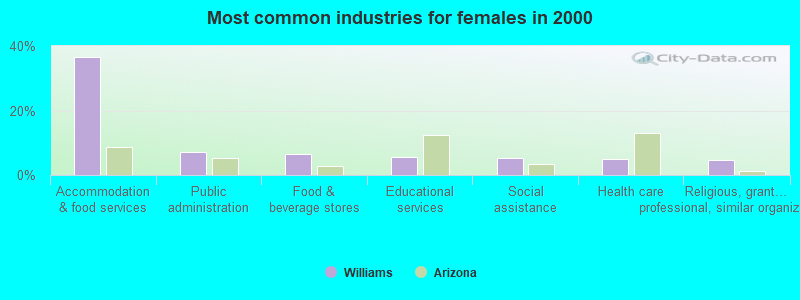
Most common industries Industry All Males Females
Accommodation and food services 28.8% 21.2% 36.5% Public administration 7.2% 7.4% 7.1% Construction 7.2% 14.1% 0.3% Educational services 5.9% 6.3% 5.4% Rail transportation 4.9% 6.3% 3.5% Agriculture, forestry, fishing and hunting 3.8% 3.3% 4.4% Food and beverage stores 3.7% 0.8% 6.6% Health care 3.4% 2.0% 4.8% Religious, grantmaking, civic, professional, and similar organizations 3.2% 1.7% 4.7% Social assistance 2.6% 0.0% 5.1% Professional, scientific, and technical services 2.6% 4.4% 0.8% Administrative and support and waste management services 2.4% 3.6% 1.2% Utilities 1.9% 3.8% 0.0% Finance and insurance 1.6% 0.0% 3.2% Transportation equipment 1.5% 2.0% 1.1% Miscellaneous manufacturing 1.5% 1.1% 2.0% Pharmacies and drug stores 1.5% 1.2% 1.8% Real estate and rental and leasing 1.4% 2.0% 0.9% Arts, entertainment, and recreation 1.4% 2.1% 0.6% Miscellaneous nondurable goods merchant wholesalers 1.3% 0.8% 1.8% Motor vehicle and parts dealers 1.2% 2.4% 0.0% Publishing, and motion picture and sound recording industries 1.0% 1.1% 0.9% Building material and garden equipment and supplies dealers 0.9% 1.8% 0.0% U. S. Postal service 0.9% 0.0% 1.8% Broadcasting and telecommunications 0.8% 0.0% 1.7% Data processing, libraries, and other information services 0.8% 0.8% 0.9% Gasoline stations 0.8% 1.5% 0.0% Petroleum and petroleum products merchant wholesalers 0.7% 0.0% 1.4% Metal and metal products 0.6% 1.2% 0.0% Repair and maintenance 0.5% 1.1% 0.0% Food 0.5% 0.0% 0.9% Other transportation, and support activities, and couriers 0.5% 0.9% 0.0% Nonmetallic mineral products 0.5% 0.9% 0.0% Wood products 0.5% 0.9% 0.0% Office supplies and stationery stores 0.4% 0.0% 0.8% Paper 0.4% 0.8% 0.0% Mining, quarrying, and oil and gas extraction 0.3% 0.6% 0.0% Computer and electronic products 0.3% 0.6% 0.0% Water transportation 0.2% 0.5% 0.0% Sporting goods, camera, and hobby and toy stores 0.2% 0.5% 0.0% Air transportation 0.2% 0.3% 0.0% Book stores and news dealers 0.2% 0.3% 0.0% Machinery, equipment, and supplies merchant wholesalers 0.2% 0.3% 0.0%
Unemployment in Williams Unemployment by race in 2022
Unemployment rate for White non-Hispanic residents 5.9% Males3.2% FemalesUnemployment rate for other race residents 10.0% FemalesUnemployment rate for Hispanic or Latino residents 4.7% FemalesUnemployment by race in 2000
Unemployment rate for White non-Hispanic residents 6.9% FemalesUnemployment rate for other race residents 14.2% MalesUnemployment rate for Hispanic or Latino residents 19.4% Males4.2% Females
Time leaving home to go to work 12:00 a.m. to 4:59 a.m.: Williams:
6.3% (79)Arizona:
8.7% (238,659)
5:00 a.m. to 5:29 a.m.: Williams:
5.5% (70)Arizona:
6.0% (164,616)
5:30 a.m. to 5:59 a.m.: Williams:
6.3% (80)Arizona:
5.4% (149,311)
6:00 a.m. to 6:29 a.m.: Williams:
20.5% (260)Arizona:
9.3% (256,070)
6:30 a.m. to 6:59 a.m.: Williams:
8.2% (103)Arizona:
9.1% (249,459)
7:00 a.m. to 7:29 a.m.: Williams:
9.0% (114)Arizona:
13.4% (369,779)
7:30 a.m. to 7:59 a.m.: Williams:
4.4% (56)Arizona:
10.4% (285,166)
8:00 a.m. to 8:29 a.m.: Williams:
3.2% (40)Arizona:
10.0% (273,857)
8:30 a.m. to 8:59 a.m.: Williams:
3.8% (48)Arizona:
4.2% (116,729)
9:00 a.m. to 9:59 a.m.: Williams:
17.8% (225)Arizona:
5.9% (161,259)
10:00 a.m. to 10:59 a.m.: Williams:
4.3% (54)Arizona:
2.6% (71,656)
12:00 p.m. to 3:59 p.m.: Williams:
4.7% (60)Arizona:
6.9% (190,458)
4:00 p.m. to 11:59 p.m.: Williams:
2.5% (32)Arizona:
6.6% (182,731)
<5am: Williams:
1.7% (23)Arizona:
5.0% (110,126)
5:30am: Williams:
3.9% (51)Arizona:
4.7% (102,952)
6am: Williams:
3.9% (52)Arizona:
5.8% (127,515)
6:30am: Williams:
9.1% (120)Arizona:
9.4% (207,722)
7am: Williams:
9.9% (131)Arizona:
10.2% (224,484)
7:30am: Williams:
13.0% (172)Arizona:
13.8% (306,057)
8am: Williams:
15.1% (200)Arizona:
13.3% (293,152)
8:30am: Williams:
11.0% (146)Arizona:
8.8% (194,812)
9am: Williams:
3.3% (43)Arizona:
4.0% (88,904)
10am: Williams:
4.5% (59)Arizona:
5.0% (109,614)
11am: Williams:
1.1% (14)Arizona:
2.3% (50,098)
12pm: Williams:
2.5% (33)Arizona:
1.1% (24,825)
4pm: Williams:
8.6% (114)Arizona:
6.7% (148,259)
>4pm: Williams:
6.4% (85)Arizona:
6.4% (140,717)
12:00 a.m. to 4:59 a.m. - Males: Williams:
5.0% (40)Arizona:
11.5% (176,357)
5:00 a.m. to 5:29 a.m. - Males: Williams:
7.6% (61)Arizona:
7.9% (120,345)
5:30 a.m. to 5:59 a.m. - Males: Williams:
9.1% (73)Arizona:
6.6% (100,978)
6:00 a.m. to 6:29 a.m. - Males: Williams:
13.6% (109)Arizona:
10.3% (157,240)
6:30 a.m. to 6:59 a.m. - Males: Williams:
14.9% (120)Arizona:
8.3% (127,572)
7:00 a.m. to 7:29 a.m. - Males: Williams:
3.4% (28)Arizona:
12.1% (185,665)
7:30 a.m. to 7:59 a.m. - Males: Williams:
2.1% (17)Arizona:
8.8% (135,322)
8:00 a.m. to 8:29 a.m. - Males: Williams:
1.8% (15)Arizona:
8.7% (133,365)
9:00 a.m. to 9:59 a.m. - Males: Williams:
22.1% (177)Arizona:
5.4% (82,467)
10:00 a.m. to 10:59 a.m. - Males: Williams:
6.1% (49)Arizona:
2.2% (34,272)
12:00 p.m. to 3:59 p.m. - Males: Williams:
6.6% (53)Arizona:
6.5% (99,326)
12:00 a.m. to 4:59 a.m. - Females: Williams:
7.5% (34)Arizona:
5.1% (62,302)
5:30 a.m. to 5:59 a.m. - Females: Williams:
1.3% (6)Arizona:
4.0% (48,333)
6:00 a.m. to 6:29 a.m. - Females: Williams:
32.7% (148)Arizona:
8.1% (98,830)
7:00 a.m. to 7:29 a.m. - Females: Williams:
19.3% (88)Arizona:
15.1% (184,114)
7:30 a.m. to 7:59 a.m. - Females: Williams:
8.8% (40)Arizona:
12.3% (149,844)
8:00 a.m. to 8:29 a.m. - Females: Williams:
4.8% (22)Arizona:
11.5% (140,492)
8:30 a.m. to 8:59 a.m. - Females: Williams:
12.1% (55)Arizona:
5.0% (61,093)
9:00 a.m. to 9:59 a.m. - Females: Williams:
10.6% (48)Arizona:
6.5% (78,792)
10:00 a.m. to 10:59 a.m. - Females: Williams:
2.0% (9)Arizona:
3.1% (37,384)
4:00 p.m. to 11:59 p.m. - Females: Williams:
6.4% (29)Arizona:
6.9% (83,872)
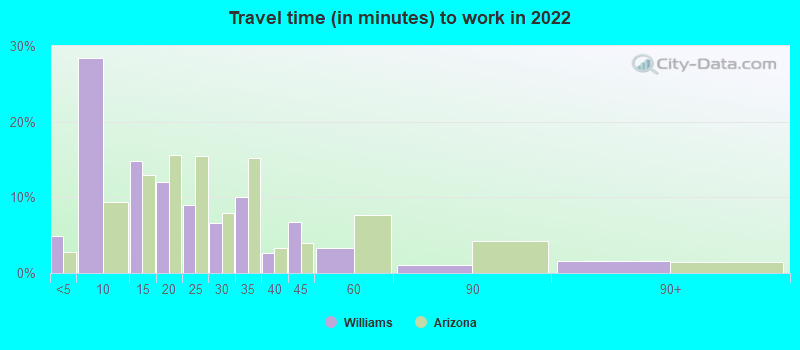
Travel time to work Percentage of workers working in this county: 94.8%Number of people working at home: 65 (4.9% of all workers )
Less than 5 minutes: Williams:
4.9% (112)Arizona:
2.8% (76,832)
5 to 9 minutes: Williams:
28.4% (644)Arizona:
9.3% (254,268)
10 to 14 minutes: Williams:
14.8% (335)Arizona:
13.0% (354,212)
15 to 19 minutes: Williams:
12.1% (274)Arizona:
15.5% (423,571)
20 to 24 minutes: Williams:
9.0% (204)Arizona:
15.5% (422,070)
25 to 29 minutes: Williams:
6.6% (149)Arizona:
7.9% (214,914)
30 to 34 minutes: Williams:
10.0% (227)Arizona:
15.3% (415,851)
35 to 39 minutes: Williams:
2.6% (58)Arizona:
3.3% (89,572)
40 to 44 minutes: Williams:
6.7% (152)Arizona:
4.0% (108,405)
45 to 59 minutes: Williams:
3.3% (76)Arizona:
7.7% (210,356)
60 to 89 minutes: Williams:
1.1% (24)Arizona:
4.2% (113,557)
90 or more minutes: Williams:
1.6% (36)Arizona:
1.5% (41,169)
Less than 5 minutes: Williams:
11.9% (157)Arizona:
2.9% (64,004)
5 to 9 minutes: Williams:
29.8% (394)Arizona:
10.2% (225,933)
10 to 14 minutes: Williams:
16.2% (214)Arizona:
14.0% (308,552)
15 to 19 minutes: Williams:
8.1% (107)Arizona:
15.1% (334,014)
20 to 24 minutes: Williams:
5.9% (78)Arizona:
14.5% (320,419)
25 to 29 minutes: Williams:
0.5% (6)Arizona:
6.0% (132,976)
30 to 34 minutes: Williams:
5.4% (71)Arizona:
14.3% (315,678)
35 to 39 minutes: Williams:
3.5% (46)Arizona:
2.8% (61,595)
40 to 44 minutes: Williams:
3.3% (43)Arizona:
3.6% (78,627)
45 to 59 minutes: Williams:
7.0% (93)Arizona:
7.2% (158,690)
60 to 89 minutes: Williams:
1.1% (15)Arizona:
3.9% (85,177)
90 or more minutes: Williams:
1.4% (19)Arizona:
2.0% (43,572)
Less than 5 minutes - Males: Williams:
9.2% (105)Arizona:
2.9% (44,216)
5 to 9 minutes - Males: Williams:
33.2% (377)Arizona:
8.2% (124,251)
10 to 14 minutes - Males: Williams:
8.8% (100)Arizona:
12.0% (180,886)
15 to 19 minutes - Males: Williams:
6.7% (76)Arizona:
14.6% (220,493)
20 to 24 minutes - Males: Williams:
7.1% (81)Arizona:
15.8% (237,809)
25 to 29 minutes - Males: Williams:
15.1% (172)Arizona:
7.9% (119,389)
30 to 34 minutes - Males: Williams:
11.7% (133)Arizona:
16.3% (246,495)
35 to 39 minutes - Males: Williams:
3.8% (43)Arizona:
3.5% (52,175)
40 to 44 minutes - Males: Williams:
5.2% (59)Arizona:
4.3% (64,494)
45 to 59 minutes - Males: Williams:
4.5% (51)Arizona:
8.2% (123,837)
60 to 89 minutes - Males: Williams:
0.3% (4)Arizona:
4.5% (68,643)
90 or more minutes - Males: Williams:
1.4% (16)Arizona:
1.8% (26,594)
Less than 5 minutes - Females: Williams:
1.9% (21)Arizona:
2.7% (32,616)
5 to 9 minutes - Females: Williams:
24.4% (276)Arizona:
10.7% (130,017)
10 to 14 minutes - Females: Williams:
22.5% (254)Arizona:
14.3% (173,326)
15 to 19 minutes - Females: Williams:
17.5% (198)Arizona:
16.7% (203,078)
20 to 24 minutes - Females: Williams:
11.1% (125)Arizona:
15.2% (184,261)
25 to 29 minutes - Females: Williams:
0.6% (7)Arizona:
7.9% (95,525)
30 to 34 minutes - Females: Williams:
8.3% (94)Arizona:
13.9% (169,356)
35 to 39 minutes - Females: Williams:
3.9% (44)Arizona:
3.1% (37,397)
40 to 44 minutes - Females: Williams:
6.9% (78)Arizona:
3.6% (43,911)
45 to 59 minutes - Females: Williams:
1.5% (17)Arizona:
7.1% (86,519)
60 to 89 minutes - Females: Williams:
2.3% (26)Arizona:
3.7% (44,914)
90 or more minutes - Females: Williams:
1.8% (21)Arizona:
1.2% (14,575)
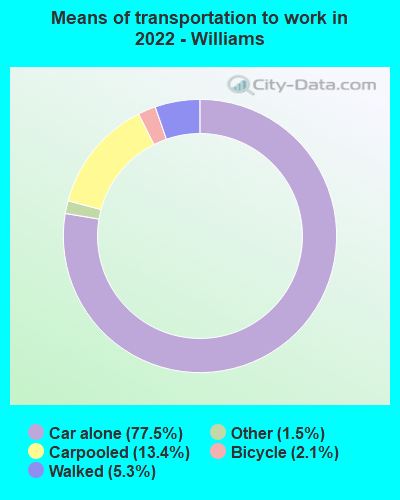
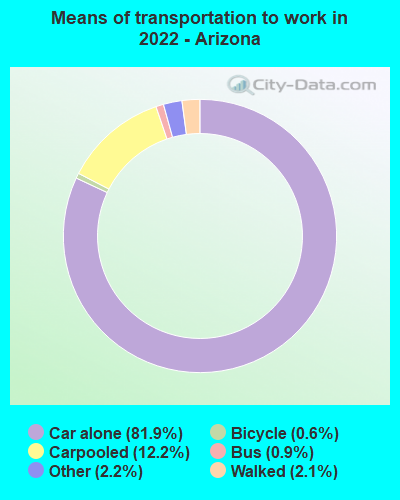
Means of transportation to work Drove car alone: Williams:
77.5% (1,760)Arizona:
81.9% (984,683)
Carpooled: Williams:
13.4% (305)Arizona:
12.2% (161,249)
Bus: Williams:
0.1% (2)Arizona:
0.9% (11,018)
Bicycle: Williams:
2.1% (48)Arizona:
0.6% (5,207)
Walked: Williams:
5.3% (120)Arizona:
2.1% (26,321)
Other means: Williams:
1.5% (35)Arizona:
2.2% (25,693)
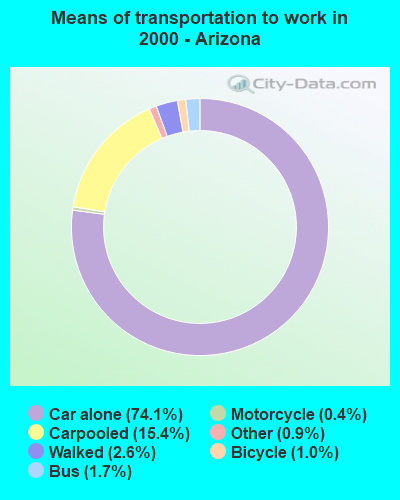
Drove car alone: Williams:
55.9% (740)Arizona:
74.1% (1,638,752)
Carpooled: Williams:
18.5% (245)Arizona:
15.4% (340,447)
Streetcar or trolley car: Williams:
0.8% (10)Arizona:
0.0% (654)
Taxicab: Williams:
0.5% (6)Arizona:
0.1% (2,001)
Bicycle: Williams:
1.8% (24)Arizona:
1.0% (22,209)
Walked: Williams:
15.0% (199)Arizona:
2.6% (58,015)
Other means: Williams:
1.4% (19)Arizona:
0.9% (20,140)
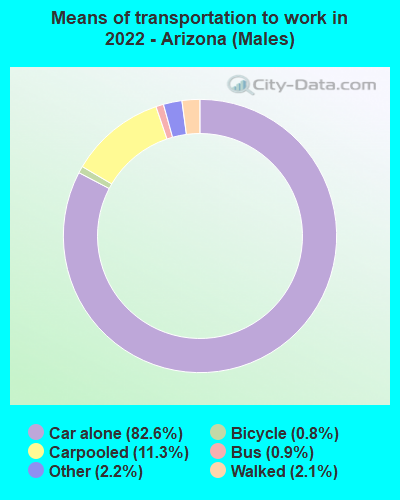
Drove car alone - Males: Williams:
68.9% (779)Arizona:
82.6% (984,683)
Carpooled - Males: Williams:
18.7% (211)Arizona:
11.3% (161,249)
Bicycle - Males: Williams:
4.1% (47)Arizona:
0.8% (5,207)
Walked - Males: Williams:
7.5% (84)Arizona:
2.1% (26,321)
Other means - Males: Williams:
0.9% (10)Arizona:
2.2% (25,693)
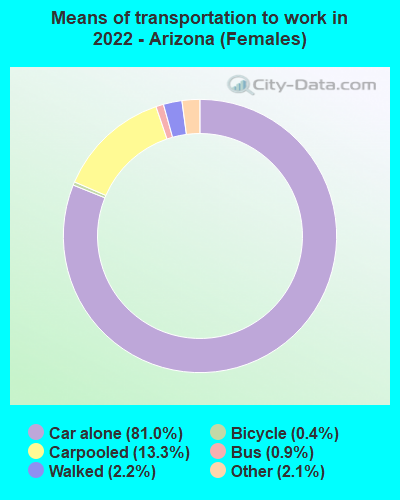
Drove car alone - Females: Williams:
86.8% (989)Arizona:
81.0% (984,683)
Carpooled - Females: Williams:
7.8% (89)Arizona:
13.3% (161,249)
Bus - Females: Williams:
0.2% (2)Arizona:
0.9% (11,018)
Walked - Females: Williams:
2.9% (33)Arizona:
2.2% (26,321)
Other means - Females: Williams:
2.3% (26)Arizona:
2.1% (25,693)
Private vehicle occupancy Drove alone: Williams:
87.5% (991)Arizona:
87.1% (2,249,618)
In 2 person carpool: Williams:
6.1% (69)Arizona:
9.6% (248,016)
In 4 person carpool: Williams:
6.4% (72)Arizona:
0.7% (18,165)
Drove alone: Williams:
75.1% (740)Arizona:
82.8% (1,638,752)
In 2 person carpool: Williams:
15.5% (153)Arizona:
13.3% (263,536)
In 3 person carpool: Williams:
6.6% (65)Arizona:
2.4% (47,418)
In 4 person carpool: Williams:
2.7% (27)Arizona:
0.8% (16,752)
Class of workers
Employee of private company: Williams:
73.8% (1,010)Arizona:
69.3% (2,383,933)
Self-employed in own incorporated business: Williams:
5.9% (81)Arizona:
4.1% (141,657)
Private not-for-profit wage and salary workers: Williams:
1.4% (20)Arizona:
7.0% (239,758)
Local government workers: Williams:
6.6% (91)Arizona:
6.6% (228,494)
State government workers: Williams:
3.6% (49)Arizona:
4.3% (149,309)
Federal government workers: Williams:
2.9% (39)Arizona:
2.7% (91,276)
Self-employed workers in own not incorporated business: Williams:
5.7% (78)Arizona:
5.8% (199,501)
Employee of private company: Williams:
62.3% (828)Arizona:
69.3% (1,546,865)
Self-employed in own incorporated business: Williams:
2.8% (37)Arizona:
3.5% (77,314)
Private not-for-profit wage and salary workers: Williams:
6.3% (84)Arizona:
5.4% (119,598)
Local government workers: Williams:
11.8% (157)Arizona:
6.9% (155,187)
State government workers: Williams:
5.9% (79)Arizona:
5.3% (119,292)
Federal government workers: Williams:
5.0% (66)Arizona:
2.9% (65,075)
Self-employed workers in own not incorporated business: Williams:
5.8% (77)Arizona:
6.4% (143,564)
Employee of private company - Males: Williams:
74.4% (628)Arizona:
72.5% (1,346,166)
Self-employed in own incorporated business - Males: Williams:
6.0% (51)Arizona:
5.0% (92,967)
Local government workers - Males: Williams:
5.4% (45)Arizona:
5.3% (98,091)
State government workers - Males: Williams:
5.9% (49)Arizona:
3.4% (63,497)
Federal government workers - Males: Williams:
4.6% (39)Arizona:
2.9% (53,017)
Self-employed workers in own not incorporated business - Males: Williams:
3.8% (32)Arizona:
6.0% (111,844)
Employee of private company - Females: Williams:
72.9% (382)Arizona:
65.4% (1,037,767)
Self-employed in own incorporated business - Females: Williams:
5.9% (31)Arizona:
3.1% (48,690)
Private not-for-profit wage and salary workers - Females: Williams:
3.7% (20)Arizona:
9.6% (152,849)
Local government workers - Females: Williams:
8.6% (45)Arizona:
8.2% (130,403)
Self-employed workers in own not incorporated business - Females: Williams:
8.8% (46)Arizona:
5.5% (87,657)