Work and Jobs in Windemere, Texas (TX) Detailed Stats
Occupations, Industries, Unemployment, Workers, Commute

Recent posts about work in Windemere, Texas on our local forum with over 2,400,000 registered users:
 | windermere lakes in 290 & 1960 (12 replies) |
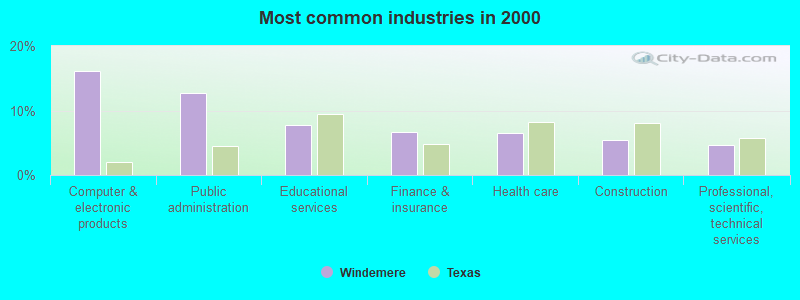
The most common industries in Windemere are: Computer & electronic products (16.2% of civilian employees), Public administration (12.8% of civilian employees), Educational services (7.7% of civilian employees). 59.8% of workers work in Travis County and 10.3% of all workers work at home. 88.5% of workers are employees of private companies, which is 21.4% greater than the rate of 69.6% across the entire state of Texas.
Whole page based on the data from 2000 / 2022 when the population of Windemere, Texas was 6,868 / 910
Whole page based on the data from 2000 / 2022 when the population of Windemere, Texas was 6,868 / 910
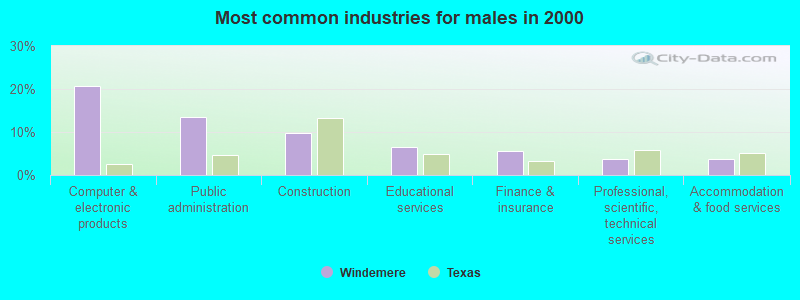
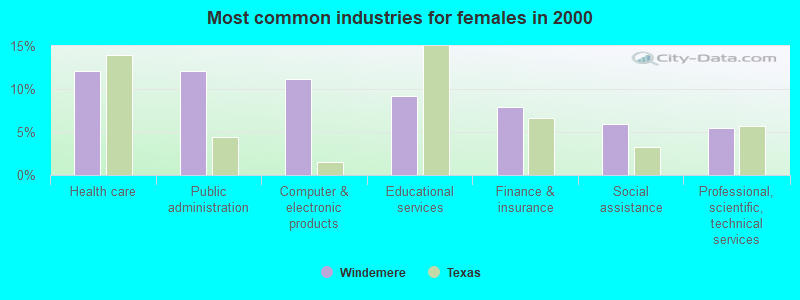
Most common industries
Most common industries | |||
|---|---|---|---|
Industry | All | Males | Females |
| Computer and electronic products | 16.2% (656) | 20.7% (439) | 11.2% (217) |
| Public administration | 12.8% (518) | 13.4% (284) | 12.1% (234) |
| Educational services | 7.7% (313) | 6.4% (136) | 9.1% (177) |
| Finance and insurance | 6.6% (268) | 5.5% (116) | 7.9% (152) |
| Health care | 6.6% (267) | 1.5% (32) | 12.1% (235) |
| Construction | 5.4% (221) | 9.7% (206) | 0.8% (15) |
| Professional, scientific, and technical services | 4.6% (186) | 3.8% (81) | 5.4% (105) |
| Accommodation and food services | 3.3% (134) | 3.7% (79) | 2.8% (55) |
| Administrative and support and waste management services | 3.1% (126) | 2.9% (61) | 3.4% (65) |
| Social assistance | 2.8% (114) | 0.0% (0) | 5.9% (114) |
| Miscellaneous manufacturing | 2.2% (88) | 3.1% (66) | 1.1% (22) |
| Food and beverage stores | 2.1% (86) | 1.7% (35) | 2.6% (51) |
| Motor vehicle and parts dealers | 1.9% (77) | 2.3% (48) | 1.5% (29) |
| Religious, grantmaking, civic, professional, and similar organizations | 1.9% (76) | 1.0% (21) | 2.8% (55) |
| Broadcasting and telecommunications | 1.7% (68) | 2.0% (43) | 1.3% (25) |
| U. S. Postal service | 1.7% (68) | 2.6% (55) | 0.7% (13) |
| Data processing, libraries, and other information services | 1.3% (52) | 1.2% (25) | 1.4% (27) |
| Printing and related support activities | 1.2% (50) | 1.6% (34) | 0.8% (16) |
| Department and other general merchandise stores | 1.2% (50) | 0.9% (19) | 1.6% (31) |
| Real estate and rental and leasing | 1.1% (46) | 0.4% (9) | 1.9% (37) |
| Electrical and electronic goods merchant wholesalers | 1.1% (44) | 1.6% (34) | 0.5% (10) |
| Radio, TV, and computer stores | 1.0% (39) | 0.8% (18) | 1.1% (21) |
| Repair and maintenance | 0.9% (38) | 0.8% (18) | 1.0% (20) |
| Utilities | 0.9% (35) | 0.8% (18) | 0.9% (17) |
| Personal and laundry services | 0.7% (29) | 0.4% (9) | 1.0% (20) |
| Groceries and related products merchant wholesalers | 0.7% (28) | 1.3% (28) | 0.0% (0) |
| Chemicals | 0.6% (25) | 1.2% (25) | 0.0% (0) |
| Arts, entertainment, and recreation | 0.6% (24) | 0.8% (18) | 0.3% (6) |
| Truck transportation | 0.6% (24) | 0.7% (14) | 0.5% (10) |
| Professional and commercial equipment and supplies merchant wholesalers | 0.5% (21) | 0.0% (0) | 1.1% (21) |
| Clothing and accessories, including shoe, stores | 0.5% (20) | 0.0% (0) | 1.0% (20) |
| Other direct selling establishments | 0.5% (20) | 0.3% (7) | 0.7% (13) |
| Other transportation, and support activities, and couriers | 0.5% (20) | 0.4% (8) | 0.6% (12) |
| Pharmacies and drug stores | 0.4% (18) | 0.4% (8) | 0.5% (10) |
| Building material and garden equipment and supplies dealers | 0.4% (18) | 0.8% (18) | 0.0% (0) |
| Mining, quarrying, and oil and gas extraction | 0.4% (17) | 0.3% (7) | 0.5% (10) |
| Electronic shopping and mail-order houses | 0.4% (16) | 0.4% (8) | 0.4% (8) |
| Air transportation | 0.4% (16) | 0.5% (11) | 0.3% (5) |
| Publishing, and motion picture and sound recording industries | 0.4% (15) | 0.3% (7) | 0.4% (8) |
| Office supplies and stationery stores | 0.3% (11) | 0.0% (0) | 0.6% (11) |
| Paper | 0.3% (11) | 0.0% (0) | 0.6% (11) |
| Hardware, plumbing and heating equipment, and supplies merchant wholesalers | 0.3% (11) | 0.5% (11) | 0.0% (0) |
| Recyclable material merchant wholesalers | 0.2% (9) | 0.4% (9) | 0.0% (0) |
| Metal and metal products | 0.2% (9) | 0.4% (9) | 0.0% (0) |
| Food | 0.2% (8) | 0.4% (8) | 0.0% (0) |
| Warehousing and storage | 0.2% (8) | 0.4% (8) | 0.0% (0) |
| Machinery, equipment, and supplies merchant wholesalers | 0.2% (8) | 0.4% (8) | 0.0% (0) |
| Private households | 0.2% (8) | 0.0% (0) | 0.4% (8) |
| Health and personal care, except drug, stores | 0.2% (7) | 0.0% (0) | 0.4% (7) |
| Used merchandise, gift, novelty, and souvenir, and other miscellaneous stores | 0.2% (7) | 0.0% (0) | 0.4% (7) |
| Beverage and tobacco products | 0.1% (6) | 0.3% (6) | 0.0% (0) |
| Furniture and home furnishings, and household appliance stores | 0.1% (6) | 0.3% (6) | 0.0% (0) |
| Farm supplies merchant wholesalers | 0.1% (6) | 0.3% (6) | 0.0% (0) |
| Paper and paper products merchant wholesalers | 0.1% (6) | 0.0% (0) | 0.3% (6) |
| Jewelry, luggage, and leather goods stores | 0.1% (5) | 0.2% (5) | 0.0% (0) |
Unemployment in Windemere
- Unemployment by race in 2022
- Unemployment rate for White non-Hispanic residents
- 24.9%Males
- Unemployment rate for Hispanic or Latino residents
- 27.0%Females
- Unemployment by race in 2000
- Unemployment rate for White non-Hispanic residents
- 2.2%Males
- 1.1%Females
- Unemployment rate for Black residents
- 3.6%Males
- Unemployment rate for two or more race residents
- 8.1%Females
- Unemployment rate for Hispanic or Latino residents
- 1.8%Females
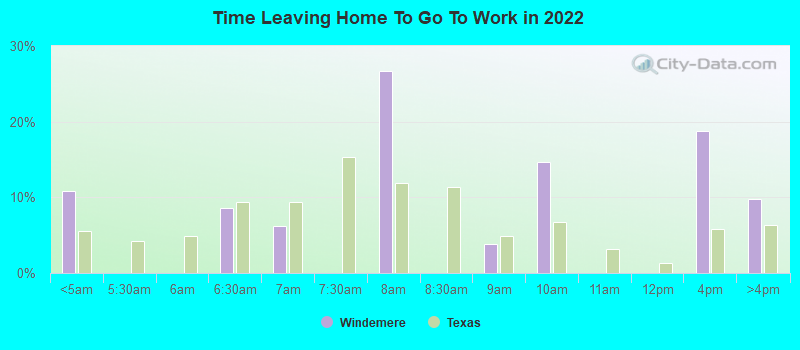
Time leaving home to go to work
12:00 a.m. to 4:59 a.m.:
| Windemere: | 10.9% (46) |
| Texas: | 5.5% (678,264) |
6:00 a.m. to 6:29 a.m.:
| Windemere: | 8.6% (36) |
| Texas: | 9.4% (1,155,020) |
6:30 a.m. to 6:59 a.m.:
| Windemere: | 6.3% (26) |
| Texas: | 9.3% (1,152,822) |
7:30 a.m. to 7:59 a.m.:
| Windemere: | 26.7% (112) |
| Texas: | 11.9% (1,469,628) |
8:30 a.m. to 8:59 a.m.:
| Windemere: | 3.8% (16) |
| Texas: | 4.9% (599,574) |
9:00 a.m. to 9:59 a.m.:
| Windemere: | 14.7% (62) |
| Texas: | 6.7% (829,367) |
12:00 p.m. to 3:59 p.m.:
| Windemere: | 18.7% (79) |
| Texas: | 5.8% (720,594) |
4:00 p.m. to 11:59 p.m.:
| Windemere: | 9.8% (41) |
| Texas: | 6.3% (777,072) |

<5am:
| Windemere: | 2.5% (101) |
| Texas: | 3.1% (281,361) |
5:30am:
| Windemere: | 2.6% (103) |
| Texas: | 2.9% (262,060) |
6am:
| Windemere: | 5.0% (199) |
| Texas: | 4.4% (403,423) |
6:30am:
| Windemere: | 9.6% (380) |
| Texas: | 8.8% (808,876) |
7am:
| Windemere: | 10.0% (397) |
| Texas: | 10.7% (976,557) |
7:30am:
| Windemere: | 21.3% (844) |
| Texas: | 16.4% (1,500,904) |
8am:
| Windemere: | 17.4% (689) |
| Texas: | 16.8% (1,536,308) |
8:30am:
| Windemere: | 7.8% (311) |
| Texas: | 10.0% (913,601) |
9am:
| Windemere: | 3.4% (134) |
| Texas: | 4.4% (398,656) |
10am:
| Windemere: | 2.8% (111) |
| Texas: | 5.2% (472,592) |
11am:
| Windemere: | 1.9% (74) |
| Texas: | 2.2% (197,844) |
12pm:
| Windemere: | 0.3% (12) |
| Texas: | 0.9% (86,997) |
4pm:
| Windemere: | 4.4% (173) |
| Texas: | 5.5% (503,565) |
>4pm:
| Windemere: | 9.6% (380) |
| Texas: | 6.1% (563,107) |

12:00 a.m. to 4:59 a.m. - Males:
| Windemere: | 28.7% (43) |
| Texas: | 7.0% (477,284) |
6:30 a.m. to 6:59 a.m. - Males:
| Windemere: | 16.3% (24) |
| Texas: | 9.5% (652,306) |
7:30 a.m. to 7:59 a.m. - Males:
| Windemere: | 44.9% (67) |
| Texas: | 10.2% (696,429) |
9:00 a.m. to 9:59 a.m. - Males:
| Windemere: | 9.5% (14) |
| Texas: | 5.8% (401,071) |

6:00 a.m. to 6:29 a.m. - Females:
| Windemere: | 14.5% (39) |
| Texas: | 7.4% (403,902) |
7:30 a.m. to 7:59 a.m. - Females:
| Windemere: | 16.8% (45) |
| Texas: | 14.1% (773,199) |
8:30 a.m. to 8:59 a.m. - Females:
| Windemere: | 5.6% (15) |
| Texas: | 5.8% (317,812) |
9:00 a.m. to 9:59 a.m. - Females:
| Windemere: | 16.3% (44) |
| Texas: | 7.8% (428,296) |
12:00 p.m. to 3:59 p.m. - Females:
| Windemere: | 26.0% (70) |
| Texas: | 5.9% (322,799) |
4:00 p.m. to 11:59 p.m. - Females:
| Windemere: | 13.7% (37) |
| Texas: | 6.2% (341,122) |
Travel time to work
Percentage of workers working in this county: 59.8%
Number of people working at home: 52 (10.3% of all workers)
Daytime population change due to commuting: -3,055 (-44.5%)
Workers who live and work in this place: 146 (3.7%)
Number of people working at home: 52 (10.3% of all workers)
Daytime population change due to commuting: -3,055 (-44.5%)
Workers who live and work in this place: 146 (3.7%)


Less than 5 minutes:
| Windemere: | 1.1% (42) |
| Texas: | 3.0% (277,642) |
5 to 9 minutes:
| Windemere: | 7.0% (276) |
| Texas: | 10.3% (942,891) |
10 to 14 minutes:
| Windemere: | 12.8% (507) |
| Texas: | 14.4% (1,317,555) |
15 to 19 minutes:
| Windemere: | 10.2% (405) |
| Texas: | 16.0% (1,467,945) |
20 to 24 minutes:
| Windemere: | 16.6% (657) |
| Texas: | 13.9% (1,276,781) |
25 to 29 minutes:
| Windemere: | 6.4% (253) |
| Texas: | 5.3% (482,838) |
30 to 34 minutes:
| Windemere: | 21.7% (861) |
| Texas: | 14.3% (1,309,699) |
35 to 39 minutes:
| Windemere: | 2.3% (92) |
| Texas: | 2.4% (219,873) |
40 to 44 minutes:
| Windemere: | 5.2% (208) |
| Texas: | 3.1% (280,916) |
45 to 59 minutes:
| Windemere: | 11.1% (439) |
| Texas: | 7.6% (692,006) |
60 to 89 minutes:
| Windemere: | 3.0% (120) |
| Texas: | 4.6% (418,905) |
90 or more minutes:
| Windemere: | 1.2% (48) |
| Texas: | 2.4% (218,800) |
Means of transportation to work


Drove car alone:
| Windemere: | 79.8% (3,163) |
| Texas: | 77.7% (7,115,590) |
Carpooled:
| Windemere: | 15.8% (626) |
| Texas: | 14.5% (1,326,012) |
Bus or trolley bus:
| Windemere: | 1.3% (50) |
| Texas: | 1.7% (157,014) |
Motorcycle:
| Windemere: | 0.4% (17) |
| Texas: | 0.1% (12,068) |
Bicycle:
| Windemere: | 0.2% (6) |
| Texas: | 0.2% (21,551) |
Walked:
| Windemere: | 0.5% (19) |
| Texas: | 1.9% (173,670) |
Other means:
| Windemere: | 0.7% (27) |
| Texas: | 0.9% (86,692) |
Private vehicle occupancy

Drove alone:
| Windemere: | 94.8% (403) |
| Texas: | 87.6% (10,283,021) |
In 2 person carpool:
| Windemere: | 5.2% (22) |
| Texas: | 9.0% (1,052,595) |

Drove alone:
| Windemere: | 83.5% (3,163) |
| Texas: | 84.3% (7,115,590) |
In 2 person carpool:
| Windemere: | 13.5% (512) |
| Texas: | 11.6% (982,994) |
In 3 person carpool:
| Windemere: | 2.1% (78) |
| Texas: | 2.4% (201,602) |
In 4 person carpool:
| Windemere: | 1.0% (36) |
| Texas: | 1.0% (83,518) |
Class of workers
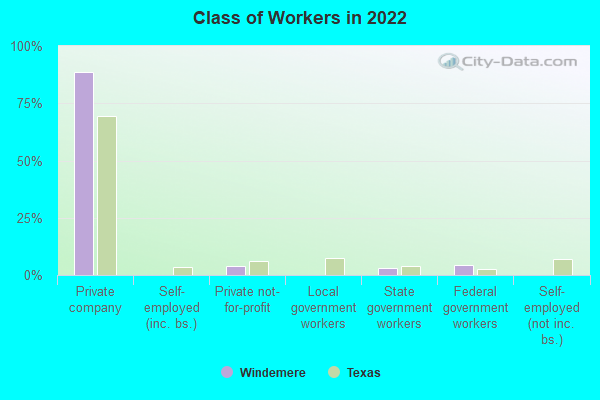
Employee of private company:
| Windemere: | 88.5% (446) |
| Texas: | 69.6% (10,139,666) |
Private not-for-profit wage and salary workers:
| Windemere: | 3.9% (20) |
| Texas: | 6.0% (870,454) |
State government workers:
| Windemere: | 3.2% (16) |
| Texas: | 3.8% (558,618) |
Federal government workers:
| Windemere: | 4.4% (22) |
| Texas: | 2.5% (357,298) |

Employee of private company:
| Windemere: | 68.3% (2,772) |
| Texas: | 69.6% (6,425,274) |
Self-employed in own incorporated business:
| Windemere: | 0.4% (16) |
| Texas: | 2.7% (250,864) |
Private not-for-profit wage and salary workers:
| Windemere: | 5.2% (212) |
| Texas: | 5.7% (526,631) |
Local government workers:
| Windemere: | 7.1% (290) |
| Texas: | 6.6% (608,479) |
State government workers:
| Windemere: | 12.2% (494) |
| Texas: | 5.4% (501,082) |
Federal government workers:
| Windemere: | 3.7% (150) |
| Texas: | 2.6% (237,177) |
Self-employed workers in own not incorporated business:
| Windemere: | 3.0% (123) |
| Texas: | 7.1% (653,527) |

Employee of private company - Males:
| Windemere: | 100.0% (159) |
| Texas: | 73.1% (5,788,450) |

Employee of private company - Females:
| Windemere: | 83.2% (286) |
| Texas: | 65.4% (4,351,216) |
Private not-for-profit wage and salary workers - Females:
| Windemere: | 5.7% (20) |
| Texas: | 8.2% (546,978) |
State government workers - Females:
| Windemere: | 4.7% (16) |
| Texas: | 4.8% (321,912) |
Federal government workers - Females:
| Windemere: | 6.5% (22) |
| Texas: | 2.2% (145,669) |