Work and Jobs in Winter Park, Colorado (CO) Detailed Stats
Data:
Unemployment (%)
Unemployment (% change since 2000)
Unemployment (%) - White
Unemployment (% change since 2000) - White
Unemployment (%) - Black or African American
Unemployment (% change since 2000) - Black or African American
Unemployment (%) - Asian
Unemployment (% change since 2000) - Asian
Unemployment (%) - Hispanic or Latino
Unemployment (% change since 2000) - Hispanic or Latino
Unemployment (%) - American Indian and Alaska Native
Unemployment (% change since 2000) - American Indian and Alaska Native
Unemployment (%) - Multirace
Unemployment (% change since 2000) - Multirace
Unemployment (%) - Other Race
Unemployment (% change since 2000) - Other Race
Industry diversity
Most Common Industries - Agriculture, forestry, fishing and hunting, and mining (%)
Most Common Industries - Agriculture, forestry, fishing and hunting (%)
Most Common Industries - Mining, quarrying, and oil and gas extraction (%)
Most Common Industries - Construction (%)
Most Common Industries - Manufacturing (%)
Most Common Industries - Wholesale trade (%)
Most Common Industries - Retail trade (%)
Most Common Industries - Transportation and warehousing, and utilities (%)
Most Common Industries - Transportation and warehousing (%)
Most Common Industries - Utilities (%)
Most Common Industries - Information (%)
Most Common Industries - Finance and insurance, and real estate and rental and leasing (%)
Most Common Industries - Finance and insurance (%)
Most Common Industries - Real estate and rental and leasing (%)
Most Common Industries - Professional, scientific, and management, and administrative and waste management services (%)
Most Common Industries - Professional, scientific, and technical services (%)
Most Common Industries - Management of companies and enterprises (%)
Most Common Industries - Administrative and support and waste management services (%)
Most Common Industries - Educational services, and health care and social assistance (%)
Most Common Industries - Educational services (%)
Most Common Industries - Health care and social assistance (%)
Most Common Industries - Arts, entertainment, and recreation, and accommodation and food services (%)
Most Common Industries - Arts, entertainment, and recreation (%)
Most Common Industries - Accommodation and food services (%)
Most Common Industries - Other services, except public administration (%)
Most Common Industries - Public administration (%)
Occupation diversity
Most Common Occupations - Management, business, science, and arts occupations (%)
Most Common Occupations - Management, business, and financial occupations (%)
Most Common Occupations - Management occupations (%)
Most Common Occupations - Business and financial operations occupations (%)
Most Common Occupations - Computer, engineering, and science occupations (%)
Most Common Occupations - Computer and mathematical occupations (%)
Most Common Occupations - Architecture and engineering occupations (%)
Most Common Occupations - Life, physical, and social science occupations (%)
Most Common Occupations - Education, legal, community service, arts, and media occupations (%)
Most Common Occupations - Community and social service occupations (%)
Most Common Occupations - Legal occupations (%)
Most Common Occupations - Education, training, and library occupations (%)
Most Common Occupations - Arts, design, entertainment, sports, and media occupations (%)
Most Common Occupations - Healthcare practitioners and technical occupations (%)
Most Common Occupations - Health diagnosing and treating practitioners and other technical occupations (%)
Most Common Occupations - Health technologists and technicians (%)
Most Common Occupations - Service occupations (%)
Most Common Occupations - Healthcare support occupations (%)
Most Common Occupations - Protective service occupations (%)
Most Common Occupations - Fire fighting and prevention, and other protective service workers including supervisors (%)
Most Common Occupations - Law enforcement workers including supervisors (%)
Most Common Occupations - Food preparation and serving related occupations (%)
Most Common Occupations - Building and grounds cleaning and maintenance occupations (%)
Most Common Occupations - Personal care and service occupations (%)
Most Common Occupations - Sales and office occupations (%)
Most Common Occupations - Sales and related occupations (%)
Most Common Occupations - Office and administrative support occupations (%)
Most Common Occupations - Natural resources, construction, and maintenance occupations (%)
Most Common Occupations - Farming, fishing, and forestry occupations (%)
Most Common Occupations - Construction and extraction occupations (%)
Most Common Occupations - Installation, maintenance, and repair occupations (%)
Most Common Occupations - Production, transportation, and material moving occupations (%)
Most Common Occupations - Production occupations (%)
Most Common Occupations - Transportation occupations (%)
Most Common Occupations - Material moving occupations (%)
Private vehicle occupancy - Drove alone (% change since 2000)
Private vehicle occupancy - Carpooled (%)
Private vehicle occupancy - Carpooled (% change since 2000)
Private vehicle occupancy - In 2-person carpool (%)
Private vehicle occupancy - In 2-person carpool (% change since 2000)
Private vehicle occupancy - In 3-person carpool (%)
Private vehicle occupancy - In 3-person carpool (% change since 2000)
Private vehicle occupancy - In 4-person carpool (%)
Private vehicle occupancy - In 4-person carpool (% change since 2000)
Private vehicle occupancy - In 5- or 6-person carpool (%)
Private vehicle occupancy - In 5- or 6-person carpool (% change since 2000)
Private vehicle occupancy - In 7-or-more-person carpool (%)
Private vehicle occupancy - In 7-or-more-person carpool (% change since 2000)
Time Leaving Home To Go To Work - 12:00 a.m. to 4:59 a.m. (%)
Time Leaving Home To Go To Work - 12:00 a.m. to 4:59 a.m. (% change since 2000)
Time Leaving Home To Go To Work - 5:00 a.m. to 5:59 a.m. (%)
Time Leaving Home To Go To Work - 5:00 a.m. to 5:59 a.m. (% change since 2000)
Time Leaving Home To Go To Work - 6:00 a.m. to 6:59 a.m. (%)
Time Leaving Home To Go To Work - 6:00 a.m. to 6:59 a.m. (% change since 2000)
Time Leaving Home To Go To Work - 7:00 a.m. to 7:59 a.m. (%)
Time Leaving Home To Go To Work - 7:00 a.m. to 7:59 a.m. (% change since 2000)
Time Leaving Home To Go To Work - 8:00 a.m. to 8:59 a.m. (%)
Time Leaving Home To Go To Work - 8:00 a.m. to 8:59 a.m. (% change since 2000)
Time Leaving Home To Go To Work - 9:00 a.m. to 9:59 a.m. (%)
Time Leaving Home To Go To Work - 9:00 a.m. to 9:59 a.m. (% change since 2000)
Time Leaving Home To Go To Work - 10:00 a.m. to 10:59 a.m. (%)
Time Leaving Home To Go To Work - 10:00 a.m. to 10:59 a.m. (% change since 2000)
Time Leaving Home To Go To Work - 11:00 a.m. to 11:59 a.m. (%)
Time Leaving Home To Go To Work - 11:00 a.m. to 11:59 a.m. (% change since 2000)
Time Leaving Home To Go To Work - 12:00 p.m. to 3:59 p.m. (%)
Time Leaving Home To Go To Work - 12:00 p.m. to 3:59 p.m. (% change since 2000)
Time Leaving Home To Go To Work - 4:00 p.m. to 11:59 p.m. (%)
Time Leaving Home To Go To Work - 4:00 p.m. to 11:59 p.m. (% change since 2000)
Class of Workers - Employee of private company (%)
Class of Workers - Employee of private company (% change since 2000)
Class of Workers - Self-employed in own incorporated business (%)
Class of Workers - Self-employed in own incorporated business (% change since 2000)
Class of Workers - Private not-for-profit wage and salary workers (%)
Class of Workers - Private not-for-profit wage and salary workers (% change since 2000)
Class of Workers - Local government workers (%)
Class of Workers - Local government workers (% change since 2000)
Class of Workers - State government workers (%)
Class of Workers - State government workers (% change since 2000)
Class of Workers - Federal government workers (%)
Class of Workers - Federal government workers (% change since 2000)
Class of Workers - Self-employed workers in own not incorporated business and Unpaid family workers (%)
Class of Workers - Self-employed workers in own not incorporated business and Unpaid family workers (% change since 2000)
Means of transportation to work - Drove car alone (%)
Means of transportation to work - Drove car alone (% change since 2000)
Means of transportation to work - Carpooled (%)
Means of transportation to work - Carpooled (% change since 2000)
Means of transportation to work - Public transportation (%)
Means of transportation to work - Public transportation (% change since 2000)
Means of transportation to work - Bus or trolley bus (%)
Means of transportation to work - Bus or trolley bus (% change since 2000)
Means of transportation to work - Streetcar or trolley car (%)
Means of transportation to work - Streetcar or trolley car (% change since 2000)
Means of transportation to work - Subway or elevated (%)
Means of transportation to work - Subway or elevated (% change since 2000)
Means of transportation to work - Railroad (%)
Means of transportation to work - Railroad (% change since 2000)
Means of transportation to work - Ferryboat (%)
Means of transportation to work - Ferryboat (% change since 2000)
Means of transportation to work - Taxicab (%)
Means of transportation to work - Taxicab (% change since 2000)
Means of transportation to work - Motorcycle (%)
Means of transportation to work - Motorcycle (% change since 2000)
Means of transportation to work - Bicycle (%)
Means of transportation to work - Bicycle (% change since 2000)
Means of transportation to work - Walked (%)
Means of transportation to work - Walked (% change since 2000)
Means of transportation to work - Other means (%)
Means of transportation to work - Other means (% change since 2000)
Working at home (%)
Working at home (% change since 2000)
Travel time to work - Less than 5 minutes (%)
Travel time to work - Less than 5 minutes (% change since 2000)
Travel time to work - 5 to 9 minutes (%)
Travel time to work - 5 to 9 minutes (% change since 2000)
Travel time to work - 10 to 19 minutes (%)
Travel time to work - 10 to 19 minutes (% change since 2000)
Travel time to work - 20 to 29 minutes (%)
Travel time to work - 20 to 29 minutes (% change since 2000)
Travel time to work - 30 to 39 minutes (%)
Travel time to work - 30 to 39 minutes (% change since 2000)
Travel time to work - 40 to 59 minutes (%)
Travel time to work - 40 to 59 minutes (% change since 2000)
Travel time to work - 60 to 89 minutes (%)
Travel time to work - 60 to 89 minutes (% change since 2000)
Travel time to work - 90 or more minutes (%)
Travel time to work - 90 or more minutes (% change since 2000)
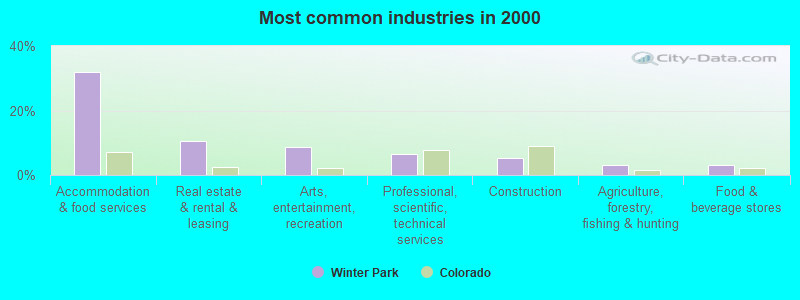
The most common industries in Winter Park are: Accommodation & food services (32.1% of civilian employees), Real estate & rental & leasing (10.4% of civilian employees), Arts, entertainment, recreation (8.6% of civilian employees). 82.5% of workers work in Grand County and 21.0% of all workers work at home. 74.0% of workers are employees of private companies, which is 10.0% greater than the rate of 66.6% across the entire state of Colorado.
Whole page based on the data from 2000 / 2022 when the population of Winter Park, Colorado was 662 / 771
Most common industries
Most common industries Industry All Males Females
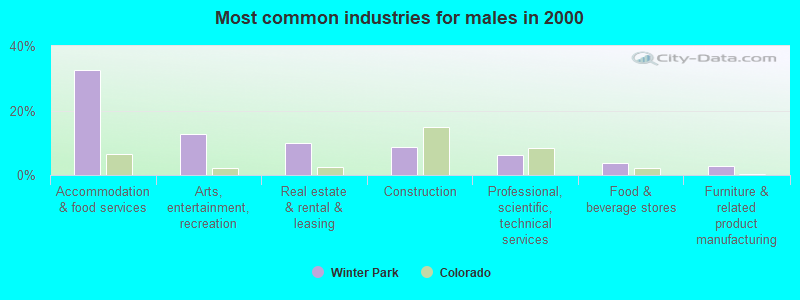
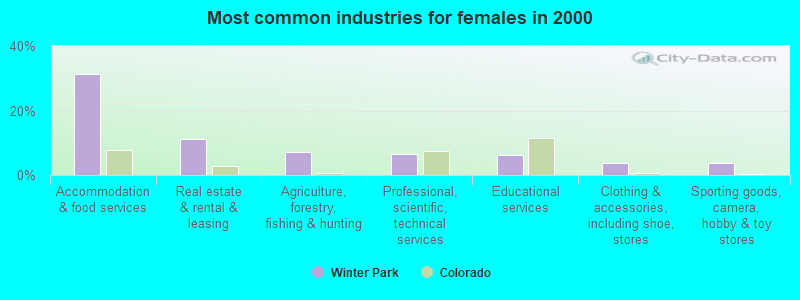
Accommodation and food services 32.1% 32.6% 31.3% Real estate and rental and leasing 10.4% 9.8% 11.2% Arts, entertainment, and recreation 8.6% 12.6% 3.3% Professional, scientific, and technical services 6.4% 6.3% 6.5% Construction 5.4% 8.8% 0.9% Agriculture, forestry, fishing and hunting 3.2% 0.4% 7.0% Food and beverage stores 3.2% 3.9% 2.3% Educational services 3.0% 0.7% 6.1% Sporting goods, camera, and hobby and toy stores 3.0% 2.5% 3.7% Health care 2.6% 2.1% 3.3% Furniture and related product manufacturing 2.2% 2.8% 1.4% Clothing and accessories, including shoe, stores 2.2% 1.1% 3.7% Public administration 2.0% 2.5% 1.4% U. S. Postal service 1.4% 1.4% 1.4% Food 1.2% 1.1% 1.4% Beverage and tobacco products 1.2% 1.8% 0.5% Administrative and support and waste management services 1.2% 0.7% 1.9% Private households 1.0% 0.0% 2.3% Miscellaneous nondurable goods merchant wholesalers 1.0% 1.8% 0.0% Finance and insurance 0.8% 1.4% 0.0% Pharmacies and drug stores 0.8% 1.4% 0.0% Transportation equipment 0.8% 0.4% 1.4% Religious, grantmaking, civic, professional, and similar organizations 0.8% 0.0% 1.9% Used merchandise, gift, novelty, and souvenir, and other miscellaneous stores 0.8% 0.0% 1.9% Jewelry, luggage, and leather goods stores 0.6% 1.1% 0.0% Groceries and related products merchant wholesalers 0.6% 1.1% 0.0% Other direct selling establishments 0.6% 0.0% 1.4% Air transportation 0.4% 0.0% 0.9% Retail florists 0.4% 0.0% 0.9% Utilities 0.4% 0.7% 0.0% Computer and electronic products 0.4% 0.7% 0.0% Radio, TV, and computer stores 0.4% 0.7% 0.0% Building material and garden equipment and supplies dealers 0.4% 0.0% 0.9% Personal and laundry services 0.4% 0.0% 0.9%
Unemployment in Winter Park Unemployment by race in 2022
Unemployment rate for White non-Hispanic residents 3.4% Males7.9% FemalesUnemployment by race in 2000
Unemployment rate for White non-Hispanic residents 4.0% Males
Time leaving home to go to work 12:00 a.m. to 4:59 a.m.: Winter Park:
8.1% (29)Colorado:
4.7% (115,593)
5:30 a.m. to 5:59 a.m.: Winter Park:
19.6% (69)Colorado:
5.0% (123,851)
6:00 a.m. to 6:29 a.m.: Winter Park:
7.2% (26)Colorado:
8.6% (210,736)
6:30 a.m. to 6:59 a.m.: Winter Park:
2.5% (9)Colorado:
10.2% (250,710)
7:00 a.m. to 7:29 a.m.: Winter Park:
2.1% (8)Colorado:
14.7% (362,963)
7:30 a.m. to 7:59 a.m.: Winter Park:
10.6% (38)Colorado:
12.7% (311,366)
8:00 a.m. to 8:29 a.m.: Winter Park:
17.4% (62)Colorado:
12.3% (302,330)
8:30 a.m. to 8:59 a.m.: Winter Park:
2.7% (10)Colorado:
5.4% (131,963)
9:00 a.m. to 9:59 a.m.: Winter Park:
15.9% (56)Colorado:
7.2% (175,993)
10:00 a.m. to 10:59 a.m.: Winter Park:
6.1% (22)Colorado:
3.2% (78,921)
11:00 a.m. to 11:59 a.m.: Winter Park:
4.0% (14)Colorado:
1.4% (35,132)
12:00 p.m. to 3:59 p.m.: Winter Park:
2.9% (10)Colorado:
5.8% (141,725)
4:00 p.m. to 11:59 p.m.: Winter Park:
2.1% (7)Colorado:
5.2% (127,420)
<5am: Winter Park:
1.5% (7)Colorado:
2.9% (62,865)
5:30am: Winter Park:
0.6% (3)Colorado:
2.6% (57,037)
6am: Winter Park:
0.9% (4)Colorado:
4.6% (100,940)
6:30am: Winter Park:
4.3% (20)Colorado:
9.0% (197,321)
7am: Winter Park:
7.6% (35)Colorado:
11.3% (246,749)
7:30am: Winter Park:
14.0% (65)Colorado:
15.4% (336,717)
8am: Winter Park:
28.9% (134)Colorado:
15.0% (329,151)
8:30am: Winter Park:
9.9% (46)Colorado:
10.0% (219,216)
9am: Winter Park:
5.4% (25)Colorado:
4.8% (105,802)
10am: Winter Park:
9.5% (44)Colorado:
5.2% (114,870)
11am: Winter Park:
2.4% (11)Colorado:
2.2% (48,948)
12pm: Winter Park:
1.3% (6)Colorado:
1.0% (22,224)
4pm: Winter Park:
3.0% (14)Colorado:
5.6% (122,019)
>4pm: Winter Park:
2.2% (10)Colorado:
5.5% (119,635)
5:30 a.m. to 5:59 a.m. - Males: Winter Park:
34.2% (73)Colorado:
6.5% (88,204)
6:00 a.m. to 6:29 a.m. - Males: Winter Park:
9.1% (19)Colorado:
10.5% (143,601)
6:30 a.m. to 6:59 a.m. - Males: Winter Park:
4.1% (9)Colorado:
10.4% (141,916)
7:00 a.m. to 7:29 a.m. - Males: Winter Park:
3.6% (8)Colorado:
14.3% (194,350)
7:30 a.m. to 7:59 a.m. - Males: Winter Park:
10.9% (23)Colorado:
10.6% (144,090)
8:00 a.m. to 8:29 a.m. - Males: Winter Park:
3.4% (7)Colorado:
11.5% (157,061)
8:30 a.m. to 8:59 a.m. - Males: Winter Park:
4.5% (10)Colorado:
4.6% (62,737)
9:00 a.m. to 9:59 a.m. - Males: Winter Park:
11.8% (25)Colorado:
6.2% (84,699)
10:00 a.m. to 10:59 a.m. - Males: Winter Park:
3.4% (7)Colorado:
2.7% (36,864)
11:00 a.m. to 11:59 a.m. - Males: Winter Park:
6.8% (15)Colorado:
1.3% (17,686)
12:00 p.m. to 3:59 p.m. - Males: Winter Park:
4.8% (10)Colorado:
5.3% (72,846)
4:00 p.m. to 11:59 p.m. - Males: Winter Park:
3.6% (8)Colorado:
5.1% (69,925)
12:00 a.m. to 4:59 a.m. - Females: Winter Park:
20.8% (30)Colorado:
3.2% (35,712)
6:00 a.m. to 6:29 a.m. - Females: Winter Park:
4.4% (6)Colorado:
6.1% (67,135)
7:30 a.m. to 7:59 a.m. - Females: Winter Park:
9.9% (14)Colorado:
15.2% (167,276)
8:00 a.m. to 8:29 a.m. - Females: Winter Park:
38.8% (55)Colorado:
13.2% (145,269)
9:00 a.m. to 9:59 a.m. - Females: Winter Park:
22.0% (31)Colorado:
8.3% (91,294)
10:00 a.m. to 10:59 a.m. - Females: Winter Park:
10.1% (14)Colorado:
3.8% (42,057)
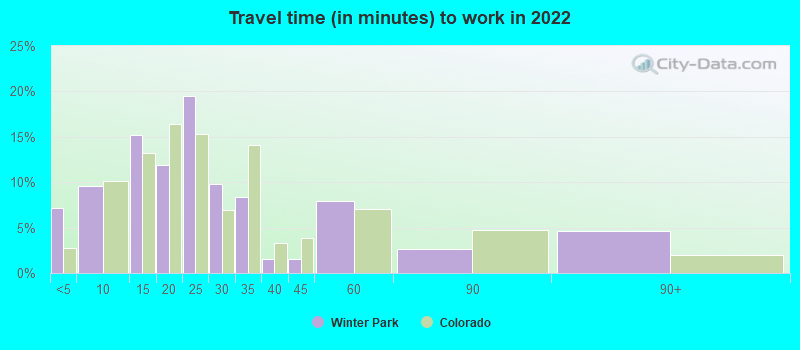
Travel time to work Percentage of workers working in this county: 82.5%Number of people working at home: 99 (21.0% of all workers )
Less than 5 minutes: Winter Park:
7.2% (85)Colorado:
2.8% (68,148)
5 to 9 minutes: Winter Park:
9.6% (114)Colorado:
10.2% (249,977)
10 to 14 minutes: Winter Park:
15.2% (180)Colorado:
13.2% (325,799)
15 to 19 minutes: Winter Park:
11.9% (141)Colorado:
16.4% (403,900)
20 to 24 minutes: Winter Park:
19.5% (231)Colorado:
15.3% (377,005)
25 to 29 minutes: Winter Park:
9.8% (116)Colorado:
7.0% (171,926)
30 to 34 minutes: Winter Park:
8.3% (99)Colorado:
14.1% (347,229)
35 to 39 minutes: Winter Park:
1.6% (19)Colorado:
3.4% (82,490)
40 to 44 minutes: Winter Park:
1.5% (18)Colorado:
3.9% (96,028)
45 to 59 minutes: Winter Park:
7.9% (94)Colorado:
7.0% (172,768)
60 to 89 minutes: Winter Park:
2.6% (31)Colorado:
4.8% (117,152)
90 or more minutes: Winter Park:
4.6% (55)Colorado:
2.0% (49,250)
Less than 5 minutes: Winter Park:
11.7% (54)Colorado:
3.3% (72,206)
5 to 9 minutes: Winter Park:
22.2% (103)Colorado:
10.8% (235,913)
10 to 14 minutes: Winter Park:
20.3% (94)Colorado:
14.5% (318,642)
15 to 19 minutes: Winter Park:
15.6% (72)Colorado:
15.2% (333,306)
20 to 24 minutes: Winter Park:
9.1% (42)Colorado:
14.3% (313,409)
25 to 29 minutes: Winter Park:
3.9% (18)Colorado:
5.7% (125,679)
30 to 34 minutes: Winter Park:
3.7% (17)Colorado:
12.8% (281,268)
40 to 44 minutes: Winter Park:
0.9% (4)Colorado:
3.3% (71,983)
60 to 89 minutes: Winter Park:
3.5% (16)Colorado:
3.9% (85,337)
90 or more minutes: Winter Park:
0.9% (4)Colorado:
2.0% (43,343)
Less than 5 minutes - Males: Winter Park:
5.2% (28)Colorado:
2.5% (34,040)
5 to 9 minutes - Males: Winter Park:
7.7% (42)Colorado:
8.8% (120,289)
10 to 14 minutes - Males: Winter Park:
8.9% (48)Colorado:
12.1% (165,016)
15 to 19 minutes - Males: Winter Park:
10.7% (58)Colorado:
16.1% (219,838)
20 to 24 minutes - Males: Winter Park:
35.4% (192)Colorado:
14.9% (202,357)
25 to 29 minutes - Males: Winter Park:
2.5% (13)Colorado:
7.1% (96,086)
30 to 34 minutes - Males: Winter Park:
7.7% (42)Colorado:
14.8% (201,235)
45 to 59 minutes - Males: Winter Park:
13.1% (71)Colorado:
8.0% (108,737)
60 to 89 minutes - Males: Winter Park:
4.3% (24)Colorado:
5.9% (80,004)
90 or more minutes - Males: Winter Park:
3.5% (19)Colorado:
2.3% (31,393)
Less than 5 minutes - Females: Winter Park:
9.1% (59)Colorado:
3.1% (34,108)
5 to 9 minutes - Females: Winter Park:
11.4% (73)Colorado:
11.8% (129,688)
10 to 14 minutes - Females: Winter Park:
20.9% (134)Colorado:
14.6% (160,783)
15 to 19 minutes - Females: Winter Park:
12.6% (81)Colorado:
16.7% (184,062)
20 to 24 minutes - Females: Winter Park:
5.8% (37)Colorado:
15.9% (174,648)
25 to 29 minutes - Females: Winter Park:
15.7% (101)Colorado:
6.9% (75,840)
30 to 34 minutes - Females: Winter Park:
8.9% (57)Colorado:
13.3% (145,994)
35 to 39 minutes - Females: Winter Park:
2.9% (18)Colorado:
3.0% (33,294)
40 to 44 minutes - Females: Winter Park:
2.8% (18)Colorado:
3.8% (41,932)
45 to 59 minutes - Females: Winter Park:
3.7% (24)Colorado:
5.8% (64,031)
60 to 89 minutes - Females: Winter Park:
1.2% (8)Colorado:
3.4% (37,148)
90 or more minutes - Females: Winter Park:
5.7% (37)Colorado:
1.6% (17,857)
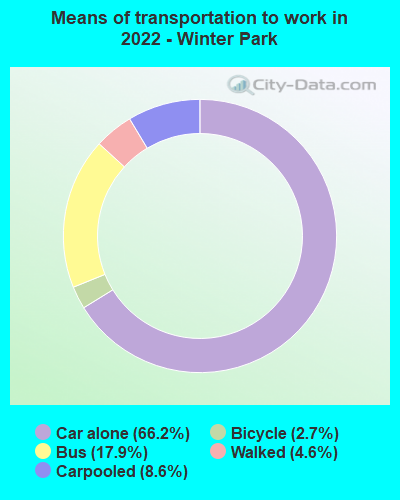
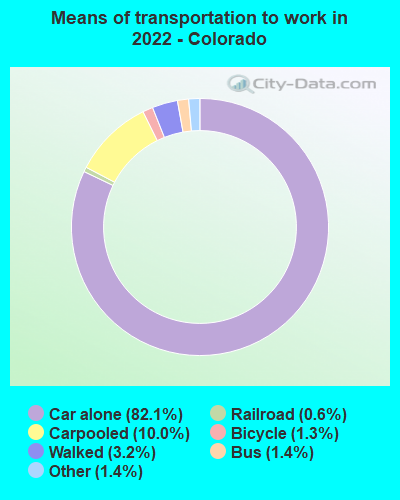
Means of transportation to work Drove car alone: Winter Park:
66.2% (832)Colorado:
82.1% (894,536)
Carpooled: Winter Park:
8.6% (108)Colorado:
10.0% (123,758)
Bus: Winter Park:
17.9% (225)Colorado:
1.4% (16,474)
Bicycle: Winter Park:
2.7% (34)Colorado:
1.3% (11,214)
Walked: Winter Park:
4.6% (57)Colorado:
3.2% (34,582)
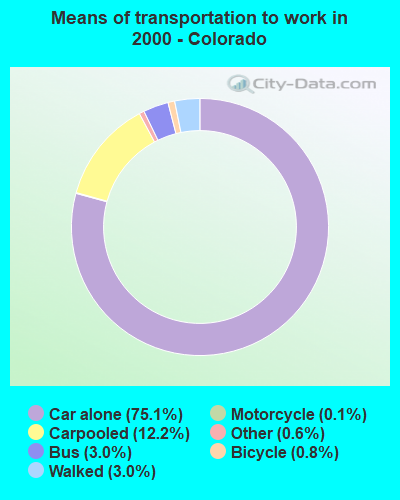
Drove car alone: Winter Park:
62.6% (290)Colorado:
75.1% (1,646,454)
Carpooled: Winter Park:
9.5% (44)Colorado:
12.2% (268,168)
Bus or trolley bus: Winter Park:
3.2% (15)Colorado:
3.0% (66,179)
Streetcar or trolley car: Winter Park:
3.2% (15)Colorado:
0.0% (780)
Bicycle: Winter Park:
2.6% (12)Colorado:
0.8% (16,905)
Walked: Winter Park:
8.6% (40)Colorado:
3.0% (65,668)
Other means: Winter Park:
1.7% (8)Colorado:
0.6% (14,202)
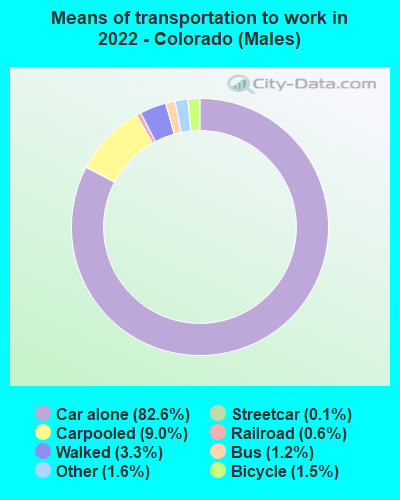
Drove car alone - Males: Winter Park:
79.9% (458)Colorado:
82.6% (894,536)
Carpooled - Males: Winter Park:
5.6% (32)Colorado:
9.0% (123,758)
Bus - Males: Winter Park:
10.1% (58)Colorado:
1.2% (16,474)
Bicycle - Males: Winter Park:
2.7% (16)Colorado:
1.5% (11,214)
Walked - Males: Winter Park:
1.6% (9)Colorado:
3.3% (34,582)
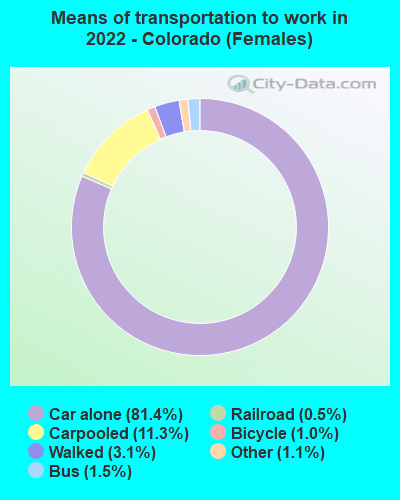
Drove car alone - Females: Winter Park:
54.7% (374)Colorado:
81.4% (894,536)
Carpooled - Females: Winter Park:
11.1% (76)Colorado:
11.3% (123,758)
Bus - Females: Winter Park:
24.4% (167)Colorado:
1.5% (16,474)
Bicycle - Females: Winter Park:
2.7% (19)Colorado:
1.0% (11,214)
Walked - Females: Winter Park:
7.0% (48)Colorado:
3.1% (34,582)
Private vehicle occupancy Drove alone: Winter Park:
92.6% (273)Colorado:
89.1% (2,019,886)
In 2 person carpool: Winter Park:
7.1% (21)Colorado:
8.0% (180,543)
Drove alone: Winter Park:
86.8% (290)Colorado:
86.0% (1,646,454)
In 2 person carpool: Winter Park:
12.0% (40)Colorado:
11.0% (210,761)
In 3 person carpool: Winter Park:
1.2% (4)Colorado:
2.0% (37,987)
Class of workers
Employee of private company: Winter Park:
74.0% (351)Colorado:
66.6% (2,085,890)
Self-employed in own incorporated business: Winter Park:
1.5% (7)Colorado:
5.1% (159,992)
Private not-for-profit wage and salary workers: Winter Park:
15.5% (74)Colorado:
8.1% (252,887)
Local government workers: Winter Park:
7.9% (37)Colorado:
7.5% (236,118)
Self-employed workers in own not incorporated business: Winter Park:
1.1% (5)Colorado:
6.1% (190,717)
Employee of private company: Winter Park:
58.5% (292)Colorado:
67.3% (1,485,056)
Self-employed in own incorporated business: Winter Park:
6.6% (33)Colorado:
4.4% (96,165)
Private not-for-profit wage and salary workers: Winter Park:
21.4% (107)Colorado:
6.4% (141,129)
Local government workers: Winter Park:
4.4% (22)Colorado:
6.9% (152,123)
State government workers: Winter Park:
0.6% (3)Colorado:
3.9% (85,273)
Federal government workers: Winter Park:
1.4% (7)Colorado:
3.1% (68,409)
Self-employed workers in own not incorporated business: Winter Park:
6.8% (34)Colorado:
7.7% (169,415)
Unpaid family workers: Winter Park:
0.2% (1)Colorado:
0.3% (7,624)
Employee of private company - Males: Winter Park:
90.6% (261)Colorado:
70.8% (1,193,195)
Private not-for-profit wage and salary workers - Males: Winter Park:
2.9% (8)Colorado:
5.3% (89,431)
Local government workers - Males: Winter Park:
6.5% (19)Colorado:
5.6% (94,710)
Employee of private company - Females: Winter Park:
48.3% (90)Colorado:
61.8% (892,695)
Self-employed in own incorporated business - Females: Winter Park:
3.9% (7)Colorado:
4.2% (60,681)
Private not-for-profit wage and salary workers - Females: Winter Park:
35.0% (65)Colorado:
11.3% (163,456)
Local government workers - Females: Winter Park:
10.0% (19)Colorado:
9.8% (141,408)
Self-employed workers in own not incorporated business - Females: Winter Park:
2.8% (5)Colorado:
6.0% (86,362)