Estimated zip code population in 2022: 2,740 Zip code population in 2010: 2,270 Zip code population in 2000: 2,349
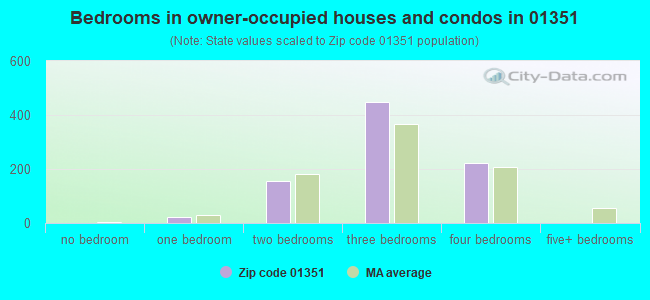
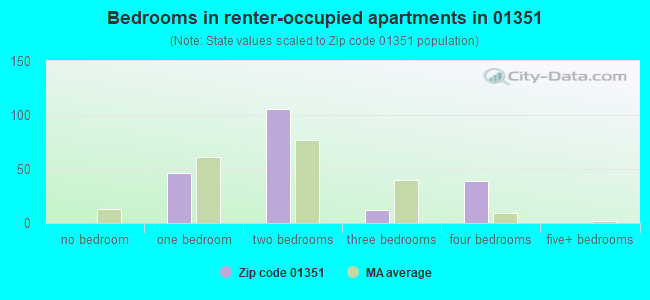
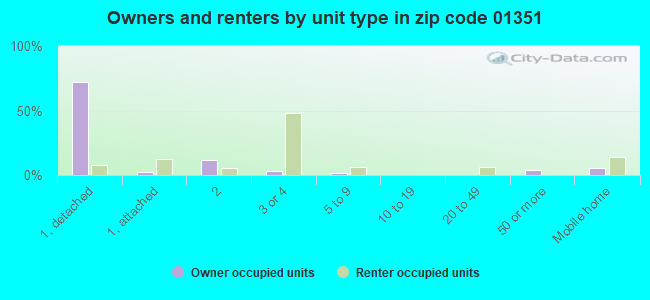
Houses and condos: 1,087 Renter-occupied apartments: 204
% of renters here:
19%
State:
38%
March 2022 cost of living index in zip code 01351: 85.8 (less than average, U.S. average is 100)
Land area: 20.9 sq. mi. Water area: 0.4 sq. mi.
Population density: 131 people per square mile
(very low).
OSM Map
Google Map
MSN Map
OSM Map
General Map
Google Map
MSN Map
OSM Map
Google Map
MSN Map
OSM Map
Google Map
MSN Map
Please wait while loading the map...
Real estate property taxes paid for housing units in 2022:
This zip code:
1.6% ($5,034)
Massachusetts:
1.0% ($5,536)
Median real estate property taxes paid for housing units with mortgages in 2022: $5,192 (1.6%) Median real estate property taxes paid for housing units with no mortgage in 2022: $4,750 (1.6%)
Business Search- 14 Million verified businesses
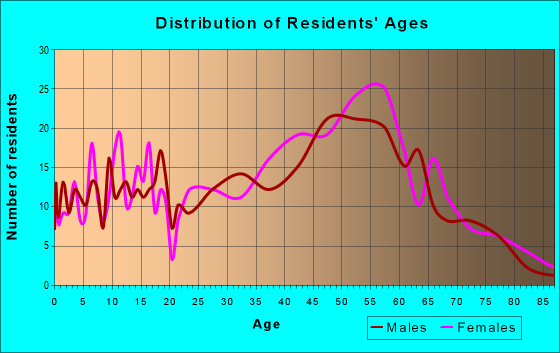
Males: 1,297
(47.3%)
Females: 1,443
(52.7%)
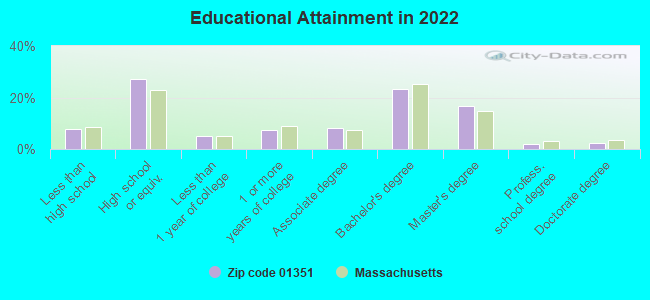
For population 25 years and over in 01351:
High school or higher: 91.8%
Bachelor's degree or higher: 44.0%
Graduate or professional degree: 21.0%
Unemployed: 2.8%
Mean travel time to work (commute): 21.3 minutes
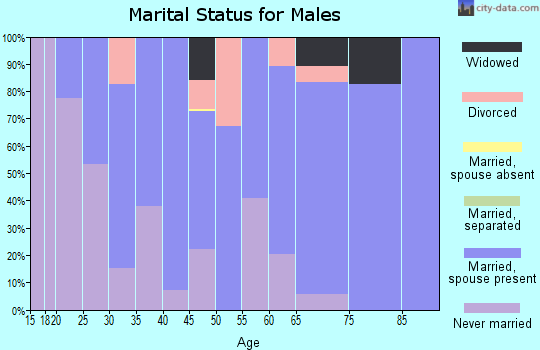
For population 15 years and over in 01351:
Never married: 31.7%
Now married: 46.6%
Separated: 0.0%
Widowed: 8.8%
Divorced: 12.9%
Zip code 01351 compared to state average:
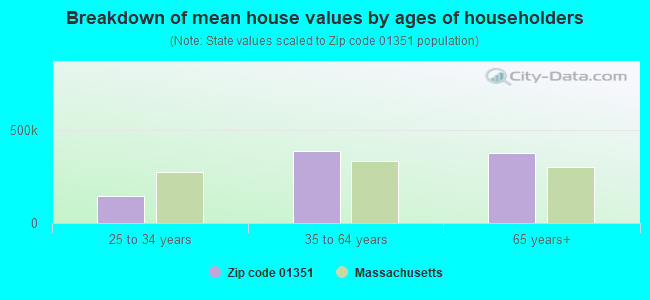
Median house value below state average.
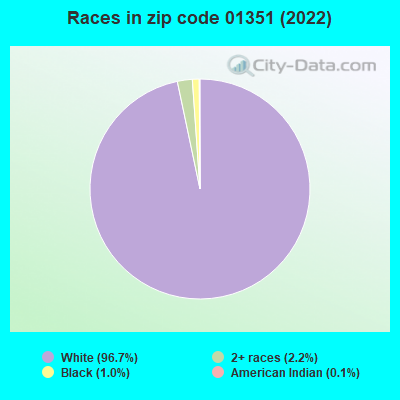
Black race population percentage significantly below state average.
Hispanic race population percentage significantly below state average.
Median age above state average.
Foreign-born population percentage significantly below state average.
Renting percentage below state average.
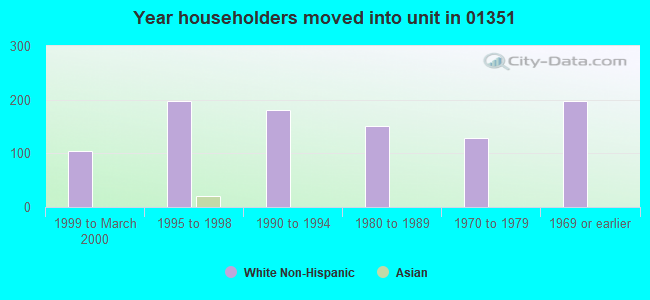
Length of stay since moving in significantly above state average.
Number of college students significantly below state average.
Estimated median house/condo value in 2022: $314,256
01351:
$314,256
Massachusetts:
$534,700
According to our research of Massachusetts and other state lists, there were 2 registered sex offenders living in 01351 zip code as of May 15, 2024. The ratio of all residents to sex offenders in zip code 01351 is 1,173 to 1.
Median resident age:
This zip code:
44.6 years
Massachusetts median age:
40.3 years
Average household size:
This zip code:
2.6 people
Massachusetts:
2.4 people
Averages for the 2020 tax year for zip code 01351, filed in 2021:
Average Adjusted Gross Income (AGI) in 2020: $65,476 (Individual Income Tax Returns)
Here:
$65,476
State:
$105,130
Salary/wage: $54,883 (reported on 75.6% of returns)
Here:
$54,883
State:
$82,951
(% of AGI for various income ranges: 1076.8% for AGIs below $25k, 3481.2% for AGIs $25k-50k, 6096.4% for AGIs $50k-75k, 10987.8% for AGIs $75k-100k, 17615.0% for AGIs $100k-200k)
Taxable interest for individuals: $1,053 (reported on 43.0% of returns)
This zip code:
$1,053
Massachusetts:
$2,361
(% of AGI for various income ranges: 31.4% for AGIs below $25k, 17.3% for AGIs $25k-50k, 32.1% for AGIs $50k-75k, 80.0% for AGIs $75k-100k, 272.0% for AGIs $100k-200k)
Ordinary dividends: $5,789 (reported on 28.1% of returns)
Here:
$5,789
State:
$10,365
(% of AGI for various income ranges: 60.9% for AGIs below $25k, 83.1% for AGIs $25k-50k, 208.6% for AGIs $50k-75k, 167.8% for AGIs $75k-100k, 752.0% for AGIs $100k-200k)
Net capital gain/loss in AGI: +$19,232 (reported on 23.0% of returns)
Here:
+$19,232
State:
+$48,178
(% of AGI for various income ranges: 25.9% for AGIs below $25k, 101.5% for AGIs $25k-50k, 230.7% for AGIs $50k-75k, 207.8% for AGIs $75k-100k, 1008.0% for AGIs $100k-200k)
Profit/loss from business: +$9,715 (reported on 20.0% of returns)
Here:
+$9,715
State:
+$20,792
(% of AGI for various income ranges: 121.4% for AGIs below $25k, 306.9% for AGIs $25k-50k, 237.9% for AGIs $50k-75k, 478.9% for AGIs $75k-100k, 794.0% for AGIs $100k-200k)
Taxable individual retirement arrangement distribution: $17,713 (reported on 11.1% of returns)
01351:
$17,713
Massachusetts:
$22,790
(% of AGI for various income ranges: 105.0% for AGIs below $25k, 193.5% for AGIs $25k-50k, 695.6% for AGIs $75k-100k, 1297.0% for AGIs $100k-200k)
Total itemized deductions: $22,536 (reported on 8.1% of returns)
Here:
$22,536
State:
$36,722
(% of AGI for various income ranges: 199.1% for AGIs below $25k, 395.0% for AGIs $50k-75k, 603.3% for AGIs $75k-100k, 945.0% for AGIs $100k-200k)
Charity contributions: $6,814 (reported on 5.2% of returns)
Here:
$6,814
State:
$12,529
(% of AGI for various income ranges: 161.4% for AGIs $50k-75k, 251.0% for AGIs $100k-200k)
Taxes paid: $7,655 (reported on 8.1% of returns)
01351:
$7,655
State:
$8,782
(% of AGI for various income ranges: 235.0% for AGIs $50k-75k, 242.2% for AGIs $75k-100k, 295.0% for AGIs $100k-200k)
Earned income credit: $1,092 (reported on 8.9% of returns)
Here:
$1,092
State:
$1,909
(% of AGI for various income ranges: 29.5% for AGIs below $25k, 25.4% for AGIs $25k-50k)
Percentage of individuals using paid preparers for their 2020 taxes: 88.9%
Here:
89%
State:
92%
(% for various income ranges: 88.9% for AGIs below $25k, 86.5% for AGIs $25k-50k, 90.5% for AGIs $50k-75k, 88.2% for AGIs $75k-100k, 89.5% for AGIs $100k-200k, 100.0% for AGIs over 200k)
Averages for the 2012 tax year for zip code 01351, filed in 2013:
Average Adjusted Gross Income (AGI) in 2012: $56,029 (Individual Income Tax Returns)
Here:
$56,029
State:
$81,425
Salary/wage: $47,215 (reported on 79.5% of returns)
Here:
$47,215
State:
$64,752
(% of AGI for various income ranges: 63.9% for AGIs below $25k, 76.0% for AGIs $25k-50k, 73.0% for AGIs $50k-75k, 75.7% for AGIs $75k-100k, 72.6% for AGIs $100k-200k, 31.5% for AGIs over 200k)
Taxable interest for individuals: $761 (reported on 50.8% of returns)
This zip code:
$761
Massachusetts:
$2,136
(% of AGI for various income ranges: 2.1% for AGIs below $25k, 0.7% for AGIs $25k-50k, 0.7% for AGIs $50k-75k, 0.5% for AGIs $75k-100k, 0.3% for AGIs $100k-200k, 0.7% for AGIs over 200k)
Ordinary dividends: $4,553 (reported on 27.9% of returns)
Here:
$4,553
State:
$9,473
(% of AGI for various income ranges: 3.2% for AGIs below $25k, 2.0% for AGIs $25k-50k, 1.5% for AGIs $50k-75k, 1.2% for AGIs $75k-100k, 2.1% for AGIs $100k-200k, 4.4% for AGIs over 200k)
Net capital gain/loss in AGI: +$2,874 (reported on 18.9% of returns)
Here:
+$2,874
State:
+$31,437
(% of AGI for various income ranges: 0.3% for AGIs $25k-50k, 1.0% for AGIs $75k-100k, 3.1% for AGIs $100k-200k)
Profit/loss from business: +$13,446 (reported on 21.3% of returns)
Here:
+$13,446
State:
+$20,662
(% of AGI for various income ranges: 11.4% for AGIs below $25k, 6.7% for AGIs $25k-50k, 3.8% for AGIs $50k-75k, 4.2% for AGIs $75k-100k, 6.7% for AGIs $100k-200k)
Taxable individual retirement arrangement distribution: $12,531 (reported on 10.7% of returns)
01351:
$12,531
Massachusetts:
$18,892
(% of AGI for various income ranges: 2.4% for AGIs below $25k, 1.8% for AGIs $25k-50k, 2.4% for AGIs $50k-75k, 2.5% for AGIs $75k-100k, 4.1% for AGIs $100k-200k)
Self-employment retirement plans: $9,250 (reported on 1.6% of returns)
01351:
$9,250
Massachusetts:
$20,669
Total itemized deductions: $18,319 (20% of AGI, reported on 39.3% of returns)
Here:
$18,319
State:
$28,907
Here:
19.9% of AGI
State:
18.2% of AGI
(% of AGI for various income ranges: 9.4% for AGIs below $25k, 10.2% for AGIs $25k-50k, 14.1% for AGIs $50k-75k, 14.3% for AGIs $75k-100k, 14.8% for AGIs $100k-200k, 11.3% for AGIs over 200k)
Charity contributions: $2,005 (reported on 30.3% of returns)
Here:
$2,005
State:
$4,208
(% of AGI for various income ranges: 0.4% for AGIs below $25k, 0.5% for AGIs $25k-50k, 0.9% for AGIs $50k-75k, 1.1% for AGIs $75k-100k, 1.1% for AGIs $100k-200k, 2.4% for AGIs over 200k)
Taxes paid: $8,662 (reported on 39.3% of returns)
01351:
$8,662
State:
$13,303
(% of AGI for various income ranges: 2.9% for AGIs below $25k, 4.1% for AGIs $25k-50k, 6.5% for AGIs $50k-75k, 7.0% for AGIs $75k-100k, 7.5% for AGIs $100k-200k, 6.1% for AGIs over 200k)
Earned income credit: $1,615 (reported on 10.7% of returns)
Here:
$1,615
State:
$1,971
(% of AGI for various income ranges: 3.2% for AGIs below $25k, 0.4% for AGIs $25k-50k)
Percentage of individuals using paid preparers for their 2012 taxes: 54.1%
Here:
54%
State:
56%
(% for various income ranges: 45.0% for AGIs below $25k, 48.5% for AGIs $25k-50k, 63.2% for AGIs $50k-75k, 64.3% for AGIs $75k-100k, 84.6% for AGIs $100k-200k)
Averages for the 2004 tax year for zip code 01351, filed in 2005:
Average Adjusted Gross Income (AGI) in 2004: $45,190 (Individual Income Tax Returns)
Here:
$45,190
State:
$62,877
Salary/wage: $40,057 (reported on 85.3% of returns)
Here:
$40,057
State:
$52,969
(% of AGI for various income ranges: 89.7% for AGIs below $10k, 72.7% for AGIs $10k-25k, 81.9% for AGIs $25k-50k, 82.4% for AGIs $50k-75k, 81.3% for AGIs $75k-100k, 60.7% for AGIs over 100k)
Taxable interest for individuals: $890 (reported on 60.2% of returns)
This zip code:
$890
Massachusetts:
$1,945
(% of AGI for various income ranges: 5.6% for AGIs below $10k, 1.6% for AGIs $10k-25k, 0.9% for AGIs $25k-50k, 1.2% for AGIs $50k-75k, 0.4% for AGIs $75k-100k, 1.6% for AGIs over 100k)
Taxable dividends: $2,645 (reported on 30.0% of returns)
Here:
$2,645
State:
$5,323
(% of AGI for various income ranges: 3.9% for AGIs below $10k, 2.8% for AGIs $10k-25k, 1.7% for AGIs $25k-50k, 1.0% for AGIs $50k-75k, 0.8% for AGIs $75k-100k, 2.6% for AGIs over 100k)
Net capital gain/loss: +$6,588 (reported on 22.8% of returns)
Here:
+$6,588
State:
+$20,377
(% of AGI for various income ranges: -3.1% for AGIs below $10k, 0.7% for AGIs $10k-25k, 1.3% for AGIs $25k-50k, 0.1% for AGIs $50k-75k, 3.6% for AGIs $75k-100k, 9.0% for AGIs over 100k)
Profit/loss from business: +$10,816 (reported on 23.6% of returns)
Here:
+$10,816
State:
+$17,837
(% of AGI for various income ranges: 18.9% for AGIs below $10k, 9.0% for AGIs $10k-25k, 4.8% for AGIs $25k-50k, 4.8% for AGIs $50k-75k, 6.9% for AGIs $75k-100k, 4.7% for AGIs over 100k)
IRA payment deduction: $2,477 (reported on 5.4% of returns)
01351:
$2,477
Massachusetts:
$3,100
Self-employed pension: $9,304 (reported on 1.9% of returns)
Here:
$9,304
Massachusetts:
$14,516
Total itemized deductions: $15,106 (21% of AGI, reported on 43.5% of returns)
Here:
$15,106
State:
$22,573
Here:
21.4% of AGI
State:
19.5% of AGI
(% of AGI for various income ranges: 26.0% for AGIs below $10k, 10.8% for AGIs $10k-25k, 14.4% for AGIs $25k-50k, 14.4% for AGIs $50k-75k, 16.0% for AGIs $75k-100k, 14.4% for AGIs over 100k)
Charity contributions deductions: $1,721 (2% of AGI, reported on 38.7% of returns)
Here:
$1,721
State:
$3,295
Here:
2.4% of AGI
State:
2.7% of AGI
(% of AGI for various income ranges: 1.5% for AGIs $10k-25k, 1.1% for AGIs $25k-50k, 1.5% for AGIs $50k-75k, 1.4% for AGIs $75k-100k, 1.9% for AGIs over 100k)
Total tax: $5,924 (reported on 84.0% of returns)
01351:
$5,924
State:
$11,494
(% of AGI for various income ranges: 6.0% for AGIs below $10k, 5.5% for AGIs $10k-25k, 7.8% for AGIs $25k-50k, 9.5% for AGIs $50k-75k, 10.9% for AGIs $75k-100k, 17.1% for AGIs over 100k)
Earned income credit: $1,319 (reported on 7.6% of returns)
Here:
$1,319
State:
$1,518
Percentage of individuals using paid preparers for their 2004 taxes: 54.4%
Here:
54%
State:
58%
(% for various income ranges: 46.6% for AGIs below $10k, 46.6% for AGIs $10k-25k, 52.9% for AGIs $25k-50k, 61.1% for AGIs $50k-75k, 61.8% for AGIs $75k-100k, 74.7% for AGIs over 100k)
Likely homosexual households (counted as self-reported same-sex unmarried-partner households)
Lesbian couples: 0.7% of all households
Gay men: 0.0% of all households
Household received Food Stamps/SNAP in the past 12 months: 53 Household did not receive Food Stamps/SNAP in the past 12 months: 981
Women who had a birth in the past 12 months: 19 (0 now married, 16 unmarried) Women who did not have a birth in the past 12 months: 667 (205 now married, 464 unmarried)
Housing units in zip code 01351 with a mortgage: 526 (45 second mortgage, 46 both second mortgage and home equity loan) Houses without a mortgage: 53
Median monthly owner costs for units with a mortgage: $1,775 Median monthly owner costs for units without a mortgage: $718
Residents with income below the poverty level in 2022:
This zip code:
7.4%
Whole state:
10.4%
Residents with income below 50% of the poverty level in 2022:
This zip code:
6.1%
Whole state:
5.1%
Median number of rooms in houses and condos:
Here:
6.4
State:
6.5
Median number of rooms in apartments:
Here:
5.0
State:
4.0
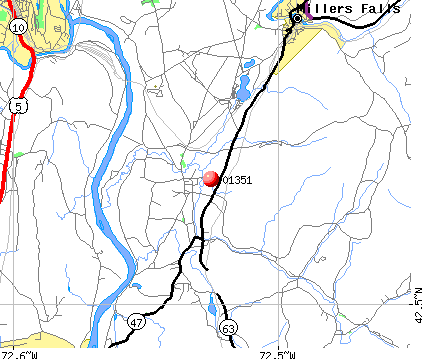
Notable locations in this zip code not listed on our city pages
Notable locations in zip code 01351: Massachusetts State Fish Hatchery (A), Montague Fire Department (B), Montague Town Hall (C). Display/hide their locations on the map
Cemeteries: Town Farm Cemetery (1), Old South Cemetery (2), Elm Grove Cemetery (3), Our Lady of Czechowski Cemetery (4), Aaron Clark Memorial Cemetery (5), Springdale Cemetery (6), Chestnut Hill Cemetery (7). Display/hide their locations on the map
In group quarters: 4 (-1 institutionalized population)
Size of family households: 233 2-persons, 265 3-persons, 81 4-persons, 40 5-persons, 42 7-or-more-persons
Size of nonfamily households: 254 1-person, 137 2-persons, 3 3-persons
172 married couples with children.
357 single-parent households (9 men, 348 women).
97.9% of residents of 01351 zip code speak English at home.
0.4% of residents speak Spanish at home (100% very well).
1.1% of residents speak other Indo-European language at home (100% very well).
0.1% of residents speak other language at home (100% very well).
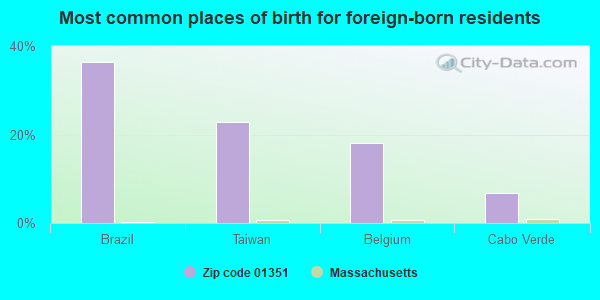
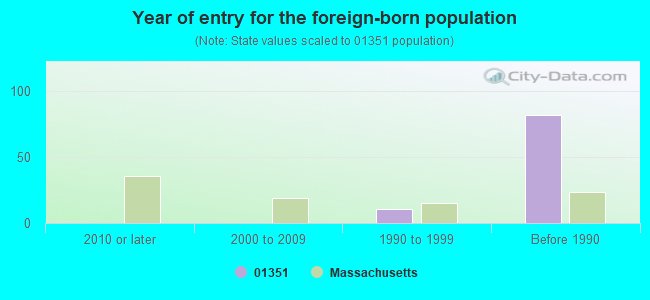
Foreign born population: 44 (1.6%) (100.0% of them are naturalized citizens)
This zip code:
1.6%
Whole state:
18.0%
36%Brazil
23%Taiwan
18%Belgium
7%Cabo Verde
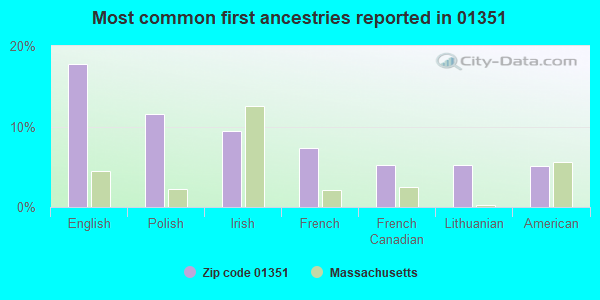
18%English
12%Polish
9%Irish
7%French
5%French Canadian
5%Lithuanian
5%American
Year of entry for the foreign-born population
02010 or later
02000 to 2009
111990 to 1999
82Before 1990
Facilities with environmental interests located in this zip code:
MONTAGUE W P C F (34 GREENFIELD ROAD in MONTAGUE, MA)
National Pollutant Discharge Elimination System MAJOR (Tracking pollutant discharge elimination systems) - permit - ICIS-, ENFORCEMENT/COMPLIANCE ACTIVITY Business SIC classification: SEWERAGE SYSTEMS Organizations: TOWN OF MONTAGUE (CONTACT/OWNER)
MONTAGUE CENTER (15 SCHOOL STREET in MONTAGUE, MA)
(National Center for Education Statistics) - STATE ID-674020 Organizations: GILL-MONTAGUE (SCHOOL DISTRICT)
BITZ FISH HATCHERY (HATCHERY ROAD in MONTAGUE, MA)
National Pollutant Discharge Elimination System NON-MAJOR (Tracking pollutant discharge elimination systems) - permit Business SIC classification: FISH HATCHERIES AND PRESERVES Organizations: MASS FISHERIES AND WILDLIFE (CONTACT/OPERATOR)
, MASS FISHERIES & WILDLIFE61727 (CONTACT/OWNER)
Alternative names: BITZER FISH HATCHERY, BITZER TROUT HATCHERY
CABOT STATION (15 CABOT ST in MONTAGUE, MA)
Small Quantity Generators, between 100 kg and 1000 kg of hazardous waste/month (Resource Conservation and Recovery Act (tracking hazardous waste)) - notification Organizations: NORTHEAST GENERATION CO CABOT STATION (CONTACT/OPERATOR)
, NORTHEAST GENERATING CO (CONTACT/OWNER)
Alternative names: NORTHEAST GENERATING CO, NORTHEAST GENERATION SERVICES CABOT STA
MONTAGUE HIGHWAY DEPT (AVENUE A in MONTAGUE, MA)
(Resource Conservation and Recovery Act (tracking hazardous waste)) Organizations: TOWN OF MONTAGUE (CONTACT/OWNER)
MA DIVISION OF FISHERIES AND WILDLIFE (324 TURNERS FALLS RD in MONTAGUE, MA)
Conditionally Exempt Small Quantity Generators, less than 100 kg/month of hazardous waste (Resource Conservation and Recovery Act (tracking hazardous waste)) - notification Organizations: BITZER STATE FISH HATCHERY (CONTACT/OPERATOR)
, COMMONWEALTH OF MASS (CONTACT/OWNER)
Alternative names: BITZER STATE FISH HATCHERY
MONTAGUE GARAGE (10 SCHOOL ST in MONTAGUE, MA)
Conditionally Exempt Small Quantity Generators, less than 100 kg/month of hazardous waste (Resource Conservation and Recovery Act (tracking hazardous waste)) - notification Business NAICS classification: GENERAL AUTOMOTIVE REPAIR. Organizations: ANTHONY L MARTINO (CONTACT/OWNER)
Housing units lacking complete plumbing facilities: 0.9% Housing units lacking complete kitchen facilities: 0.8%
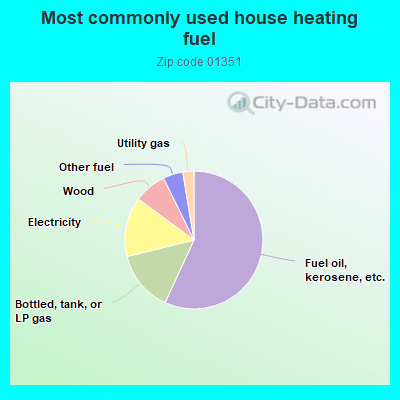
57.0%Fuel oil, kerosene, etc.
14.3%Bottled, tank, or LP gas
14.0%Electricity
7.6%Wood
4.7%Other fuel
2.6%Utility gas
Population in 1990: 1,699. Population change in the 1990s: +650 (+38.3%).
Place of birth for U.S.-born residents:
This state: 2,097
Northeast: 357
Midwest: 72
South: 54
West: 39
65% of the 01351 zip code residents lived in the same house 5 years ago. Out of people who lived in different houses, 58% lived in this county. Out of people who lived in different counties, 50% lived in Massachusetts.
93% of the 01351 zip code residents lived in the same house 1 year ago. Out of people who lived in different houses, 7% moved from this county. Out of people who lived in different houses, 32% moved from different county within same state. Out of people who lived in different houses, 71% moved from different state.
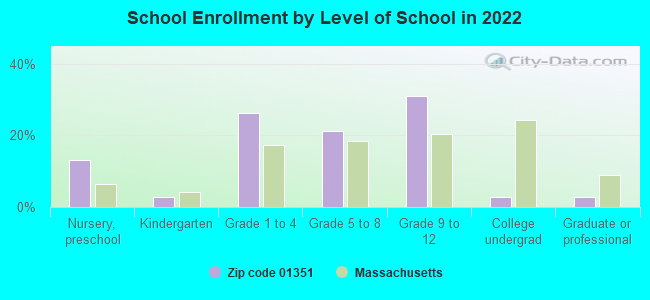
Private vs. public school enrollment:
Students in private schools in grades 1 to 8 (elementary and middle school): 10
Here:
3.9%
Massachusetts:
10.3%
Students in private schools in grades 9 to 12 (high school): 6
Here:
3.6%
Massachusetts:
12.3%
Students in private undergraduate colleges:
Here:
0.0%
Massachusetts:
51.2%
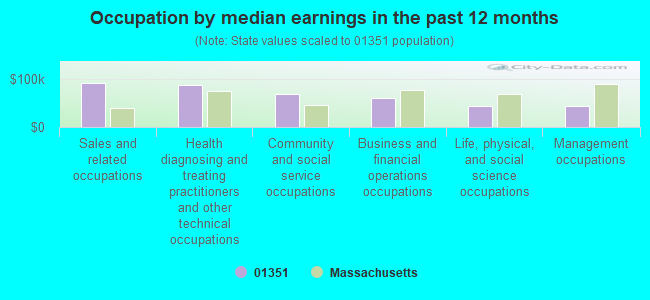
Occupation by median earnings in the past 12 months ($)
92,280Sales and related occupations
87,478Health diagnosing and treating practitioners and other technical occupations
68,798Community and social service occupations
59,870Business and financial operations occupations
45,054Life, physical, and social science occupations
44,908Management occupations
Top industries in this zip code by the number of employees in 2005:
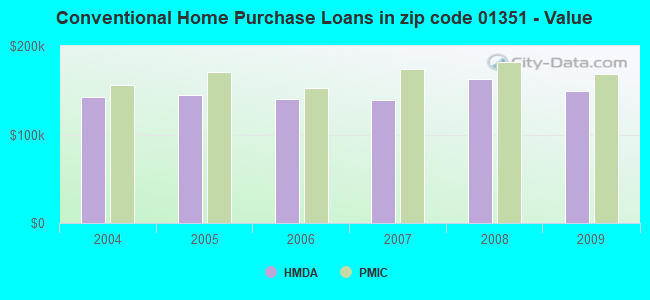
Detailed PMIC statistics for the following Tracts:0407.02
2002 - 2018 National Fire Incident Reporting System (NFIRS) incidents
Based on the data from the years 2002 - 2018 the average number of fires per year is 27. The highest number of fires - 56 took place in 2010, and the least - 8 in 2004. The data has a dropping trend.
When looking into fire subcategories, the most incidents belonged to: Structure Fires (47.7%), and Outside Fires (43.7%).
Fire incident types reported to NFIRS in Zip Code 01351


 Nearest zip codes: 01347, 01349, 01376, 01375, 01054, 01354.


 Based on the data from the years 2002 - 2018 the average number of fires per year is 27. The highest number of fires - 56 took place in 2010, and the least - 8 in 2004. The data has a dropping trend.
 When looking into fire subcategories, the most incidents belonged to: Structure Fires (47.7%), and Outside Fires (43.7%).