Estimated zip code population in 2022: 3,006 Zip code population in 2010: 3,296 Zip code population in 2000: 3,313
Houses and condos: 2,182 Renter-occupied apartments: 92
% of renters here:
6%
State:
38%
March 2022 cost of living index in zip code 02635: 118.8 (more than average, U.S. average is 100)
Land area: 5.5 sq. mi. Water area: 1.1 sq. mi.
Population density: 544 people per square mile
(low).
OSM Map
Google Map
MSN Map
OSM Map
General Map
Google Map
MSN Map
OSM Map
Google Map
MSN Map
OSM Map
Google Map
MSN Map
Please wait while loading the map...
Real estate property taxes paid for housing units in 2022:
This zip code:
0.7% ($4,213)
Massachusetts:
1.0% ($5,536)
Median real estate property taxes paid for housing units with mortgages in 2022: $4,184 (0.7%) Median real estate property taxes paid for housing units with no mortgage in 2022: $4,313 (0.6%)
Business Search- 14 Million verified businesses
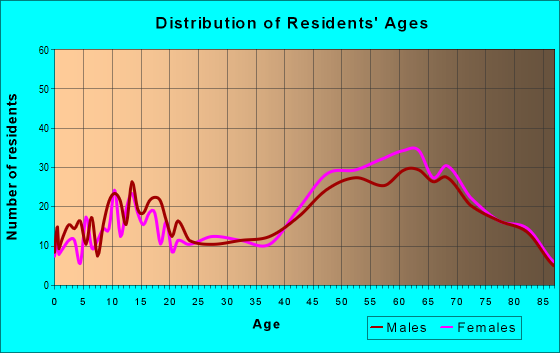
Males: 1,490
(49.6%)
Females: 1,515
(50.4%)
For population 25 years and over in 02635:
High school or higher: 98.6%
Bachelor's degree or higher: 53.8%
Graduate or professional degree: 23.8%
Unemployed: 4.9%
Mean travel time to work (commute): 22.8 minutes
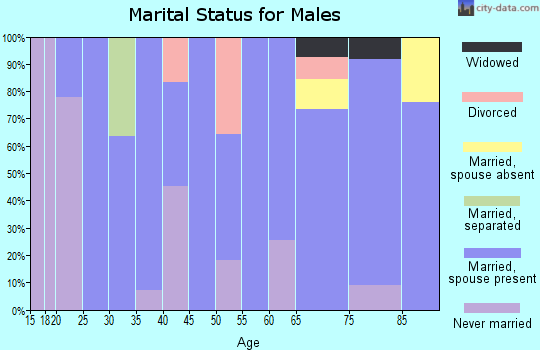
For population 15 years and over in 02635:
Never married: 30.4%
Now married: 52.4%
Separated: 0.4%
Widowed: 5.9%
Divorced: 10.9%
Zip code 02635 compared to state average:
Hispanic race population percentage significantly below state average.
Median age significantly above state average.
Foreign-born population percentage significantly below state average.
Renting percentage significantly below state average.
Length of stay since moving in significantly above state average.
Estimated median house/condo value in 2022: $632,380
02635:
$632,380
Massachusetts:
$534,700
According to our research of Massachusetts and other state lists, there were 2 registered sex offenders living in 02635 zip code as of May 03, 2024. The ratio of all residents to sex offenders in zip code 02635 is 1,768 to 1. The ratio of registered sex offenders to all residents in this zip code is near the state average.
Median resident age:
This zip code:
58.1 years
Massachusetts median age:
40.3 years
Average household size:
This zip code:
2.1 people
Massachusetts:
2.4 people
Averages for the 2020 tax year for zip code 02635, filed in 2021:
Average Adjusted Gross Income (AGI) in 2020: $109,160 (Individual Income Tax Returns)
Here:
$109,160
State:
$105,130
Salary/wage: $81,803 (reported on 67.1% of returns)
Here:
$81,803
State:
$82,951
(% of AGI for various income ranges: 1094.0% for AGIs below $25k, 3294.8% for AGIs $25k-50k, 5814.4% for AGIs $50k-75k, 6877.1% for AGIs $75k-100k, 16063.2% for AGIs $100k-200k, 80072.9% for AGIs over 200k)
Taxable interest for individuals: $2,338 (reported on 50.7% of returns)
This zip code:
$2,338
Massachusetts:
$2,361
(% of AGI for various income ranges: 43.6% for AGIs below $25k, 49.1% for AGIs $25k-50k, 116.1% for AGIs $50k-75k, 210.0% for AGIs $75k-100k, 240.0% for AGIs $100k-200k, 1920.0% for AGIs over 200k)
Ordinary dividends: $13,056 (reported on 39.4% of returns)
Here:
$13,056
State:
$10,365
(% of AGI for various income ranges: 105.6% for AGIs below $25k, 214.8% for AGIs $25k-50k, 392.2% for AGIs $50k-75k, 408.6% for AGIs $75k-100k, 1636.3% for AGIs $100k-200k, 8317.1% for AGIs over 200k)
Net capital gain/loss in AGI: +$24,303 (reported on 36.2% of returns)
Here:
+$24,303
State:
+$48,178
(% of AGI for various income ranges: 14.8% for AGIs below $25k, 70.9% for AGIs $25k-50k, 204.4% for AGIs $50k-75k, 425.7% for AGIs $75k-100k, 1417.4% for AGIs $100k-200k, 21222.9% for AGIs over 200k)
Profit/loss from business: +$27,476 (reported on 19.7% of returns)
Here:
+$27,476
State:
+$20,792
(% of AGI for various income ranges: 259.2% for AGIs below $25k, 343.9% for AGIs $25k-50k, 528.9% for AGIs $50k-75k, 708.6% for AGIs $75k-100k, 1673.7% for AGIs $100k-200k, 7110.0% for AGIs over 200k)
Taxable individual retirement arrangement distribution: $30,524 (reported on 19.7% of returns)
02635:
$30,524
Massachusetts:
$22,790
(% of AGI for various income ranges: 146.8% for AGIs below $25k, 311.3% for AGIs $25k-50k, 421.1% for AGIs $50k-75k, 970.0% for AGIs $75k-100k, 2887.9% for AGIs $100k-200k, 5905.7% for AGIs over 200k)
Self-employed (Keogh) retirement plans: $27,375 (reported on 1.9% of returns)
02635:
$27,375
Massachusetts:
$26,868
(% of AGI for various income ranges: 576.3% for AGIs $100k-200k)
Total itemized deductions: $36,210 (reported on 19.2% of returns)
Here:
$36,210
State:
$36,722
(% of AGI for various income ranges: 340.8% for AGIs below $25k, 416.1% for AGIs $25k-50k, 785.6% for AGIs $50k-75k, 827.1% for AGIs $75k-100k, 1963.2% for AGIs $100k-200k, 9621.4% for AGIs over 200k)
Charity contributions: $11,715 (reported on 15.5% of returns)
Here:
$11,715
State:
$12,529
(% of AGI for various income ranges: 40.0% for AGIs $25k-50k, 61.1% for AGIs $50k-75k, 92.9% for AGIs $75k-100k, 241.1% for AGIs $100k-200k, 4394.3% for AGIs over 200k)
Taxes paid: $8,227 (reported on 19.2% of returns)
02635:
$8,227
State:
$8,782
(% of AGI for various income ranges: 58.0% for AGIs below $25k, 90.4% for AGIs $25k-50k, 230.6% for AGIs $50k-75k, 259.3% for AGIs $75k-100k, 523.2% for AGIs $100k-200k, 1782.9% for AGIs over 200k)
Earned income credit: $1,309 (reported on 5.2% of returns)
Here:
$1,309
State:
$1,909
(% of AGI for various income ranges: 32.0% for AGIs below $25k, 27.8% for AGIs $25k-50k)
Percentage of individuals using paid preparers for their 2020 taxes: 92.0%
Here:
92%
State:
92%
(% for various income ranges: 88.2% for AGIs below $25k, 94.6% for AGIs $25k-50k, 93.5% for AGIs $50k-75k, 95.7% for AGIs $75k-100k, 90.9% for AGIs $100k-200k, 92.6% for AGIs over 200k)
Averages for the 2012 tax year for zip code 02635, filed in 2013:
Average Adjusted Gross Income (AGI) in 2012: $96,678 (Individual Income Tax Returns)
Here:
$96,678
State:
$81,425
Salary/wage: $65,157 (reported on 72.6% of returns)
Here:
$65,157
State:
$64,752
(% of AGI for various income ranges: 61.6% for AGIs below $25k, 61.8% for AGIs $25k-50k, 51.9% for AGIs $50k-75k, 53.5% for AGIs $75k-100k, 58.5% for AGIs $100k-200k, 39.1% for AGIs over 200k)
Taxable interest for individuals: $2,765 (reported on 51.1% of returns)
This zip code:
$2,765
Massachusetts:
$2,136
(% of AGI for various income ranges: 1.6% for AGIs below $25k, 1.4% for AGIs $25k-50k, 1.7% for AGIs $50k-75k, 1.0% for AGIs $75k-100k, 1.1% for AGIs $100k-200k, 1.7% for AGIs over 200k)
Ordinary dividends: $11,601 (reported on 38.4% of returns)
Here:
$11,601
State:
$9,473
(% of AGI for various income ranges: 5.4% for AGIs below $25k, 3.6% for AGIs $25k-50k, 2.4% for AGIs $50k-75k, 4.3% for AGIs $75k-100k, 5.1% for AGIs $100k-200k, 5.0% for AGIs over 200k)
Net capital gain/loss in AGI: +$21,773 (reported on 32.6% of returns)
Here:
+$21,773
State:
+$31,437
(% of AGI for various income ranges: 1.6% for AGIs $25k-50k, 1.0% for AGIs $50k-75k, 1.6% for AGIs $75k-100k, 2.5% for AGIs $100k-200k, 14.2% for AGIs over 200k)
Profit/loss from business: +$22,582 (reported on 21.1% of returns)
Here:
+$22,582
State:
+$20,662
(% of AGI for various income ranges: 10.3% for AGIs below $25k, 5.7% for AGIs $25k-50k, 4.7% for AGIs $50k-75k, 5.7% for AGIs $75k-100k, 5.5% for AGIs $100k-200k, 3.9% for AGIs over 200k)
Taxable individual retirement arrangement distribution: $22,486 (reported on 23.2% of returns)
02635:
$22,486
Massachusetts:
$18,892
(% of AGI for various income ranges: 7.8% for AGIs below $25k, 4.8% for AGIs $25k-50k, 6.7% for AGIs $50k-75k, 6.3% for AGIs $75k-100k, 7.1% for AGIs $100k-200k, 3.9% for AGIs over 200k)
Self-employment retirement plans: $20,433 (reported on 1.6% of returns)
02635:
$20,433
Massachusetts:
$20,669
Total itemized deductions: $34,648 (22% of AGI, reported on 50.5% of returns)
Here:
$34,648
State:
$28,907
Here:
22.0% of AGI
State:
18.2% of AGI
(% of AGI for various income ranges: 32.7% for AGIs below $25k, 15.3% for AGIs $25k-50k, 17.5% for AGIs $50k-75k, 18.8% for AGIs $75k-100k, 18.0% for AGIs $100k-200k, 17.4% for AGIs over 200k)
Charity contributions: $4,887 (reported on 44.2% of returns)
Here:
$4,887
State:
$4,208
(% of AGI for various income ranges: 1.7% for AGIs below $25k, 1.0% for AGIs $25k-50k, 1.2% for AGIs $50k-75k, 1.2% for AGIs $75k-100k, 2.0% for AGIs $100k-200k, 3.0% for AGIs over 200k)
Taxes paid: $16,669 (reported on 50.0% of returns)
02635:
$16,669
State:
$13,303
(% of AGI for various income ranges: 6.5% for AGIs below $25k, 4.6% for AGIs $25k-50k, 6.3% for AGIs $50k-75k, 6.7% for AGIs $75k-100k, 8.1% for AGIs $100k-200k, 10.6% for AGIs over 200k)
Earned income credit: $1,479 (reported on 7.4% of returns)
Here:
$1,479
State:
$1,971
(% of AGI for various income ranges: 2.1% for AGIs below $25k, 0.5% for AGIs $25k-50k)
Percentage of individuals using paid preparers for their 2012 taxes: 63.2%
Here:
63%
State:
56%
(% for various income ranges: 53.4% for AGIs below $25k, 62.9% for AGIs $25k-50k, 63.3% for AGIs $50k-75k, 63.2% for AGIs $75k-100k, 70.6% for AGIs $100k-200k, 85.7% for AGIs over 200k)
Averages for the 2004 tax year for zip code 02635, filed in 2005:
Average Adjusted Gross Income (AGI) in 2004: $80,788 (Individual Income Tax Returns)
Here:
$80,788
State:
$62,877
Salary/wage: $59,690 (reported on 69.4% of returns)
Here:
$59,690
State:
$52,969
(% of AGI for various income ranges: 134.1% for AGIs below $10k, 49.7% for AGIs $10k-25k, 61.8% for AGIs $25k-50k, 54.9% for AGIs $50k-75k, 59.8% for AGIs $75k-100k, 46.6% for AGIs over 100k)
Taxable interest for individuals: $2,449 (reported on 68.5% of returns)
This zip code:
$2,449
Massachusetts:
$1,945
(% of AGI for various income ranges: 10.1% for AGIs below $10k, 5.6% for AGIs $10k-25k, 2.2% for AGIs $25k-50k, 2.2% for AGIs $50k-75k, 2.9% for AGIs $75k-100k, 1.6% for AGIs over 100k)
Taxable dividends: $8,373 (reported on 45.0% of returns)
Here:
$8,373
State:
$5,323
(% of AGI for various income ranges: 10.9% for AGIs below $10k, 4.9% for AGIs $10k-25k, 2.8% for AGIs $25k-50k, 4.0% for AGIs $50k-75k, 4.3% for AGIs $75k-100k, 5.1% for AGIs over 100k)
Net capital gain/loss: +$28,680 (reported on 37.8% of returns)
Here:
+$28,680
State:
+$20,377
(% of AGI for various income ranges: -5.0% for AGIs below $10k, 1.8% for AGIs $10k-25k, 1.0% for AGIs $25k-50k, 2.8% for AGIs $50k-75k, 1.0% for AGIs $75k-100k, 20.6% for AGIs over 100k)
Profit/loss from business: +$24,945 (reported on 23.3% of returns)
Here:
+$24,945
State:
+$17,837
(% of AGI for various income ranges: 18.4% for AGIs below $10k, 13.9% for AGIs $10k-25k, 7.7% for AGIs $25k-50k, 7.0% for AGIs $50k-75k, 7.4% for AGIs $75k-100k, 6.6% for AGIs over 100k)
IRA payment deduction: $3,390 (reported on 4.6% of returns)
02635:
$3,390
Massachusetts:
$3,100
(% of AGI for various income ranges: 2.7% for AGIs below $10k, 0.6% for AGIs $25k-50k, 0.3% for AGIs $50k-75k, 0.2% for AGIs $75k-100k, 0.1% for AGIs over 100k)
Self-employed pension: $16,062 (reported on 2.7% of returns)
Here:
$16,062
Massachusetts:
$14,516
Total itemized deductions: $26,000 (21% of AGI, reported on 54.3% of returns)
Here:
$26,000
State:
$22,573
Here:
20.9% of AGI
State:
19.5% of AGI
(% of AGI for various income ranges: 62.6% for AGIs below $10k, 24.3% for AGIs $10k-25k, 19.6% for AGIs $25k-50k, 20.5% for AGIs $50k-75k, 19.9% for AGIs $75k-100k, 15.2% for AGIs over 100k)
Charity contributions deductions: $4,743 (4% of AGI, reported on 49.8% of returns)
Here:
$4,743
State:
$3,295
Here:
3.6% of AGI
State:
2.7% of AGI
(% of AGI for various income ranges: 2.0% for AGIs below $10k, 1.9% for AGIs $10k-25k, 1.9% for AGIs $25k-50k, 1.9% for AGIs $50k-75k, 2.5% for AGIs $75k-100k, 3.4% for AGIs over 100k)
Total tax: $14,956 (reported on 84.5% of returns)
02635:
$14,956
State:
$11,494
(% of AGI for various income ranges: 5.7% for AGIs below $10k, 5.8% for AGIs $10k-25k, 8.1% for AGIs $25k-50k, 9.4% for AGIs $50k-75k, 10.8% for AGIs $75k-100k, 19.7% for AGIs over 100k)
Earned income credit: $1,167 (reported on 5.7% of returns)
Here:
$1,167
State:
$1,518
Percentage of individuals using paid preparers for their 2004 taxes: 65.3%
Here:
65%
State:
58%
(% for various income ranges: 54.4% for AGIs below $10k, 60.7% for AGIs $10k-25k, 65.7% for AGIs $25k-50k, 67.4% for AGIs $50k-75k, 68.9% for AGIs $75k-100k, 74.7% for AGIs over 100k)
Household received Food Stamps/SNAP in the past 12 months: 40 Household did not receive Food Stamps/SNAP in the past 12 months: 1,371
Women who did not have a birth in the past 12 months: 382 (161 now married, 219 unmarried)
Housing units in zip code 02635 with a mortgage: 758 (111 second mortgage, 12 home equity loan, 83 both second mortgage and home equity loan) Houses without a mortgage: 23
Median monthly owner costs for units with a mortgage: $2,290 Median monthly owner costs for units without a mortgage: $857
Residents with income below the poverty level in 2022:
This zip code:
2.7%
Whole state:
10.4%
Residents with income below 50% of the poverty level in 2022:
This zip code:
1.3%
Whole state:
5.1%
Median number of rooms in houses and condos:
Here:
6.3
State:
6.5
Median number of rooms in apartments:
Here:
5.7
State:
4.0
Notable locations in this zip code not listed on our city pages
In group quarters: 18 (-1 institutionalized population)
Size of family households: 644 2-persons, 123 3-persons, 95 4-persons, 15 5-persons, 16 6-persons
Size of nonfamily households: 444 1-person, 116 2-persons
130 married couples with children.
69 single-parent households (69 women).
95.1% of residents of 02635 zip code speak English at home.
0.4% of residents speak Spanish at home (100% very well).
3.7% of residents speak other Indo-European language at home (65% very well, 35% well).
1.3% of residents speak Asian or Pacific Island language at home (95% very well, 5% well).
Foreign born population: 200 (6.7%) (79.7% of them are naturalized citizens)
This zip code:
6.7%
Whole state:
18.0%
27%Haiti
11%Latvia
10%Croatia
10%Bolivia
21%Irish
16%Italian
13%English
7%European
5%French
4%French Canadian
4%Scottish
Year of entry for the foreign-born population
292010 or later
172000 to 2009
541990 to 1999
88Before 1990
Private elementary/middle school in in this zip code not listed on the city page:
WALDORF SCHOOL OF CAPE COD (Students: 106, Location: 140 OLD OYSTER RD, Grades: PK-8)
Facilities with environmental interests located in this zip code:
MIKES AUTO BODY (505 MAIN ST in COTUIT, MA)
(Resource Conservation and Recovery Act (tracking hazardous waste)) Organizations: MICHAEL MEDEIROS (CONTACT/OWNER)
82.8%Utility gas
15.6%Fuel oil, kerosene, etc.
1.6%Electricity
Population in 1990: 3,266. Population change in the 1990s: +47 (+1.4%).
Place of birth for U.S.-born residents:
This state: 1,834
Northeast: 802
Midwest: 77
South: 63
West: 15
60% of the 02635 zip code residents lived in the same house 5 years ago. Out of people who lived in different houses, 44% lived in this county. Out of people who lived in different counties, 50% lived in Massachusetts.
95% of the 02635 zip code residents lived in the same house 1 year ago. Out of people who lived in different houses, 33% moved from this county. Out of people who lived in different houses, 75% moved from different state.
Private vs. public school enrollment:
Students in private schools in grades 1 to 8 (elementary and middle school): 85
Here:
59.0%
Massachusetts:
10.3%
Students in private schools in grades 9 to 12 (high school): 16
Here:
8.3%
Massachusetts:
12.3%
Students in private undergraduate colleges: 18
Here:
12.5%
Massachusetts:
51.2%
Occupation by median earnings in the past 12 months ($)
122,309Business and financial operations occupations
111,722Architecture and engineering occupations
110,041Management occupations
90,236Computer and mathematical occupations
66,476Health diagnosing and treating practitioners and other technical occupations
60,967Arts, design, entertainment, sports, and media occupations
Top industries in this zip code by the number of employees in 2005:
Health Care and Social Assistance: Child Day Care Services (20-49 employees: 1 establishment, 10-19 employees: 1 establishment)
Finance and Insurance: Savings Institutions (20-49: 1, 5-9: 1)
Accommodation and Food Services: Full-Service Restaurants (20-49: 1, 5-9: 1)
Construction: New Single-Family Housing Construction (except Operative Builders) (10-19: 1, 5-9: 1, 1-4: 3)
Administrative and Support and Waste Management and Remediation Services: Landscaping Services (5-9: 2, 1-4: 3)
Health Care and Social Assistance: Residential Mental Retardation Facilities (10-19: 1)
Other Services (except Public Administration): All Other Personal Services (10-19: 1)
Information: Software Publishers (10-19: 1)
People in group quarters in 2010:
12 people in group homes intended for adults
People in group quarters in 2000:
14 people in homes for the mentally retarded
Fatal accident statistics in 2012:
Fatal accident count: 1
Vehicles involved in fatal accidents: 2
Fatal accidents caused by drunken drivers: 1
Fatalities: 1
Persons involved in fatal accidents: 4
Pedestrians involved in fatal accidents: 0
Fatal accident statistics in 2011:
Fatal accident count: 1
Vehicles involved in fatal accidents: 1
Fatal accidents caused by drunken drivers: 0
Fatalities: 1
Persons involved in fatal accidents: 3
Pedestrians involved in fatal accidents: 0
Home Mortgage Disclosure Act Aggregated Statistics For Year 2009 (Based on 2 partial tracts)
A) FHA, FSA/RHS & VA Home Purchase Loans
B) Conventional Home Purchase Loans
C) Refinancings
D) Home Improvement Loans
F) Non-occupant Loans on < 5 Family Dwellings (A B C & D)
Number
Average Value
Number
Average Value
Number
Average Value
Number
Average Value
Number
Average Value
LOANS ORIGINATED
12
$282,869
44
$233,230
307
$260,540
14
$205,164
93
$292,803
APPLICATIONS APPROVED, NOT ACCEPTED
0
$0
2
$336,935
23
$298,648
2
$13,145
5
$254,492
APPLICATIONS DENIED
1
$365,610
10
$225,339
60
$317,857
6
$198,537
19
$391,957
APPLICATIONS WITHDRAWN
1
$328,570
2
$394,285
43
$259,911
1
$489,870
6
$329,765
FILES CLOSED FOR INCOMPLETENESS
1
$389,500
1
$363,220
20
$252,820
0
$0
5
$270,502
Aggregated Statistics For Year 2008 (Based on 2 partial tracts)
A) FHA, FSA/RHS & VA Home Purchase Loans
B) Conventional Home Purchase Loans
C) Refinancings
D) Home Improvement Loans
F) Non-occupant Loans on < 5 Family Dwellings (A B C & D)
Number
Average Value
Number
Average Value
Number
Average Value
Number
Average Value
Number
Average Value
LOANS ORIGINATED
6
$286,155
55
$343,690
122
$313,557
14
$681,719
59
$482,578
APPLICATIONS APPROVED, NOT ACCEPTED
0
$0
6
$464,378
20
$323,970
4
$229,102
5
$277,910
APPLICATIONS DENIED
0
$0
7
$274,463
25
$402,026
5
$42,774
6
$524,717
APPLICATIONS WITHDRAWN
1
$454,020
7
$212,504
22
$282,299
1
$1,553,240
4
$362,622
FILES CLOSED FOR INCOMPLETENESS
0
$0
1
$346,490
10
$246,248
1
$28,680
1
$310,650
Aggregated Statistics For Year 2007 (Based on 2 partial tracts)
A) FHA, FSA/RHS & VA Home Purchase Loans
B) Conventional Home Purchase Loans
C) Refinancings
D) Home Improvement Loans
F) Non-occupant Loans on < 5 Family Dwellings (A B C & D)
Number
Average Value
Number
Average Value
Number
Average Value
Number
Average Value
Number
Average Value
LOANS ORIGINATED
1
$379,950
75
$378,162
134
$310,024
32
$125,379
44
$365,636
APPLICATIONS APPROVED, NOT ACCEPTED
0
$0
11
$395,479
27
$283,256
2
$164,285
1
$498,230
APPLICATIONS DENIED
1
$379,950
5
$309,214
61
$335,896
12
$129,934
4
$337,530
APPLICATIONS WITHDRAWN
0
$0
7
$298,530
17
$219,843
1
$238,960
4
$357,842
FILES CLOSED FOR INCOMPLETENESS
0
$0
0
$0
8
$381,440
1
$463,580
0
$0
Aggregated Statistics For Year 2006 (Based on 2 partial tracts)
A) FHA, FSA/RHS & VA Home Purchase Loans
B) Conventional Home Purchase Loans
C) Refinancings
D) Home Improvement Loans
F) Non-occupant Loans on < 5 Family Dwellings (A B C & D)
Number
Average Value
Number
Average Value
Number
Average Value
Number
Average Value
Number
Average Value
LOANS ORIGINATED
4
$279,285
97
$306,349
204
$307,895
39
$166,629
59
$485,048
APPLICATIONS APPROVED, NOT ACCEPTED
0
$0
4
$179,818
22
$217,290
10
$110,997
5
$200,726
APPLICATIONS DENIED
0
$0
30
$320,087
75
$295,880
13
$477,093
7
$738,386
APPLICATIONS WITHDRAWN
0
$0
7
$380,629
70
$359,293
4
$206,102
4
$561,555
FILES CLOSED FOR INCOMPLETENESS
0
$0
6
$245,730
13
$715,685
0
$0
1
$507,790
Aggregated Statistics For Year 2005 (Based on 2 partial tracts)
A) FHA, FSA/RHS & VA Home Purchase Loans
B) Conventional Home Purchase Loans
C) Refinancings
D) Home Improvement Loans
F) Non-occupant Loans on < 5 Family Dwellings (A B C & D)
G) Loans On Manufactured Home Dwelling (A B C & D)
Number
Average Value
Number
Average Value
Number
Average Value
Number
Average Value
Number
Average Value
Number
Average Value
LOANS ORIGINATED
1
$327,380
124
$320,659
249
$300,615
39
$131,949
74
$458,093
0
$0
APPLICATIONS APPROVED, NOT ACCEPTED
0
$0
11
$344,428
22
$322,325
10
$86,384
4
$678,050
0
$0
APPLICATIONS DENIED
0
$0
13
$275,264
35
$260,125
10
$127,724
5
$411,250
1
$221,040
APPLICATIONS WITHDRAWN
0
$0
24
$285,159
73
$237,552
8
$261,661
10
$412,087
0
$0
FILES CLOSED FOR INCOMPLETENESS
0
$0
1
$627,270
18
$306,400
2
$35,845
4
$396,672
0
$0
Aggregated Statistics For Year 2004 (Based on 2 partial tracts)
A) FHA, FSA/RHS & VA Home Purchase Loans
B) Conventional Home Purchase Loans
C) Refinancings
D) Home Improvement Loans
F) Non-occupant Loans on < 5 Family Dwellings (A B C & D)
Number
Average Value
Number
Average Value
Number
Average Value
Number
Average Value
Number
Average Value
LOANS ORIGINATED
0
$0
118
$365,366
286
$274,190
29
$207,978
87
$443,724
APPLICATIONS APPROVED, NOT ACCEPTED
0
$0
14
$306,125
47
$228,537
6
$98,770
4
$166,972
APPLICATIONS DENIED
1
$338,130
20
$302,404
68
$266,071
10
$225,817
4
$565,440
APPLICATIONS WITHDRAWN
0
$0
14
$305,442
81
$232,927
10
$85,548
6
$195,548
FILES CLOSED FOR INCOMPLETENESS
0
$0
2
$243,740
16
$228,506
1
$280,780
0
$0
Aggregated Statistics For Year 2003 (Based on 2 partial tracts)
A) FHA, FSA/RHS & VA Home Purchase Loans
B) Conventional Home Purchase Loans
C) Refinancings
D) Home Improvement Loans
F) Non-occupant Loans on < 5 Family Dwellings (A B C & D)
Number
Average Value
Number
Average Value
Number
Average Value
Number
Average Value
Number
Average Value
LOANS ORIGINATED
2
$253,895
108
$416,620
803
$231,705
7
$70,323
143
$328,486
APPLICATIONS APPROVED, NOT ACCEPTED
0
$0
17
$257,374
62
$198,028
6
$82,242
10
$222,113
APPLICATIONS DENIED
0
$0
20
$437,655
106
$196,567
14
$58,460
20
$464,718
APPLICATIONS WITHDRAWN
1
$309,450
6
$258,475
91
$209,904
4
$29,870
8
$249,415
FILES CLOSED FOR INCOMPLETENESS
0
$0
2
$347,090
13
$254,676
0
$0
2
$363,815
Aggregated Statistics For Year 2002 (Based on 2 partial tracts)
A) FHA, FSA/RHS & VA Home Purchase Loans
B) Conventional Home Purchase Loans
C) Refinancings
D) Home Improvement Loans
F) Non-occupant Loans on < 5 Family Dwellings (A B C & D)
Number
Average Value
Number
Average Value
Number
Average Value
Number
Average Value
Number
Average Value
LOANS ORIGINATED
4
$197,740
127
$274,870
596
$207,348
25
$61,174
115
$390,315
APPLICATIONS APPROVED, NOT ACCEPTED
0
$0
10
$244,576
50
$159,816
7
$31,064
6
$250,310
APPLICATIONS DENIED
0
$0
12
$164,086
55
$177,526
7
$66,567
5
$239,676
APPLICATIONS WITHDRAWN
0
$0
6
$324,587
69
$197,367
6
$95,783
10
$239,438
FILES CLOSED FOR INCOMPLETENESS
0
$0
1
$284,360
8
$239,109
1
$11,950
1
$88,420
Aggregated Statistics For Year 2001 (Based on 2 partial tracts)
A) FHA, FSA/RHS & VA Home Purchase Loans
B) Conventional Home Purchase Loans
C) Refinancings
D) Home Improvement Loans
E) Loans on Dwellings For 5+ Families
F) Non-occupant Loans on < 5 Family Dwellings (A B C & D)
Number
Average Value
Number
Average Value
Number
Average Value
Number
Average Value
Number
Average Value
Number
Average Value
LOANS ORIGINATED
7
$157,373
110
$199,673
421
$197,874
19
$53,766
1
$88,420
75
$308,051
APPLICATIONS APPROVED, NOT ACCEPTED
1
$201,920
12
$211,579
38
$191,608
11
$40,624
0
$0
6
$430,527
APPLICATIONS DENIED
0
$0
6
$230,995
32
$171,827
10
$50,421
0
$0
5
$305,630
APPLICATIONS WITHDRAWN
0
$0
8
$202,519
49
$169,296
2
$67,505
0
$0
4
$224,920
FILES CLOSED FOR INCOMPLETENESS
0
$0
0
$0
10
$126,768
2
$77,065
0
$0
0
$0
Aggregated Statistics For Year 2000 (Based on 2 partial tracts)
A) FHA, FSA/RHS & VA Home Purchase Loans
B) Conventional Home Purchase Loans
C) Refinancings
D) Home Improvement Loans
F) Non-occupant Loans on < 5 Family Dwellings (A B C & D)
Number
Average Value
Number
Average Value
Number
Average Value
Number
Average Value
Number
Average Value
LOANS ORIGINATED
2
$186,985
106
$321,345
114
$149,874
19
$84,076
44
$402,159
APPLICATIONS APPROVED, NOT ACCEPTED
0
$0
7
$259,271
23
$96,831
10
$37,039
1
$53,770
APPLICATIONS DENIED
0
$0
11
$706,344
36
$114,601
18
$29,206
2
$3,092,740
APPLICATIONS WITHDRAWN
0
$0
8
$244,785
38
$118,505
1
$51,380
2
$532,880
FILES CLOSED FOR INCOMPLETENESS
0
$0
4
$169,662
2
$250,310
1
$46,600
1
$181,610
Aggregated Statistics For Year 1999 (Based on 1 partial tract)
A) FHA, FSA/RHS & VA Home Purchase Loans
B) Conventional Home Purchase Loans
C) Refinancings
D) Home Improvement Loans
F) Non-occupant Loans on < 5 Family Dwellings (A B C & D)
Detailed PMIC statistics for the following Tracts:0132.00
2002 - 2018 National Fire Incident Reporting System (NFIRS) incidents
Based on the data from the years 2002 - 2018 the average number of fire incidents per year is 7. The highest number of fire incidents - 21 took place in 2016, and the least - 1 in 2002. The data has an increasing trend.
When looking into fire subcategories, the most reports belonged to: Structure Fires (63.0%), and Outside Fires (24.4%).
Fire incident types reported to NFIRS in Zip Code 02635


 Nearest zip codes: 02655, 02649, 02648, 02644, 02632, 02537.


 (Students: 106, Location: 140 OLD OYSTER RD, Grades: PK-8)


 Based on the data from the years 2002 - 2018 the average number of fire incidents per year is 7. The highest number of fire incidents - 21 took place in 2016, and the least - 1 in 2002. The data has an increasing trend.
 When looking into fire subcategories, the most reports belonged to: Structure Fires (63.0%), and Outside Fires (24.4%).