Estimated zip code population in 2022: 3,838 Zip code population in 2010: 3,515 Zip code population in 2000: 3,218
Houses and condos: 1,438 Renter-occupied apartments: 144
% of renters here:
10%
State:
37%
March 2022 cost of living index in zip code 02831: 91.7 (less than average, U.S. average is 100)
Land area: 9.6 sq. mi. Water area: 2.8 sq. mi.
Population density: 399 people per square mile
(very low).
OSM Map
Google Map
MSN Map
OSM Map
General Map
Google Map
MSN Map
OSM Map
Google Map
MSN Map
OSM Map
Google Map
MSN Map
Please wait while loading the map...
Real estate property taxes paid for housing units in 2022:
This zip code:
1.2% ($5,738)
Rhode Island:
1.2% ($4,726)
Median real estate property taxes paid for housing units with mortgages in 2022: $6,581 (1.3%) Median real estate property taxes paid for housing units with no mortgage in 2022: $3,831 (1.0%)
Business Search- 14 Million verified businesses
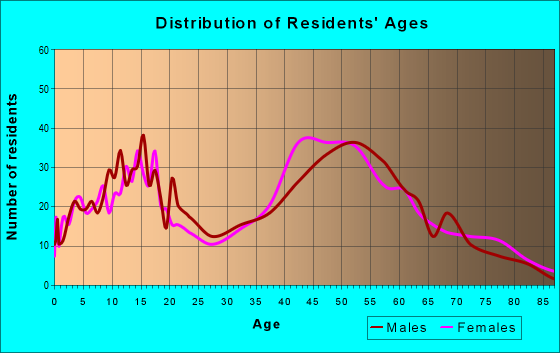
Males: 2,036
(53.1%)
Females: 1,800
(46.9%)
For population 25 years and over in 02831:
High school or higher: 97.4%
Bachelor's degree or higher: 36.9%
Graduate or professional degree: 8.9%
Unemployed: 1.8%
Mean travel time to work (commute): 32.5 minutes
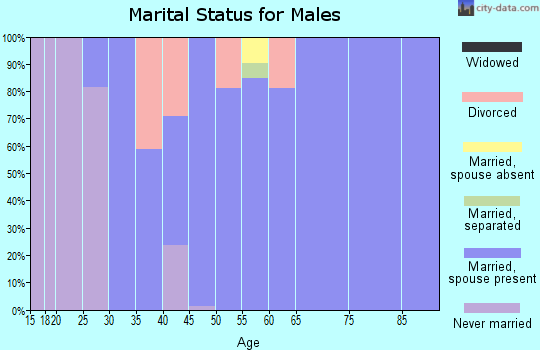
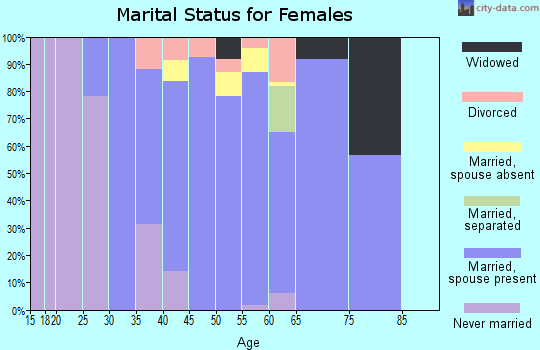
For population 15 years and over in 02831:
Never married: 31.7%
Now married: 53.1%
Separated: 0.0%
Widowed: 8.6%
Divorced: 6.6%
Zip code 02831 compared to state average:
Median household income above state average.
Unemployed percentage below state average.
Black race population percentage significantly below state average.
Hispanic race population percentage significantly below state average.
Foreign-born population percentage significantly below state average.
Renting percentage significantly below state average.
Estimated median house/condo value in 2022: $461,665
02831:
$461,665
Rhode Island:
$383,900
According to our research of Rhode Island and other state lists, there was 1 registered sex offender living in 02831 zip code as of April 28, 2024. The ratio of all residents to sex offenders in zip code 02831 is 3,485 to 1. The ratio of registered sex offenders to all residents in this zip code is much lower than the state average.
Median resident age:
This zip code:
39.5 years
Rhode Island median age:
40.7 years
Average household size:
This zip code:
2.7 people
Rhode Island:
2.4 people
Averages for the 2020 tax year for zip code 02831, filed in 2021:
Average Adjusted Gross Income (AGI) in 2020: $91,739 (Individual Income Tax Returns)
Here:
$91,739
State:
$74,300
Salary/wage: $75,558 (reported on 83.3% of returns)
Here:
$75,558
State:
$60,330
(% of AGI for various income ranges: 1216.1% for AGIs below $25k, 3705.9% for AGIs $25k-50k, 6155.0% for AGIs $50k-75k, 9448.2% for AGIs $75k-100k, 19862.9% for AGIs $100k-200k, 77896.0% for AGIs over 200k)
Taxable interest for individuals: $1,709 (reported on 39.6% of returns)
This zip code:
$1,709
Rhode Island:
$1,971
(% of AGI for various income ranges: 35.3% for AGIs below $25k, 36.7% for AGIs $25k-50k, 45.8% for AGIs $50k-75k, 40.0% for AGIs $75k-100k, 159.3% for AGIs $100k-200k, 1308.0% for AGIs over 200k)
Ordinary dividends: $7,406 (reported on 23.9% of returns)
Here:
$7,406
State:
$7,621
(% of AGI for various income ranges: 31.4% for AGIs below $25k, 37.0% for AGIs $25k-50k, 80.4% for AGIs $50k-75k, 127.1% for AGIs $75k-100k, 266.8% for AGIs $100k-200k, 5112.0% for AGIs over 200k)
Net capital gain/loss in AGI: +$18,781 (reported on 21.6% of returns)
Here:
+$18,781
State:
+$26,041
(% of AGI for various income ranges: 40.7% for AGIs $25k-50k, 98.8% for AGIs $50k-75k, 89.4% for AGIs $75k-100k, 741.4% for AGIs $100k-200k, 12892.0% for AGIs over 200k)
Profit/loss from business: +$17,491 (reported on 15.8% of returns)
Here:
+$17,491
State:
+$15,775
(% of AGI for various income ranges: 84.7% for AGIs below $25k, 303.7% for AGIs $25k-50k, 233.8% for AGIs $50k-75k, 467.6% for AGIs $75k-100k, 465.0% for AGIs $100k-200k, 4678.0% for AGIs over 200k)
Taxable individual retirement arrangement distribution: $17,470 (reported on 10.4% of returns)
02831:
$17,470
Rhode Island:
$18,801
(% of AGI for various income ranges: 59.4% for AGIs below $25k, 126.3% for AGIs $25k-50k, 328.8% for AGIs $50k-75k, 258.8% for AGIs $75k-100k, 797.9% for AGIs $100k-200k)
Total itemized deductions: $27,580 (reported on 11.3% of returns)
Here:
$27,580
State:
$29,550
(% of AGI for various income ranges: 282.6% for AGIs $25k-50k, 355.0% for AGIs $50k-75k, 585.9% for AGIs $75k-100k, 771.8% for AGIs $100k-200k, 4246.0% for AGIs over 200k)
Charity contributions: $5,400 (reported on 8.6% of returns)
Here:
$5,400
State:
$7,826
(% of AGI for various income ranges: 54.2% for AGIs $50k-75k, 32.4% for AGIs $75k-100k, 128.6% for AGIs $100k-200k, 962.0% for AGIs over 200k)
Taxes paid: $9,156 (reported on 11.3% of returns)
02831:
$9,156
State:
$8,398
(% of AGI for various income ranges: 80.0% for AGIs $25k-50k, 118.3% for AGIs $50k-75k, 215.9% for AGIs $75k-100k, 302.9% for AGIs $100k-200k, 1148.0% for AGIs over 200k)
Earned income credit: $1,757 (reported on 6.3% of returns)
Here:
$1,757
State:
$2,059
(% of AGI for various income ranges: 45.3% for AGIs below $25k, 30.7% for AGIs $25k-50k)
Percentage of individuals using paid preparers for their 2020 taxes: 91.9%
Here:
92%
State:
94%
(% for various income ranges: 91.2% for AGIs below $25k, 92.1% for AGIs $25k-50k, 93.9% for AGIs $50k-75k, 92.0% for AGIs $75k-100k, 92.2% for AGIs $100k-200k, 88.9% for AGIs over 200k)
Averages for the 2012 tax year for zip code 02831, filed in 2013:
Average Adjusted Gross Income (AGI) in 2012: $76,762 (Individual Income Tax Returns)
Here:
$76,762
State:
$60,628
Salary/wage: $62,390 (reported on 85.6% of returns)
Here:
$62,390
State:
$50,029
(% of AGI for various income ranges: 75.7% for AGIs below $25k, 75.2% for AGIs $25k-50k, 72.7% for AGIs $50k-75k, 77.9% for AGIs $75k-100k, 81.5% for AGIs $100k-200k, 51.4% for AGIs over 200k)
Taxable interest for individuals: $2,820 (reported on 45.8% of returns)
This zip code:
$2,820
Rhode Island:
$1,640
(% of AGI for various income ranges: 1.3% for AGIs below $25k, 0.9% for AGIs $25k-50k, 0.9% for AGIs $50k-75k, 0.7% for AGIs $75k-100k, 0.5% for AGIs $100k-200k, 3.7% for AGIs over 200k)
Ordinary dividends: $4,502 (reported on 27.9% of returns)
Here:
$4,502
State:
$6,396
(% of AGI for various income ranges: 2.0% for AGIs below $25k, 0.5% for AGIs $25k-50k, 1.5% for AGIs $50k-75k, 1.6% for AGIs $75k-100k, 0.9% for AGIs $100k-200k, 2.7% for AGIs over 200k)
Net capital gain/loss in AGI: +$6,923 (reported on 19.4% of returns)
Here:
+$6,923
State:
+$15,680
(% of AGI for various income ranges: 0.1% for AGIs $75k-100k, 0.6% for AGIs $100k-200k, 4.9% for AGIs over 200k)
Profit/loss from business: +$14,212 (reported on 16.4% of returns)
Here:
+$14,212
State:
+$15,678
(% of AGI for various income ranges: 8.7% for AGIs below $25k, 5.3% for AGIs $25k-50k, 3.7% for AGIs $50k-75k, 2.8% for AGIs $75k-100k, 2.4% for AGIs $100k-200k, 2.0% for AGIs over 200k)
Taxable individual retirement arrangement distribution: $12,086 (reported on 10.4% of returns)
02831:
$12,086
Rhode Island:
$14,081
(% of AGI for various income ranges: 3.1% for AGIs below $25k, 2.1% for AGIs $25k-50k, 3.7% for AGIs $50k-75k, 2.4% for AGIs $75k-100k, 1.9% for AGIs $100k-200k)
Self-employment retirement plans: $16,800 (reported on 1.0% of returns)
02831:
$16,800
Rhode Island:
$18,642
Total itemized deductions: $24,927 (19% of AGI, reported on 46.3% of returns)
Here:
$24,927
State:
$24,445
Here:
19.0% of AGI
State:
20.5% of AGI
(% of AGI for various income ranges: 14.3% for AGIs below $25k, 14.3% for AGIs $25k-50k, 17.6% for AGIs $50k-75k, 16.8% for AGIs $75k-100k, 17.8% for AGIs $100k-200k, 11.1% for AGIs over 200k)
Charity contributions: $2,311 (reported on 40.8% of returns)
Here:
$2,311
State:
$2,961
(% of AGI for various income ranges: 0.6% for AGIs below $25k, 0.9% for AGIs $25k-50k, 1.2% for AGIs $50k-75k, 1.4% for AGIs $75k-100k, 1.5% for AGIs $100k-200k, 1.1% for AGIs over 200k)
Taxes paid: $12,786 (reported on 46.3% of returns)
02831:
$12,786
State:
$11,235
(% of AGI for various income ranges: 4.2% for AGIs below $25k, 5.3% for AGIs $25k-50k, 7.4% for AGIs $50k-75k, 7.9% for AGIs $75k-100k, 8.9% for AGIs $100k-200k, 7.8% for AGIs over 200k)
Earned income credit: $1,917 (reported on 9.0% of returns)
Here:
$1,917
State:
$2,170
(% of AGI for various income ranges: 3.5% for AGIs below $25k, 0.6% for AGIs $25k-50k)
Percentage of individuals using paid preparers for their 2012 taxes: 63.2%
Here:
63%
State:
60%
(% for various income ranges: 52.2% for AGIs below $25k, 57.5% for AGIs $25k-50k, 74.1% for AGIs $50k-75k, 71.4% for AGIs $75k-100k, 72.2% for AGIs $100k-200k, 80.0% for AGIs over 200k)
Averages for the 2004 tax year for zip code 02831, filed in 2005:
Average Adjusted Gross Income (AGI) in 2004: $66,444 (Individual Income Tax Returns)
Here:
$66,444
State:
$51,090
Salary/wage: $56,246 (reported on 87.2% of returns)
Here:
$56,246
State:
$43,690
(% of AGI for various income ranges: 148.9% for AGIs below $10k, 70.1% for AGIs $10k-25k, 83.7% for AGIs $25k-50k, 80.5% for AGIs $50k-75k, 84.4% for AGIs $75k-100k, 65.7% for AGIs over 100k)
Taxable interest for individuals: $1,848 (reported on 65.9% of returns)
This zip code:
$1,848
Rhode Island:
$1,567
(% of AGI for various income ranges: 11.0% for AGIs below $10k, 3.9% for AGIs $10k-25k, 1.2% for AGIs $25k-50k, 1.6% for AGIs $50k-75k, 1.0% for AGIs $75k-100k, 2.0% for AGIs over 100k)
Taxable dividends: $2,401 (reported on 32.9% of returns)
Here:
$2,401
State:
$3,896
(% of AGI for various income ranges: 4.6% for AGIs below $10k, 1.4% for AGIs $10k-25k, 0.9% for AGIs $25k-50k, 0.8% for AGIs $50k-75k, 0.6% for AGIs $75k-100k, 1.5% for AGIs over 100k)
Net capital gain/loss: +$9,975 (reported on 25.6% of returns)
Here:
+$9,975
State:
+$15,829
(% of AGI for various income ranges: -1.3% for AGIs below $10k, -1.2% for AGIs $10k-25k, -0.2% for AGIs $25k-50k, 1.1% for AGIs $50k-75k, 0.8% for AGIs $75k-100k, 6.9% for AGIs over 100k)
Profit/loss from business: +$17,724 (reported on 15.7% of returns)
Here:
+$17,724
State:
+$15,557
(% of AGI for various income ranges: 14.4% for AGIs below $10k, 8.4% for AGIs $10k-25k, 5.1% for AGIs $25k-50k, 2.3% for AGIs $50k-75k, 4.1% for AGIs $75k-100k, 4.1% for AGIs over 100k)
IRA payment deduction: $3,425 (reported on 4.2% of returns)
02831:
$3,425
Rhode Island:
$3,092
(% of AGI for various income ranges: 2.5% for AGIs below $10k, 0.8% for AGIs $25k-50k, 0.2% for AGIs $75k-100k, 0.2% for AGIs over 100k)
Self-employed pension: $15,188 (reported on 0.8% of returns)
Here:
$15,188
Rhode Island:
$14,597
Total itemized deductions: $20,759 (19% of AGI, reported on 50.9% of returns)
Here:
$20,759
State:
$20,228
Here:
19.4% of AGI
State:
21.1% of AGI
(% of AGI for various income ranges: 22.4% for AGIs below $10k, 13.6% for AGIs $10k-25k, 14.1% for AGIs $25k-50k, 18.5% for AGIs $50k-75k, 20.4% for AGIs $75k-100k, 14.2% for AGIs over 100k)
Charity contributions deductions: $2,095 (2% of AGI, reported on 47.9% of returns)
Here:
$2,095
State:
$2,620
Here:
1.9% of AGI
State:
2.6% of AGI
(% of AGI for various income ranges: 1.2% for AGIs $10k-25k, 1.0% for AGIs $25k-50k, 1.4% for AGIs $50k-75k, 1.9% for AGIs $75k-100k, 1.6% for AGIs over 100k)
Total tax: $11,206 (reported on 82.6% of returns)
02831:
$11,206
State:
$8,437
(% of AGI for various income ranges: 4.4% for AGIs below $10k, 5.1% for AGIs $10k-25k, 7.7% for AGIs $25k-50k, 8.6% for AGIs $50k-75k, 9.6% for AGIs $75k-100k, 19.0% for AGIs over 100k)
Earned income credit: $1,192 (reported on 6.9% of returns)
Here:
$1,192
State:
$1,659
Percentage of individuals using paid preparers for their 2004 taxes: 62.6%
Here:
63%
State:
63%
(% for various income ranges: 48.7% for AGIs below $10k, 56.1% for AGIs $10k-25k, 62.4% for AGIs $25k-50k, 72.2% for AGIs $50k-75k, 69.1% for AGIs $75k-100k, 69.8% for AGIs over 100k)
Likely homosexual households (counted as self-reported same-sex unmarried-partner households)
Lesbian couples: 0.0% of all households
Gay men: 1.4% of all households
Household received Food Stamps/SNAP in the past 12 months: 46 Household did not receive Food Stamps/SNAP in the past 12 months: 1,359
Women who had a birth in the past 12 months: 144 (69 now married, 73 unmarried) Women who did not have a birth in the past 12 months: 587 (313 now married, 277 unmarried)
Housing units in zip code 02831 with a mortgage: 684 (285 second mortgage, 286 both second mortgage and home equity loan) Houses without a mortgage: 10
Median monthly owner costs for units with a mortgage: $2,357 Median monthly owner costs for units without a mortgage: $852
Residents with income below the poverty level in 2022:
This zip code:
3.1%
Whole state:
10.8%
Residents with income below 50% of the poverty level in 2022:
This zip code:
2.2%
Whole state:
5.6%
Median number of rooms in houses and condos:
Here:
7.4
State:
6.2
Median number of rooms in apartments:
Here:
6.6
State:
4.1
Notable locations in this zip code not listed on our city pages
Notable locations in zip code 02831: Crazy Corners (A), Hazard Brothers Orchard (B), Hazards Indian Rock Orchard (C), Hope Library (D), Scituate Police Department (E), Hope - Jackson Fire Department (F). Display/hide their locations on the map
Reservoirs and swamps: Pawtuxet River (A), Scituate Reservoir (B), John L Curran Lower Reservoir (C), Pine Swamp (D). Display/hide their locations on the map
Streams, rivers, and creeks: Cork Brook (A), Burlingame Brook (B), Clarke Brook (C), Cranberry Brook (D), Colvin Brook (E). Display/hide their locations on the map
In group quarters: 40 (-1 institutionalized population)
Size of family households: 309 2-persons, 228 3-persons, 315 4-persons, 64 5-persons, 16 6-persons
Size of nonfamily households: 310 1-person, 121 2-persons, 17 3-persons
616 married couples with children.
353 single-parent households (198 men, 155 women).
96.2% of residents of 02831 zip code speak English at home.
0.6% of residents speak Spanish at home (45% very well, 55% well).
2.3% of residents speak other Indo-European language at home (100% very well).
1.1% of residents speak Asian or Pacific Island language at home (100% very well).
Foreign born population: 66 (1.7%) (100.0% of them are naturalized citizens)
This zip code:
1.7%
Whole state:
14.4%
69%Italy
25%Bhutan
34%Italian
14%Portuguese
13%American
12%Irish
5%French Canadian
4%English
3%Polish
Year of entry for the foreign-born population
02010 or later
92000 to 2009
321990 to 1999
23Before 1990
Facilities with environmental interests located in this zip code:
FALVEY LINEN SUPPLY INC (81 JACKSON FLAT RD in HOPE, RI)
(Integrated Compliance Information System) - ICIS-01-1975-0002, FORMAL ENFORCEMENT ACTION (Resource Conservation and Recovery Act (tracking hazardous waste)) Business SIC classification: LINEN SUPPLY Organizations: OWNERNAME (CONTACT/OWNER)
HOPE SCHOOL (391 NORTH ROAD in HOPE, RI)
(National Center for Education Statistics) - STATE ID-30102 Organizations: SCITUATE SCH DIST (SCHOOL DISTRICT)
EDS AUTO REPAIR (80 JACKSON FLAT RD in SCITUATE, RI)
(Resource Conservation and Recovery Act (tracking hazardous waste)) Organizations: GLEN M BJORKLUND (CONTACT/OWNER)
, DENIS DECORDO (CONTACT/OWNER)
Alternative names: BJORKLUNDS AUTO
HOPE SERVICE STATION INC (1 HOPE AVE in HOPE, RI)
(Resource Conservation and Recovery Act (tracking hazardous waste)) Business NAICS classification: OTHER AUTOMOTIVE MECHANICAL AND ELECTRICAL REPAIR AND MAINTENANCE. Organizations: SAMUEL BROWN (CONTACT/OWNER)
HOPE TOWN DUMP (HOPE FURNACE ROAD in SCITUATE, RI)
SUPERFUND (Superfund database)
JUST-A-STRETCH OF RI, INC. (1 MAIN ST in SCITUATE, RI)
CRITERIA AND HAZARDOUS AIR POLLUTANT INVENTORY (Inventory of air pollution sources) Business SIC classification: NARROW FABRIC AND OTHER SMALLWARES MILLS: COTTON, WOOL, SILK, AND MANMADE FIBER
Housing units lacking complete plumbing facilities: 2.8% Housing units lacking complete kitchen facilities: 2.9%
73.5%Fuel oil, kerosene, etc.
9.5%Utility gas
7.2%Bottled, tank, or LP gas
5.3%Wood
4.6%Electricity
Population in 1990: 3,653.
Place of birth for U.S.-born residents:
This state: 3,036
Northeast: 404
Midwest: 20
South: 119
West: 58
67% of the 02831 zip code residents lived in the same house 5 years ago. Out of people who lived in different houses, 63% lived in this county. Out of people who lived in different counties, 50% lived in Rhode Island.
95% of the 02831 zip code residents lived in the same house 1 year ago. Out of people who lived in different houses, 39% moved from this county. Out of people who lived in different houses, 40% moved from different county within same state. Out of people who lived in different houses, 19% moved from different state.
Private vs. public school enrollment:
Students in private schools in grades 1 to 8 (elementary and middle school): 61
Here:
14.2%
Rhode Island:
12.2%
Students in private schools in grades 9 to 12 (high school): 32
Here:
16.1%
Rhode Island:
11.6%
Students in private undergraduate colleges: 14
Here:
17.8%
Rhode Island:
41.1%
Occupation by median earnings in the past 12 months ($)
107,993Management occupations
90,249Sales and related occupations
84,691Health diagnosing and treating practitioners and other technical occupations
78,095Construction and extraction occupations
76,681Education, training, and library occupations
65,016Production occupations
Companies with federal contracts located in this zip code:
AUDET MILLWRIGHT CO (9 PINE KNOLL DR in HOPE, RI; small business)
$5,910 with Navy for Maintenance, Repair or Alteration of Real Property -- Highways, Roads, Streets, Bridges, and Railways (includes resurfacing). Taking place in CT. Signed on 2003-09-30. Completion date: 2003-11-15.
Top industries in this zip code by the number of employees in 2005:
Health Care and Social Assistance: Nursing Care Facilities (50-99 employees: 1 establishment)
Educational Services: Elementary and Secondary Schools (10-19: 1)
Health Care and Social Assistance: Residential Mental Retardation Facilities (10-19: 1)
Information: Libraries and Archives (10-19: 1)
Construction: Site Preparation Contractors (5-9: 1, 1-4: 4)
Professional, Scientific, and Technical Services: Veterinary Services (10-19: 1)
Administrative and Support and Waste Management and Remediation Services: Janitorial Services (5-9: 1, 1-4: 2)
People in group quarters in 2010:
4 people in group homes intended for adults
People in group quarters in 2000:
9 people in homes for the mentally retarded
Fatal accident statistics in 2013:
Fatal accident count: 1
Vehicles involved in fatal accidents: 2
Fatal accidents caused by drunken drivers: 0
Fatalities: 1
Persons involved in fatal accidents: 2
Pedestrians involved in fatal accidents: 0
Fatal accident statistics in 2011:
Fatal accident count: 1
Vehicles involved in fatal accidents: 1
Fatal accidents caused by drunken drivers: 0
Fatalities: 1
Persons involved in fatal accidents: 2
Pedestrians involved in fatal accidents: 0
Home Mortgage Disclosure Act Aggregated Statistics For Year 2009 (Based on 4 partial tracts)
A) FHA, FSA/RHS & VA Home Purchase Loans
B) Conventional Home Purchase Loans
C) Refinancings
D) Home Improvement Loans
F) Non-occupant Loans on < 5 Family Dwellings (A B C & D)
G) Loans On Manufactured Home Dwelling (A B C & D)
Number
Average Value
Number
Average Value
Number
Average Value
Number
Average Value
Number
Average Value
Number
Average Value
LOANS ORIGINATED
5
$208,020
10
$242,749
95
$189,875
8
$74,555
1
$176,110
0
$0
APPLICATIONS APPROVED, NOT ACCEPTED
0
$0
0
$0
7
$250,524
1
$83,040
0
$0
0
$0
APPLICATIONS DENIED
1
$44,180
1
$202,020
18
$253,648
2
$105,110
0
$0
0
$0
APPLICATIONS WITHDRAWN
1
$265,300
3
$217,997
11
$231,873
0
$0
1
$90,870
1
$104,830
FILES CLOSED FOR INCOMPLETENESS
0
$0
0
$0
4
$297,972
0
$0
0
$0
0
$0
Aggregated Statistics For Year 2008 (Based on 4 partial tracts)
A) FHA, FSA/RHS & VA Home Purchase Loans
B) Conventional Home Purchase Loans
C) Refinancings
D) Home Improvement Loans
F) Non-occupant Loans on < 5 Family Dwellings (A B C & D)
Number
Average Value
Number
Average Value
Number
Average Value
Number
Average Value
Number
Average Value
LOANS ORIGINATED
5
$299,680
12
$243,814
40
$210,156
12
$83,202
2
$224,060
APPLICATIONS APPROVED, NOT ACCEPTED
0
$0
2
$175,885
5
$260,310
1
$21,620
0
$0
APPLICATIONS DENIED
1
$107,330
7
$194,547
18
$218,142
2
$131,810
4
$195,008
APPLICATIONS WITHDRAWN
1
$246,480
1
$62,290
6
$274,298
0
$0
0
$0
FILES CLOSED FOR INCOMPLETENESS
0
$0
1
$328,400
1
$145,480
0
$0
0
$0
Aggregated Statistics For Year 2007 (Based on 4 partial tracts)
A) FHA, FSA/RHS & VA Home Purchase Loans
B) Conventional Home Purchase Loans
C) Refinancings
D) Home Improvement Loans
F) Non-occupant Loans on < 5 Family Dwellings (A B C & D)
Number
Average Value
Number
Average Value
Number
Average Value
Number
Average Value
Number
Average Value
LOANS ORIGINATED
1
$120,560
24
$224,092
50
$210,453
15
$63,072
4
$183,818
APPLICATIONS APPROVED, NOT ACCEPTED
1
$186,950
2
$186,975
7
$161,589
2
$36,195
0
$0
APPLICATIONS DENIED
0
$0
2
$265,425
23
$236,040
4
$37,498
2
$147,935
APPLICATIONS WITHDRAWN
1
$136,860
4
$208,988
14
$216,309
1
$71,740
1
$72,220
FILES CLOSED FOR INCOMPLETENESS
0
$0
1
$183,020
4
$308,865
0
$0
0
$0
Aggregated Statistics For Year 2006 (Based on 4 partial tracts)
A) FHA, FSA/RHS & VA Home Purchase Loans
B) Conventional Home Purchase Loans
C) Refinancings
D) Home Improvement Loans
F) Non-occupant Loans on < 5 Family Dwellings (A B C & D)
Number
Average Value
Number
Average Value
Number
Average Value
Number
Average Value
Number
Average Value
LOANS ORIGINATED
1
$151,050
33
$203,655
66
$183,316
18
$91,806
5
$237,242
APPLICATIONS APPROVED, NOT ACCEPTED
1
$118,230
5
$150,996
9
$157,213
4
$94,870
1
$301,680
APPLICATIONS DENIED
0
$0
9
$192,096
25
$240,888
9
$54,373
2
$217,650
APPLICATIONS WITHDRAWN
0
$0
3
$180,030
19
$293,106
1
$30,450
2
$262,770
FILES CLOSED FOR INCOMPLETENESS
0
$0
1
$513,330
8
$196,281
0
$0
0
$0
Aggregated Statistics For Year 2005 (Based on 4 partial tracts)
A) FHA, FSA/RHS & VA Home Purchase Loans
B) Conventional Home Purchase Loans
C) Refinancings
D) Home Improvement Loans
F) Non-occupant Loans on < 5 Family Dwellings (A B C & D)
G) Loans On Manufactured Home Dwelling (A B C & D)
Number
Average Value
Number
Average Value
Number
Average Value
Number
Average Value
Number
Average Value
Number
Average Value
LOANS ORIGINATED
1
$134,520
39
$212,693
83
$211,470
21
$97,251
5
$226,020
0
$0
APPLICATIONS APPROVED, NOT ACCEPTED
0
$0
7
$163,290
11
$218,756
1
$35,270
1
$108,910
0
$0
APPLICATIONS DENIED
0
$0
7
$168,361
25
$265,102
5
$149,108
1
$145,820
1
$82,700
APPLICATIONS WITHDRAWN
0
$0
3
$165,037
36
$223,974
5
$180,258
2
$96,555
0
$0
FILES CLOSED FOR INCOMPLETENESS
0
$0
1
$125,350
4
$273,655
0
$0
0
$0
0
$0
Aggregated Statistics For Year 2004 (Based on 4 partial tracts)
A) FHA, FSA/RHS & VA Home Purchase Loans
B) Conventional Home Purchase Loans
C) Refinancings
D) Home Improvement Loans
F) Non-occupant Loans on < 5 Family Dwellings (A B C & D)
G) Loans On Manufactured Home Dwelling (A B C & D)
Number
Average Value
Number
Average Value
Number
Average Value
Number
Average Value
Number
Average Value
Number
Average Value
LOANS ORIGINATED
1
$178,980
32
$201,645
116
$169,089
20
$64,172
9
$122,264
1
$71,050
APPLICATIONS APPROVED, NOT ACCEPTED
0
$0
1
$360,220
10
$158,747
4
$107,818
1
$155,970
1
$17,860
APPLICATIONS DENIED
0
$0
2
$193,980
22
$198,950
7
$96,140
2
$88,500
0
$0
APPLICATIONS WITHDRAWN
0
$0
3
$142,110
47
$190,799
2
$165,125
2
$84,450
0
$0
FILES CLOSED FOR INCOMPLETENESS
0
$0
1
$166,630
6
$150,985
1
$83,220
0
$0
0
$0
Aggregated Statistics For Year 2003 (Based on 4 partial tracts)
A) FHA, FSA/RHS & VA Home Purchase Loans
B) Conventional Home Purchase Loans
C) Refinancings
D) Home Improvement Loans
F) Non-occupant Loans on < 5 Family Dwellings (A B C & D)
Number
Average Value
Number
Average Value
Number
Average Value
Number
Average Value
Number
Average Value
LOANS ORIGINATED
1
$122,170
28
$198,228
253
$147,908
12
$67,291
7
$126,846
APPLICATIONS APPROVED, NOT ACCEPTED
0
$0
1
$377,790
22
$159,054
4
$29,230
1
$77,980
APPLICATIONS DENIED
0
$0
3
$160,853
44
$178,865
6
$82,423
2
$102,130
APPLICATIONS WITHDRAWN
0
$0
2
$104,980
56
$160,449
1
$18,880
2
$59,980
FILES CLOSED FOR INCOMPLETENESS
0
$0
0
$0
9
$149,299
0
$0
0
$0
Aggregated Statistics For Year 1999 (Based on 2 partial tracts)
Detailed PMIC statistics for the following Tracts:0132.01
, 0132.02
2003 - 2018 National Fire Incident Reporting System (NFIRS) incidents
Based on the data from the years 2003 - 2018 the average number of fire incidents per year is 7. The highest number of reported fires - 23 took place in 2014, and the least - 0 in 2004. The data has an increasing trend.
When looking into fire subcategories, the most incidents belonged to: Structure Fires (49.5%), and Outside Fires (30.5%).
Fire incident types reported to NFIRS in Zip Code 02831


 Nearest zip codes: 02815, 02857, 02816, 02921, 02825, 02919.


 Based on the data from the years 2003 - 2018 the average number of fire incidents per year is 7. The highest number of reported fires - 23 took place in 2014, and the least - 0 in 2004. The data has an increasing trend.
 When looking into fire subcategories, the most incidents belonged to: Structure Fires (49.5%), and Outside Fires (30.5%).