Estimated zip code population in 2022: 4,249 Zip code population in 2010: 3,970 Zip code population in 2000: 3,911
Houses and condos: 1,606 Renter-occupied apartments: 85
% of renters here:
5%
State:
28%
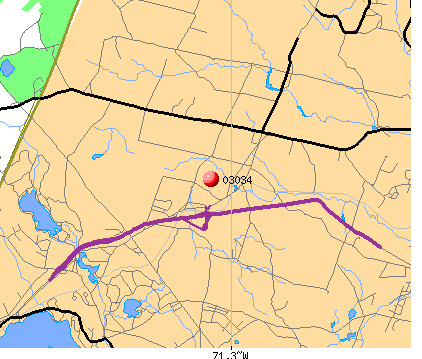
March 2022 cost of living index in zip code 03034: 110.8 (more than average, U.S. average is 100)
Land area: 33.0 sq. mi. Water area: 0.4 sq. mi.
Population density: 129 people per square mile
(very low).
OSM Map
Google Map
MSN Map
OSM Map
General Map
Google Map
MSN Map
OSM Map
Google Map
MSN Map
OSM Map
Google Map
MSN Map
Please wait while loading the map...
Real estate property taxes paid for housing units in 2022:
This zip code:
1.4% ($5,707)
New Hampshire:
1.6% ($6,209)
Median real estate property taxes paid for housing units with mortgages in 2022: $5,653 (1.3%) Median real estate property taxes paid for housing units with no mortgage in 2022: $5,846 (1.4%)
Business Search- 14 Million verified businesses
Males: 2,199
(51.8%)
Females: 2,050
(48.2%)
For population 25 years and over in 03034:
High school or higher: 95.7%
Bachelor's degree or higher: 31.6%
Graduate or professional degree: 14.1%
Unemployed: 2.3%
Mean travel time to work (commute): 30.8 minutes
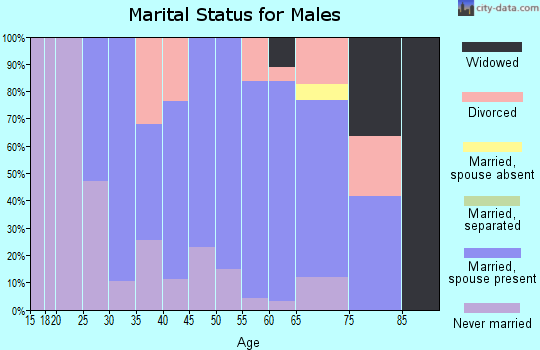
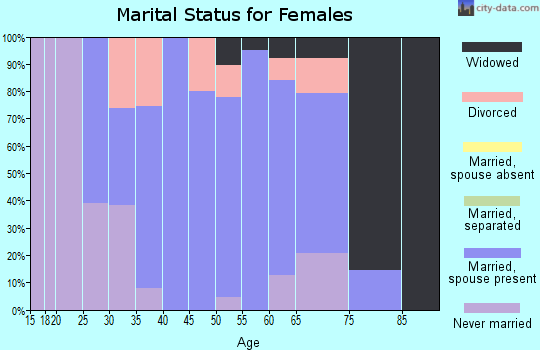
For population 15 years and over in 03034:
Never married: 25.8%
Now married: 61.6%
Separated: 1.3%
Widowed: 5.5%
Divorced: 5.8%
Zip code 03034 compared to state average:
Hispanic race population percentage significantly below state average.
Foreign-born population percentage significantly below state average.
Renting percentage significantly below state average.
Length of stay since moving in significantly above state average.
Estimated median house/condo value in 2022: $420,191
03034:
$420,191
New Hampshire:
$384,700
According to our research of New Hampshire and other state lists, there were 6 registered sex offenders living in 03034 zip code as of May 19, 2024. The ratio of all residents to sex offenders in zip code 03034 is 667 to 1. The ratio of registered sex offenders to all residents in this zip code is lower than the state average.
Median resident age:
This zip code:
47.2 years
New Hampshire median age:
43.3 years
Average household size:
This zip code:
2.6 people
New Hampshire:
2.4 people
Averages for the 2020 tax year for zip code 03034, filed in 2021:
Average Adjusted Gross Income (AGI) in 2020: $90,338 (Individual Income Tax Returns)
Here:
$90,338
State:
$88,845
Salary/wage: $77,366 (reported on 82.9% of returns)
Here:
$77,366
State:
$71,693
(% of AGI for various income ranges: 1145.8% for AGIs below $25k, 3777.9% for AGIs $25k-50k, 6298.3% for AGIs $50k-75k, 9844.1% for AGIs $75k-100k, 17630.3% for AGIs $100k-200k, 80388.0% for AGIs over 200k)
Taxable interest for individuals: $1,024 (reported on 41.9% of returns)
This zip code:
$1,024
New Hampshire:
$1,640
(% of AGI for various income ranges: 22.5% for AGIs below $25k, 18.2% for AGIs $25k-50k, 66.5% for AGIs $50k-75k, 58.2% for AGIs $75k-100k, 71.1% for AGIs $100k-200k, 720.0% for AGIs over 200k)
Ordinary dividends: $3,477 (reported on 26.1% of returns)
Here:
$3,477
State:
$8,258
(% of AGI for various income ranges: 34.7% for AGIs below $25k, 32.9% for AGIs $25k-50k, 163.5% for AGIs $50k-75k, 133.5% for AGIs $75k-100k, 219.7% for AGIs $100k-200k, 1024.0% for AGIs over 200k)
Net capital gain/loss in AGI: +$20,967 (reported on 21.8% of returns)
Here:
+$20,967
State:
+$28,952
(% of AGI for various income ranges: 13.9% for AGIs below $25k, 52.1% for AGIs $25k-50k, 107.4% for AGIs $50k-75k, 244.1% for AGIs $75k-100k, 284.0% for AGIs $100k-200k, 17620.0% for AGIs over 200k)
Profit/loss from business: +$23,008 (reported on 15.8% of returns)
Here:
+$23,008
State:
+$24,424
(% of AGI for various income ranges: 149.7% for AGIs below $25k, 342.1% for AGIs $25k-50k, 316.1% for AGIs $50k-75k, 520.0% for AGIs $75k-100k, 664.9% for AGIs $100k-200k, 5746.0% for AGIs over 200k)
Taxable individual retirement arrangement distribution: $22,667 (reported on 11.5% of returns)
03034:
$22,667
New Hampshire:
$21,952
(% of AGI for various income ranges: 106.7% for AGIs below $25k, 93.5% for AGIs $25k-50k, 366.5% for AGIs $50k-75k, 438.8% for AGIs $75k-100k, 784.3% for AGIs $100k-200k, 2168.0% for AGIs over 200k)
Total itemized deductions: $25,430 (reported on 9.8% of returns)
Here:
$25,430
State:
$32,702
(% of AGI for various income ranges: 207.6% for AGIs $25k-50k, 345.7% for AGIs $50k-75k, 429.4% for AGIs $75k-100k, 568.9% for AGIs $100k-200k, 3254.0% for AGIs over 200k)
Charity contributions: $7,544 (reported on 6.8% of returns)
Here:
$7,544
State:
$9,866
(% of AGI for various income ranges: 32.6% for AGIs $50k-75k, 19.4% for AGIs $75k-100k, 121.1% for AGIs $100k-200k, 1350.0% for AGIs over 200k)
Taxes paid: $8,082 (reported on 9.4% of returns)
03034:
$8,082
State:
$8,247
(% of AGI for various income ranges: 63.8% for AGIs $25k-50k, 97.4% for AGIs $50k-75k, 161.2% for AGIs $75k-100k, 195.4% for AGIs $100k-200k, 758.0% for AGIs over 200k)
Earned income credit: $1,485 (reported on 5.6% of returns)
Here:
$1,485
State:
$1,831
(% of AGI for various income ranges: 30.3% for AGIs below $25k, 24.7% for AGIs $25k-50k)
Percentage of individuals using paid preparers for their 2020 taxes: 91.5%
Here:
91%
State:
92%
(% for various income ranges: 90.6% for AGIs below $25k, 91.5% for AGIs $25k-50k, 88.6% for AGIs $50k-75k, 92.6% for AGIs $75k-100k, 92.9% for AGIs $100k-200k, 93.8% for AGIs over 200k)
Averages for the 2012 tax year for zip code 03034, filed in 2013:
Average Adjusted Gross Income (AGI) in 2012: $67,111 (Individual Income Tax Returns)
Here:
$67,111
State:
$66,185
Salary/wage: $61,120 (reported on 87.1% of returns)
Here:
$61,120
State:
$55,674
(% of AGI for various income ranges: 74.9% for AGIs below $25k, 77.3% for AGIs $25k-50k, 75.1% for AGIs $50k-75k, 81.9% for AGIs $75k-100k, 81.5% for AGIs $100k-200k, 78.3% for AGIs over 200k)
Taxable interest for individuals: $794 (reported on 41.4% of returns)
This zip code:
$794
New Hampshire:
$1,674
(% of AGI for various income ranges: 1.4% for AGIs below $25k, 0.7% for AGIs $25k-50k, 0.7% for AGIs $50k-75k, 0.3% for AGIs $75k-100k, 0.4% for AGIs $100k-200k, 0.2% for AGIs over 200k)
Ordinary dividends: $2,457 (reported on 27.6% of returns)
Here:
$2,457
State:
$6,774
(% of AGI for various income ranges: 2.6% for AGIs below $25k, 1.5% for AGIs $25k-50k, 1.1% for AGIs $50k-75k, 0.4% for AGIs $75k-100k, 1.1% for AGIs $100k-200k, 0.6% for AGIs over 200k)
Net capital gain/loss in AGI: +$3,372 (reported on 19.0% of returns)
Here:
+$3,372
State:
+$13,759
(% of AGI for various income ranges: 0.6% for AGIs $50k-75k, 2.0% for AGIs $100k-200k, 0.9% for AGIs over 200k)
Profit/loss from business: +$19,444 (reported on 15.2% of returns)
Here:
+$19,444
State:
+$19,298
(% of AGI for various income ranges: 7.0% for AGIs below $25k, 6.3% for AGIs $25k-50k, 3.9% for AGIs $50k-75k, 5.0% for AGIs $75k-100k, 4.1% for AGIs $100k-200k, 2.9% for AGIs over 200k)
Taxable individual retirement arrangement distribution: $13,639 (reported on 11.0% of returns)
03034:
$13,639
New Hampshire:
$16,908
(% of AGI for various income ranges: 3.1% for AGIs below $25k, 3.1% for AGIs $25k-50k, 3.4% for AGIs $50k-75k, 1.7% for AGIs $75k-100k, 2.6% for AGIs $100k-200k)
Self-employment retirement plans: $10,900 (reported on 1.4% of returns)
03034:
$10,900
New Hampshire:
$18,791
Total itemized deductions: $20,190 (19% of AGI, reported on 40.0% of returns)
Here:
$20,190
State:
$22,617
Here:
18.9% of AGI
State:
18.1% of AGI
(% of AGI for various income ranges: 14.7% for AGIs below $25k, 12.7% for AGIs $25k-50k, 12.7% for AGIs $50k-75k, 12.6% for AGIs $75k-100k, 12.1% for AGIs $100k-200k, 9.5% for AGIs over 200k)
Charity contributions: $2,348 (reported on 31.4% of returns)
Here:
$2,348
State:
$2,860
(% of AGI for various income ranges: 0.7% for AGIs below $25k, 0.7% for AGIs $25k-50k, 0.8% for AGIs $50k-75k, 1.0% for AGIs $75k-100k, 1.3% for AGIs $100k-200k, 1.4% for AGIs over 200k)
Taxes paid: $7,261 (reported on 40.0% of returns)
03034:
$7,261
State:
$8,830
(% of AGI for various income ranges: 5.0% for AGIs below $25k, 4.6% for AGIs $25k-50k, 3.9% for AGIs $50k-75k, 4.5% for AGIs $75k-100k, 4.4% for AGIs $100k-200k, 3.9% for AGIs over 200k)
Earned income credit: $1,679 (reported on 6.7% of returns)
Here:
$1,679
State:
$1,863
(% of AGI for various income ranges: 2.6% for AGIs below $25k, 0.3% for AGIs $25k-50k)
Percentage of individuals using paid preparers for their 2012 taxes: 48.1%
Here:
48%
State:
45%
(% for various income ranges: 41.3% for AGIs below $25k, 45.0% for AGIs $25k-50k, 50.0% for AGIs $50k-75k, 53.6% for AGIs $75k-100k, 52.6% for AGIs $100k-200k, 71.4% for AGIs over 200k)
Averages for the 2004 tax year for zip code 03034, filed in 2005:
Average Adjusted Gross Income (AGI) in 2004: $56,079 (Individual Income Tax Returns)
Here:
$56,079
State:
$54,348
Salary/wage: $51,711 (reported on 87.8% of returns)
Here:
$51,711
State:
$46,966
(% of AGI for various income ranges: 137.5% for AGIs below $10k, 72.5% for AGIs $10k-25k, 79.0% for AGIs $25k-50k, 83.0% for AGIs $50k-75k, 89.0% for AGIs $75k-100k, 76.6% for AGIs over 100k)
Taxable interest for individuals: $1,208 (reported on 57.8% of returns)
This zip code:
$1,208
New Hampshire:
$1,634
(% of AGI for various income ranges: 5.6% for AGIs below $10k, 2.5% for AGIs $10k-25k, 1.2% for AGIs $25k-50k, 1.3% for AGIs $50k-75k, 0.5% for AGIs $75k-100k, 1.4% for AGIs over 100k)
Taxable dividends: $1,730 (reported on 31.0% of returns)
Here:
$1,730
State:
$3,855
(% of AGI for various income ranges: 5.3% for AGIs below $10k, 2.4% for AGIs $10k-25k, 1.2% for AGIs $25k-50k, 0.5% for AGIs $50k-75k, 0.6% for AGIs $75k-100k, 1.0% for AGIs over 100k)
Net capital gain/loss: +$7,855 (reported on 21.5% of returns)
Here:
+$7,855
State:
+$13,739
(% of AGI for various income ranges: -2.8% for AGIs below $10k, 0.9% for AGIs $10k-25k, 0.1% for AGIs $25k-50k, -0.1% for AGIs $50k-75k, 1.0% for AGIs $75k-100k, 7.0% for AGIs over 100k)
Profit/loss from business: +$18,863 (reported on 18.9% of returns)
Here:
+$18,863
State:
+$16,641
(% of AGI for various income ranges: 3.4% for AGIs below $10k, 9.9% for AGIs $10k-25k, 7.7% for AGIs $25k-50k, 5.7% for AGIs $50k-75k, 4.3% for AGIs $75k-100k, 6.9% for AGIs over 100k)
IRA payment deduction: $3,241 (reported on 4.0% of returns)
03034:
$3,241
New Hampshire:
$3,013
(% of AGI for various income ranges: 0.6% for AGIs $25k-50k, 0.2% for AGIs $50k-75k, 0.2% for AGIs $75k-100k, 0.1% for AGIs over 100k)
Self-employed pension: $12,500 (reported on 1.7% of returns)
Here:
$12,500
New Hampshire:
$13,003
Total itemized deductions: $16,827 (20% of AGI, reported on 44.3% of returns)
Here:
$16,827
State:
$18,832
Here:
20.0% of AGI
State:
19.6% of AGI
(% of AGI for various income ranges: 16.9% for AGIs below $10k, 16.8% for AGIs $10k-25k, 14.1% for AGIs $25k-50k, 14.5% for AGIs $50k-75k, 14.0% for AGIs $75k-100k, 11.6% for AGIs over 100k)
Charity contributions deductions: $2,050 (2% of AGI, reported on 39.2% of returns)
Here:
$2,050
State:
$2,473
Here:
2.4% of AGI
State:
2.4% of AGI
(% of AGI for various income ranges: 0.9% for AGIs below $10k, 1.0% for AGIs $10k-25k, 1.2% for AGIs $25k-50k, 1.2% for AGIs $50k-75k, 1.2% for AGIs $75k-100k, 1.8% for AGIs over 100k)
Total tax: $8,429 (reported on 84.0% of returns)
03034:
$8,429
State:
$8,835
(% of AGI for various income ranges: 3.7% for AGIs below $10k, 5.5% for AGIs $10k-25k, 7.8% for AGIs $25k-50k, 9.4% for AGIs $50k-75k, 10.7% for AGIs $75k-100k, 18.0% for AGIs over 100k)
Earned income credit: $1,480 (reported on 6.2% of returns)
Here:
$1,480
State:
$1,447
Percentage of individuals using paid preparers for their 2004 taxes: 51.8%
Here:
52%
State:
51%
(% for various income ranges: 39.0% for AGIs below $10k, 45.5% for AGIs $10k-25k, 54.1% for AGIs $25k-50k, 57.9% for AGIs $50k-75k, 53.9% for AGIs $75k-100k, 60.8% for AGIs over 100k)
Household received Food Stamps/SNAP in the past 12 months: 54 Household did not receive Food Stamps/SNAP in the past 12 months: 1,562
Women who had a birth in the past 12 months: 78 (70 now married, 0 unmarried) Women who did not have a birth in the past 12 months: 814 (292 now married, 521 unmarried)
Housing units in zip code 03034 with a mortgage: 1,052 (90 second mortgage, 49 home equity loan, 58 both second mortgage and home equity loan) Houses without a mortgage: 47
Median monthly owner costs for units with a mortgage: $2,162 Median monthly owner costs for units without a mortgage: $800
Residents with income below the poverty level in 2022:
This zip code:
1.3%
Whole state:
7.2%
Residents with income below 50% of the poverty level in 2022:
This zip code:
0.8%
Whole state:
3.7%
Median number of rooms in houses and condos:
Here:
6.6
State:
6.4
Median number of rooms in apartments:
Here:
3.3
State:
4.0
Notable locations in this zip code not listed on our city pages
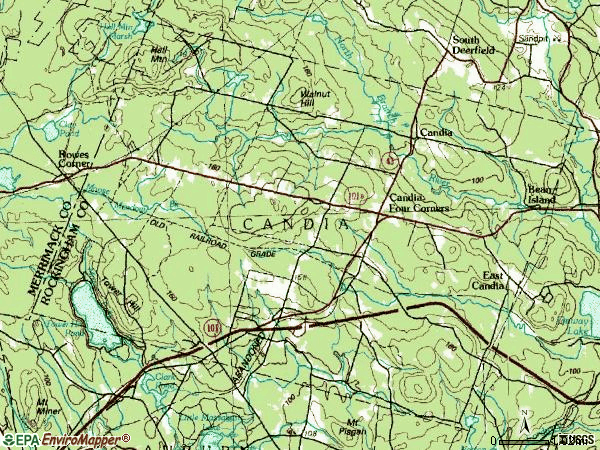
Notable locations in zip code 03034: Charmingfare Ski Touring Center (A), Childrens Camp (B), Candia Station (C), Charmingfare Links (D), East Candia Railroad Station (E), Candia Fire Rescue Department (F), Smyth Public Library (G). Display/hide their locations on the map
Size of family households: 628 2-persons, 206 3-persons, 231 4-persons, 83 5-persons, 20 6-persons, 13 7-or-more-persons
Size of nonfamily households: 314 1-person, 107 2-persons, 6 5-persons
320 married couples with children.
106 single-parent households (97 men, 9 women).
96.4% of residents of 03034 zip code speak English at home.
0.5% of residents speak Spanish at home (100% very well).
2.8% of residents speak other Indo-European language at home (91% very well, 9% well).
Foreign born population: 74 (1.7%) (100.0% of them are naturalized citizens)
This zip code:
1.7%
Whole state:
6.2%
46%Bolivia
11%Taiwan
23%French Canadian
14%English
13%Irish
10%French
6%American
5%German
5%Polish
Year of entry for the foreign-born population
382010 or later
102000 to 2009
01990 to 1999
41Before 1990
Major facilities with environmental interests located in this zip code:
ATLANTIC BRIDGE & ENGINEERING (378 SOUTH RD in CANDIA, NH)
STATE MASTER (New Hampshire water, air, and waste tracking) - HAZARDOUS WASTE PROGRAM Conditionally Exempt Small Quantity Generators, less than 100 kg/month of hazardous waste (Resource Conservation and Recovery Act (tracking hazardous waste)) USED OIL PROGRAM (Resource Conservation and Recovery Act (tracking hazardous waste)) Business NAICS classification: FABRICATED STRUCTURAL METAL MANUFACTURING. Alternative names: ALLSTATE STEEL CORP
CANDRAY PET CARE CENTER INC (472 RAYMOND RD in CANDIA, NH)
STATE MASTER (New Hampshire water, air, and waste tracking) - HAZARDOUS WASTE PROGRAM Conditionally Exempt Small Quantity Generators, less than 100 kg/month of hazardous waste (Resource Conservation and Recovery Act (tracking hazardous waste)) Organizations: MATTHEW & DEBORAH COBB (CONTACT/OPERATOR)
Alternative names: CUTTER VETERINARY SERVICE
EASTERN PROPANE (843 HIGH ST in CANDIA, NH)
STATE MASTER (New Hampshire water, air, and waste tracking) - HAZARDOUS WASTE PROGRAM (Resource Conservation and Recovery Act (tracking hazardous waste))
OLGA ROY RESIDENCE (90 JANE DR in CANDIA, NH)
STATE MASTER (New Hampshire water, air, and waste tracking) - STATE CLEANUP SITE, HAZARDOUS WASTE PROGRAM (Resource Conservation and Recovery Act (tracking hazardous waste))
HIGH SPEED TECHNOLOGIES INC. (16 DEER RUN in CANDIA, NH)
AIR MINOR (AIRS/AFS) Conditionally Exempt Small Quantity Generators, less than 100 kg/month of hazardous waste (Resource Conservation and Recovery Act (tracking hazardous waste)) HAZARDOUS WASTE BIENNIAL REPORTER (Resource Conservation and Recovery Act (tracking hazardous waste)) Business SIC classification: NONCLASSIFIABLE ESTABLISHMENTS Organizations: RALPHFRISELLA (CONTACT/OPERATOR)
CANDIA RECYCLING CENTER TOWN OF (119 NEW BOSTON RD in CANDIA, NH)
AIR MINOR (AIRS/AFS) (Resource Conservation and Recovery Act (tracking hazardous waste)) Business SIC classification: AIR AND WATER RESOURCE AND SOLID WASTE MANAGEMENT Alternative names: CANDIA TOWN OF
PINARD ROBERT F DMD (410 RAYMOND RD in CANDIA, NH)
HAZARDOUS WASTE BIENNIAL REPORTER (Resource Conservation and Recovery Act (tracking hazardous waste)) (Resource Conservation and Recovery Act (tracking hazardous waste)) Organizations: ROBERT PINARD DMD (CONTACT/OWNER)
CANDIA WOODS (313 SOUTH RD in CANDIA, NH)
(Resource Conservation and Recovery Act (tracking hazardous waste)) Organizations: COMMUNITY GOLF CORP (CONTACT/OWNER)
Alternative names: CANDIA WOODS GOLF LINKS
PRECISION TRUCK EQUIP CO INC (JCT 27 & 43 in CANDIA, NH)
HAZARDOUS WASTE BIENNIAL REPORTER (Resource Conservation and Recovery Act (tracking hazardous waste)) (Resource Conservation and Recovery Act (tracking hazardous waste)) Business NAICS classification: PETROLEUM LUBRICATING OIL AND GREASE MANUFACTURING.; MACHINE TOOL (METAL CUTTING TYPES) MANUFACTURING.
AUTO BODY OF CANDIA (200 RAYMOND RD in CANDIA, NH)
(Resource Conservation and Recovery Act (tracking hazardous waste)) Business NAICS classification: AUTOMOTIVE BODY, PAINT, AND INTERIOR REPAIR AND MAINTENANCE.
BRISSON ALFRED E (928 HIGH ST in CANDIA, NH)
(Resource Conservation and Recovery Act (tracking hazardous waste))
BRUCE TRANSPORTATION GROUP (286 RAYMOND RD in CANDIA, NH)
(Resource Conservation and Recovery Act (tracking hazardous waste))
CHARMINGFARE CLEANERS (RTE 27 in CANDIA, NH)
(Resource Conservation and Recovery Act (tracking hazardous waste))
64.6%Fuel oil, kerosene, etc.
18.2%Bottled, tank, or LP gas
7.1%Wood
6.6%Electricity
3.6%Other fuel
Population in 1990: 3,557. Population change in the 1990s: +354 (+10.0%).
Place of birth for U.S.-born residents:
This state: 2,284
Northeast: 1,443
Midwest: 227
South: 115
West: 83
76% of the 03034 zip code residents lived in the same house 5 years ago. Out of people who lived in different houses, 36% lived in this county. Out of people who lived in different counties, 50% lived in New Hampshire.
92% of the 03034 zip code residents lived in the same house 1 year ago. Out of people who lived in different houses, 28% moved from this county. Out of people who lived in different houses, 34% moved from different county within same state. Out of people who lived in different houses, 41% moved from different state.
Private vs. public school enrollment:
Students in private schools in grades 1 to 8 (elementary and middle school): 28
Here:
20.6%
New Hampshire:
11.4%
Students in private schools in grades 9 to 12 (high school): 11
Here:
10.2%
New Hampshire:
14.0%
Students in private undergraduate colleges: 43
Here:
38.1%
New Hampshire:
38.0%
Occupation by median earnings in the past 12 months ($)
161,457Computer and mathematical occupations
112,663Architecture and engineering occupations
100,635Law enforcement workers including supervisors
79,945Education, training, and library occupations
76,061Business and financial operations occupations
68,239Management occupations
Companies with federal contracts located in this zip code:
NATIONSRENTNORTHEAST, INC. (17 OLD MANCHESTER RD. in CANDIA, NH)
$33,000 with Navy for Lease or Rental of Equipment -- Construction, Mining, Excavating, and Highway Maintenance Equipment. Signed on 2000-04-21. Completion date: 2000-07-31.
PAGE STREET LEASING LLC (424 OLD CANDIA RD ROUTE 10 in CANDIA, NH; small business) : $8,136 in 3 contractsfrom 2005 to 2006
$8,603 with Army for Lease or Rental of Facilities -- Other Non-Building Facilities. Signed on 2005-03-09. Completion date: 2006-03-10.
$1,800, same as above.Signed on 2006-06-23. Completion date: 2006-03-10.
-$2,267, same as above.Signed on 2005-09-23. Completion date: 2006-03-10.
Top industries in this zip code by the number of employees in 2005:
Construction: Highway, Street, and Bridge Construction (50-99 employees: 1 establishment)
Real Estate and Rental and Leasing: Construction, Mining, and Forestry Machinery and Equipment Rental and Leasing (20-49: 1)
Construction: Plumbing, Heating, and Air-Conditioning Contractors (10-19: 1, 1-4: 2)
Construction: Site Preparation Contractors (10-19: 1, 1-4: 2)
Other Services (except Public Administration): Religious Organizations (10-19: 1, 1-4: 2)
Construction: Painting and Wall Covering Contractors (10-19: 1, 1-4: 2)
Other Services (except Public Administration): Pet Care (except Veterinary) Services (10-19: 1, 1-4: 1)
Wholesale Trade: Motor Vehicle Supplies and New Parts Merchant Wholesalers (10-19: 1)
Wholesale Trade: Construction and Mining (except Oil Well) Machinery and Equipment Merchant Wholesalers (10-19: 1)
Arts, Entertainment, and Recreation: Golf Courses and Country Clubs (10-19: 1)
Fatal accident statistics in 2014:
Fatal accident count: 1
Vehicles involved in fatal accidents: 1
Fatal accidents caused by drunken drivers: 1
Fatalities: 1
Persons involved in fatal accidents: 1
Pedestrians involved in fatal accidents: 0
Fatal accident statistics in 2013:
Fatal accident count: 1
Vehicles involved in fatal accidents: 1
Fatal accidents caused by drunken drivers: 0
Fatalities: 1
Persons involved in fatal accidents: 1
Pedestrians involved in fatal accidents: 0
Home Mortgage Disclosure Act Aggregated Statistics For Year 2009 (Based on 2 full tracts)
A) FHA, FSA/RHS & VA Home Purchase Loans
B) Conventional Home Purchase Loans
C) Refinancings
D) Home Improvement Loans
F) Non-occupant Loans on < 5 Family Dwellings (A B C & D)
G) Loans On Manufactured Home Dwelling (A B C & D)
Number
Average Value
Number
Average Value
Number
Average Value
Number
Average Value
Number
Average Value
Number
Average Value
LOANS ORIGINATED
20
$203,735
26
$177,308
228
$193,248
20
$64,816
4
$181,265
2
$174,775
APPLICATIONS APPROVED, NOT ACCEPTED
2
$149,805
0
$0
20
$210,226
0
$0
0
$0
0
$0
APPLICATIONS DENIED
6
$268,983
4
$17,978
98
$221,528
2
$14,980
2
$94,875
0
$0
APPLICATIONS WITHDRAWN
2
$272,645
4
$184,760
44
$188,981
4
$144,812
0
$0
2
$185,760
FILES CLOSED FOR INCOMPLETENESS
0
$0
2
$170,780
20
$243,383
0
$0
0
$0
0
$0
Aggregated Statistics For Year 2008 (Based on 2 full tracts)
A) FHA, FSA/RHS & VA Home Purchase Loans
B) Conventional Home Purchase Loans
C) Refinancings
D) Home Improvement Loans
F) Non-occupant Loans on < 5 Family Dwellings (A B C & D)
G) Loans On Manufactured Home Dwelling (A B C & D)
Number
Average Value
Number
Average Value
Number
Average Value
Number
Average Value
Number
Average Value
Number
Average Value
LOANS ORIGINATED
14
$223,994
42
$181,098
128
$198,039
32
$122,778
4
$142,315
4
$98,872
APPLICATIONS APPROVED, NOT ACCEPTED
2
$270,650
2
$24,970
24
$177,685
12
$80,895
2
$162,790
4
$127,335
APPLICATIONS DENIED
2
$210,725
6
$57,258
68
$192,426
8
$125,586
2
$103,865
2
$22,970
APPLICATIONS WITHDRAWN
2
$293,620
16
$169,030
54
$254,446
2
$29,960
0
$0
0
$0
FILES CLOSED FOR INCOMPLETENESS
0
$0
0
$0
8
$170,528
4
$79,895
0
$0
0
$0
Aggregated Statistics For Year 2007 (Based on 2 full tracts)
A) FHA, FSA/RHS & VA Home Purchase Loans
B) Conventional Home Purchase Loans
C) Refinancings
D) Home Improvement Loans
F) Non-occupant Loans on < 5 Family Dwellings (A B C & D)
G) Loans On Manufactured Home Dwelling (A B C & D)
Number
Average Value
Number
Average Value
Number
Average Value
Number
Average Value
Number
Average Value
Number
Average Value
LOANS ORIGINATED
4
$245,180
78
$222,275
166
$168,804
86
$60,456
6
$112,853
2
$11,985
APPLICATIONS APPROVED, NOT ACCEPTED
0
$0
6
$288,957
32
$211,912
14
$56,784
0
$0
0
$0
APPLICATIONS DENIED
2
$292,620
10
$229,901
132
$223,694
20
$92,680
2
$149,805
0
$0
APPLICATIONS WITHDRAWN
0
$0
4
$187,755
70
$195,317
6
$149,805
2
$199,740
0
$0
FILES CLOSED FOR INCOMPLETENESS
0
$0
2
$249,675
28
$224,708
0
$0
0
$0
0
$0
Aggregated Statistics For Year 2006 (Based on 2 full tracts)
B) Conventional Home Purchase Loans
C) Refinancings
D) Home Improvement Loans
F) Non-occupant Loans on < 5 Family Dwellings (A B C & D)
G) Loans On Manufactured Home Dwelling (A B C & D)
Number
Average Value
Number
Average Value
Number
Average Value
Number
Average Value
Number
Average Value
LOANS ORIGINATED
130
$187,894
204
$176,985
78
$78,897
8
$209,728
2
$44,940
APPLICATIONS APPROVED, NOT ACCEPTED
18
$157,573
24
$244,265
14
$50,649
0
$0
0
$0
APPLICATIONS DENIED
22
$254,578
96
$197,493
36
$134,769
6
$290,288
2
$242,685
APPLICATIONS WITHDRAWN
12
$144,978
56
$222,924
12
$164,786
0
$0
0
$0
FILES CLOSED FOR INCOMPLETENESS
4
$160,790
28
$177,626
4
$21,472
0
$0
0
$0
Aggregated Statistics For Year 2005 (Based on 2 full tracts)
A) FHA, FSA/RHS & VA Home Purchase Loans
B) Conventional Home Purchase Loans
C) Refinancings
D) Home Improvement Loans
F) Non-occupant Loans on < 5 Family Dwellings (A B C & D)
G) Loans On Manufactured Home Dwelling (A B C & D)
Number
Average Value
Number
Average Value
Number
Average Value
Number
Average Value
Number
Average Value
Number
Average Value
LOANS ORIGINATED
2
$234,695
136
$217,775
274
$182,981
68
$85,036
16
$139,693
2
$31,960
APPLICATIONS APPROVED, NOT ACCEPTED
0
$0
18
$244,016
34
$189,636
8
$80,395
0
$0
0
$0
APPLICATIONS DENIED
2
$240,685
36
$158,682
126
$194,382
46
$69,127
6
$119,178
10
$83,092
APPLICATIONS WITHDRAWN
0
$0
10
$187,356
98
$181,682
16
$174,398
2
$24,970
6
$110,190
FILES CLOSED FOR INCOMPLETENESS
0
$0
2
$88,885
32
$158,793
2
$19,975
0
$0
2
$102,865
Aggregated Statistics For Year 2004 (Based on 2 full tracts)
A) FHA, FSA/RHS & VA Home Purchase Loans
B) Conventional Home Purchase Loans
C) Refinancings
D) Home Improvement Loans
F) Non-occupant Loans on < 5 Family Dwellings (A B C & D)
G) Loans On Manufactured Home Dwelling (A B C & D)
Number
Average Value
Number
Average Value
Number
Average Value
Number
Average Value
Number
Average Value
Number
Average Value
LOANS ORIGINATED
12
$217,383
98
$210,726
352
$151,365
78
$73,468
12
$120,677
2
$89,885
APPLICATIONS APPROVED, NOT ACCEPTED
2
$209,725
8
$282,382
48
$155,131
22
$42,218
4
$129,830
0
$0
APPLICATIONS DENIED
0
$0
24
$160,208
108
$165,618
38
$65,178
2
$299,610
2
$17,975
APPLICATIONS WITHDRAWN
0
$0
22
$170,959
120
$153,833
10
$87,087
2
$449,415
4
$40,948
FILES CLOSED FOR INCOMPLETENESS
0
$0
2
$302,605
26
$167,474
2
$27,965
0
$0
0
$0
Aggregated Statistics For Year 2003 (Based on 2 full tracts)
A) FHA, FSA/RHS & VA Home Purchase Loans
B) Conventional Home Purchase Loans
C) Refinancings
D) Home Improvement Loans
E) Loans on Dwellings For 5+ Families
F) Non-occupant Loans on < 5 Family Dwellings (A B C & D)
Number
Average Value
Number
Average Value
Number
Average Value
Number
Average Value
Number
Average Value
Number
Average Value
LOANS ORIGINATED
2
$136,820
92
$200,630
803
$143,731
20
$57,326
0
$0
8
$155,798
APPLICATIONS APPROVED, NOT ACCEPTED
2
$120,845
14
$229,416
90
$129,143
8
$48,188
0
$0
0
$0
APPLICATIONS DENIED
2
$122,840
18
$189,864
148
$151,735
14
$35,953
2
$1,484,070
2
$102,865
APPLICATIONS WITHDRAWN
0
$0
8
$246,180
74
$150,534
4
$69,910
0
$0
2
$145,810
FILES CLOSED FOR INCOMPLETENESS
0
$0
4
$238,190
20
$138,520
2
$99,870
0
$0
0
$0
Aggregated Statistics For Year 2002 (Based on 2 full tracts)
A) FHA, FSA/RHS & VA Home Purchase Loans
B) Conventional Home Purchase Loans
C) Refinancings
D) Home Improvement Loans
E) Loans on Dwellings For 5+ Families
F) Non-occupant Loans on < 5 Family Dwellings (A B C & D)
Number
Average Value
Number
Average Value
Number
Average Value
Number
Average Value
Number
Average Value
Number
Average Value
LOANS ORIGINATED
4
$174,272
94
$180,680
485
$140,827
34
$43,649
2
$978,725
6
$169,447
APPLICATIONS APPROVED, NOT ACCEPTED
2
$207,730
20
$168,480
68
$125,954
14
$43,800
0
$0
4
$80,395
APPLICATIONS DENIED
2
$117,845
14
$144,241
102
$112,109
36
$44,719
0
$0
2
$109,855
APPLICATIONS WITHDRAWN
2
$239,690
6
$123,838
68
$121,518
14
$36,381
0
$0
0
$0
FILES CLOSED FOR INCOMPLETENESS
0
$0
0
$0
20
$154,399
0
$0
0
$0
0
$0
Aggregated Statistics For Year 2001 (Based on 2 full tracts)
A) FHA, FSA/RHS & VA Home Purchase Loans
B) Conventional Home Purchase Loans
C) Refinancings
D) Home Improvement Loans
F) Non-occupant Loans on < 5 Family Dwellings (A B C & D)
Number
Average Value
Number
Average Value
Number
Average Value
Number
Average Value
Number
Average Value
LOANS ORIGINATED
6
$151,802
118
$154,020
389
$126,935
60
$45,508
4
$114,850
APPLICATIONS APPROVED, NOT ACCEPTED
0
$0
20
$131,529
50
$100,030
12
$44,276
0
$0
APPLICATIONS DENIED
0
$0
14
$52,361
92
$118,867
30
$25,034
0
$0
APPLICATIONS WITHDRAWN
2
$135,825
2
$109,855
80
$113,702
10
$29,362
4
$72,405
FILES CLOSED FOR INCOMPLETENESS
0
$0
4
$164,785
12
$144,478
2
$79,895
0
$0
Aggregated Statistics For Year 2000 (Based on 2 full tracts)
A) FHA, FSA/RHS & VA Home Purchase Loans
B) Conventional Home Purchase Loans
C) Refinancings
D) Home Improvement Loans
F) Non-occupant Loans on < 5 Family Dwellings (A B C & D)
Number
Average Value
Number
Average Value
Number
Average Value
Number
Average Value
Number
Average Value
LOANS ORIGINATED
26
$148,268
124
$126,030
88
$118,232
48
$19,183
2
$59,920
APPLICATIONS APPROVED, NOT ACCEPTED
4
$149,305
8
$127,834
8
$122,840
18
$35,842
0
$0
APPLICATIONS DENIED
2
$141,815
6
$96,208
42
$97,112
20
$18,776
0
$0
APPLICATIONS WITHDRAWN
0
$0
10
$111,055
54
$96,097
8
$23,719
0
$0
FILES CLOSED FOR INCOMPLETENESS
0
$0
0
$0
6
$29,295
4
$44,942
0
$0
Aggregated Statistics For Year 1999 (Based on 1 full tract)
A) FHA, FSA/RHS & VA Home Purchase Loans
B) Conventional Home Purchase Loans
C) Refinancings
D) Home Improvement Loans
F) Non-occupant Loans on < 5 Family Dwellings (A B C & D)
Detailed PMIC statistics for the following Tracts:0500.00
2002 - 2017 National Fire Incident Reporting System (NFIRS) incidents
Based on the data from the years 2002 - 2017 the average number of fire incidents per year is 22. The highest number of fire incidents - 55 took place in 2016, and the least - 0 in 2003. The data has a rising trend.
When looking into fire subcategories, the most incidents belonged to: Structure Fires (48.1%), and Outside Fires (33.6%).
Fire incident types reported to NFIRS in Zip Code 03034


 Nearest zip codes: 03032, 03036, 03037, 03077, 03109, 03106.


 Based on the data from the years 2002 - 2017 the average number of fire incidents per year is 22. The highest number of fire incidents - 55 took place in 2016, and the least - 0 in 2003. The data has a rising trend.
 When looking into fire subcategories, the most incidents belonged to: Structure Fires (48.1%), and Outside Fires (33.6%).