Estimated zip code population in 2022: 1,460 Zip code population in 2010: 1,573 Zip code population in 2000: 1,865
Houses and condos: 683 Renter-occupied apartments: 16
% of renters here:
3%
State:
28%
March 2022 cost of living index in zip code 03043: 112.4 (more than average, U.S. average is 100)
Land area: 31.3 sq. mi. Water area: 0.6 sq. mi.
Population density: 47 people per square mile
(very low).
OSM Map
Google Map
MSN Map
OSM Map
General Map
Google Map
MSN Map
OSM Map
Google Map
MSN Map
OSM Map
Google Map
MSN Map
Please wait while loading the map...
Real estate property taxes paid for housing units in 2022:
This zip code:
1.8% ($7,308)
New Hampshire:
1.6% ($6,209)
Median real estate property taxes paid for housing units with mortgages in 2022: $7,118 (1.7%) Median real estate property taxes paid for housing units with no mortgage in 2022: $7,541 (1.9%)
Business Search- 14 Million verified businesses
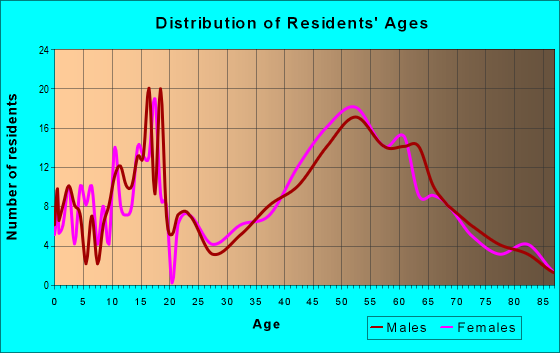
Males: 700
(47.9%)
Females: 760
(52.1%)
For population 25 years and over in 03043:
High school or higher: 99.5%
Bachelor's degree or higher: 53.9%
Graduate or professional degree: 23.4%
Unemployed: 2.2%
Mean travel time to work (commute): 36.0 minutes
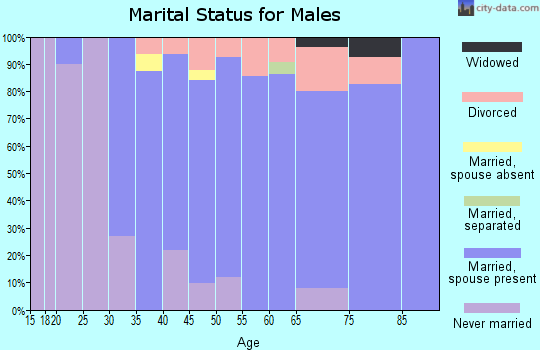
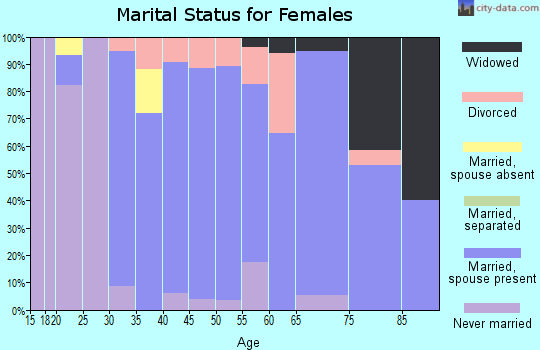
For population 15 years and over in 03043:
Never married: 20.5%
Now married: 68.6%
Separated: 0.3%
Widowed: 4.7%
Divorced: 5.9%
Zip code 03043 compared to state average:
Black race population percentage significantly below state average.
Hispanic race population percentage significantly below state average.
Median age above state average.
Renting percentage significantly below state average.
Estimated median house/condo value in 2022: $399,764
03043:
$399,764
New Hampshire:
$384,700
According to our research of New Hampshire and other state lists, there was 1 registered sex offender living in 03043 zip code as of May 07, 2024. The ratio of all residents to sex offenders in zip code 03043 is 1,543 to 1. The ratio of registered sex offenders to all residents in this zip code is much lower than the state average.
Median resident age:
This zip code:
51.1 years
New Hampshire median age:
43.3 years
Average household size:
This zip code:
2.6 people
New Hampshire:
2.4 people
Averages for the 2020 tax year for zip code 03043, filed in 2021:
Average Adjusted Gross Income (AGI) in 2020: $97,647 (Individual Income Tax Returns)
Here:
$97,647
State:
$88,845
Salary/wage: $77,355 (reported on 80.7% of returns)
Here:
$77,355
State:
$71,693
(% of AGI for various income ranges: 1133.6% for AGIs below $25k, 3406.4% for AGIs $25k-50k, 6566.2% for AGIs $50k-75k, 10638.6% for AGIs $75k-100k, 15310.0% for AGIs $100k-200k, 57643.3% for AGIs over 200k)
Taxable interest for individuals: $1,643 (reported on 42.2% of returns)
This zip code:
$1,643
New Hampshire:
$1,640
(% of AGI for various income ranges: 15.5% for AGIs below $25k, 36.4% for AGIs $25k-50k, 81.2% for AGIs $50k-75k, 35.7% for AGIs $75k-100k, 105.5% for AGIs $100k-200k, 1040.0% for AGIs over 200k)
Ordinary dividends: $7,459 (reported on 32.5% of returns)
Here:
$7,459
State:
$8,258
(% of AGI for various income ranges: 62.7% for AGIs below $25k, 72.7% for AGIs $25k-50k, 215.0% for AGIs $50k-75k, 230.0% for AGIs $75k-100k, 458.2% for AGIs $100k-200k, 3426.7% for AGIs over 200k)
Net capital gain/loss in AGI: +$33,172 (reported on 30.1% of returns)
Here:
+$33,172
State:
+$28,952
(% of AGI for various income ranges: 32.7% for AGIs below $25k, 103.6% for AGIs $25k-50k, 167.5% for AGIs $50k-75k, 160.0% for AGIs $75k-100k, 687.3% for AGIs $100k-200k, 23803.3% for AGIs over 200k)
Profit/loss from business: +$16,695 (reported on 22.9% of returns)
Here:
+$16,695
State:
+$24,424
(% of AGI for various income ranges: 228.2% for AGIs below $25k, 613.6% for AGIs $25k-50k, 327.1% for AGIs $75k-100k, 1833.6% for AGIs $100k-200k)
Taxable individual retirement arrangement distribution: $32,700 (reported on 13.3% of returns)
03043:
$32,700
New Hampshire:
$21,952
(% of AGI for various income ranges: 266.4% for AGIs below $25k, 635.0% for AGIs $50k-75k, 2541.8% for AGIs $100k-200k)
Total itemized deductions: $35,650 (reported on 9.6% of returns)
Here:
$35,650
State:
$32,702
(% of AGI for various income ranges: 655.5% for AGIs $25k-50k, 1315.5% for AGIs $100k-200k, 2280.0% for AGIs over 200k)
Charity contributions: $5,017 (reported on 7.2% of returns)
Here:
$5,017
State:
$9,866
(% of AGI for various income ranges: 173.6% for AGIs $100k-200k, 366.7% for AGIs over 200k)
Taxes paid: $9,250 (reported on 9.6% of returns)
03043:
$9,250
State:
$8,247
(% of AGI for various income ranges: 340.0% for AGIs $50k-75k, 232.7% for AGIs $100k-200k, 706.7% for AGIs over 200k)
Earned income credit: $1,350 (reported on 7.2% of returns)
Here:
$1,350
State:
$1,831
(% of AGI for various income ranges: 73.6% for AGIs below $25k)
Percentage of individuals using paid preparers for their 2020 taxes: 88.0%
Here:
88%
State:
92%
(% for various income ranges: 83.3% for AGIs below $25k, 92.9% for AGIs $25k-50k, 100.0% for AGIs $50k-75k, 83.3% for AGIs $75k-100k, 88.9% for AGIs $100k-200k, 77.8% for AGIs over 200k)
Averages for the 2012 tax year for zip code 03043, filed in 2013:
Average Adjusted Gross Income (AGI) in 2012: $77,962 (Individual Income Tax Returns)
Here:
$77,962
State:
$66,185
Salary/wage: $63,248 (reported on 82.1% of returns)
Here:
$63,248
State:
$55,674
(% of AGI for various income ranges: 65.6% for AGIs below $25k, 72.7% for AGIs $25k-50k, 67.5% for AGIs $50k-75k, 77.7% for AGIs $75k-100k, 72.8% for AGIs $100k-200k, 53.9% for AGIs over 200k)
Taxable interest for individuals: $1,614 (reported on 44.9% of returns)
This zip code:
$1,614
New Hampshire:
$1,674
(% of AGI for various income ranges: 2.3% for AGIs below $25k, 0.9% for AGIs $25k-50k, 0.6% for AGIs $50k-75k, 0.2% for AGIs $75k-100k, 0.7% for AGIs $100k-200k, 1.3% for AGIs over 200k)
Ordinary dividends: $7,896 (reported on 35.9% of returns)
Here:
$7,896
State:
$6,774
(% of AGI for various income ranges: 9.8% for AGIs below $25k, 1.3% for AGIs $25k-50k, 3.9% for AGIs $50k-75k, 1.1% for AGIs $75k-100k, 3.2% for AGIs $100k-200k, 4.7% for AGIs over 200k)
Net capital gain/loss in AGI: +$12,243 (reported on 26.9% of returns)
Here:
+$12,243
State:
+$13,759
(% of AGI for various income ranges: 0.8% for AGIs below $25k, 0.6% for AGIs $50k-75k, 1.3% for AGIs $100k-200k, 12.1% for AGIs over 200k)
Profit/loss from business: +$17,900 (reported on 21.8% of returns)
Here:
+$17,900
State:
+$19,298
(% of AGI for various income ranges: 12.8% for AGIs below $25k, 6.6% for AGIs $25k-50k, 9.9% for AGIs $50k-75k, 3.0% for AGIs $75k-100k, 7.1% for AGIs $100k-200k)
Taxable individual retirement arrangement distribution: $18,455 (reported on 14.1% of returns)
03043:
$18,455
New Hampshire:
$16,908
(% of AGI for various income ranges: 5.6% for AGIs below $25k, 6.2% for AGIs $25k-50k, 4.4% for AGIs $75k-100k, 6.4% for AGIs $100k-200k)
Total itemized deductions: $22,017 (18% of AGI, reported on 44.9% of returns)
Here:
$22,017
State:
$22,617
Here:
18.2% of AGI
State:
18.1% of AGI
(% of AGI for various income ranges: 30.6% for AGIs below $25k, 13.8% for AGIs $25k-50k, 16.7% for AGIs $50k-75k, 12.6% for AGIs $75k-100k, 12.8% for AGIs $100k-200k, 8.0% for AGIs over 200k)
Charity contributions: $2,735 (reported on 33.3% of returns)
Here:
$2,735
State:
$2,860
(% of AGI for various income ranges: 0.5% for AGIs $25k-50k, 1.7% for AGIs $50k-75k, 0.9% for AGIs $75k-100k, 1.7% for AGIs $100k-200k, 0.8% for AGIs over 200k)
Taxes paid: $8,397 (reported on 44.9% of returns)
03043:
$8,397
State:
$8,830
(% of AGI for various income ranges: 8.3% for AGIs below $25k, 5.1% for AGIs $25k-50k, 6.2% for AGIs $50k-75k, 5.0% for AGIs $75k-100k, 4.9% for AGIs $100k-200k, 3.6% for AGIs over 200k)
Earned income credit: $1,650 (reported on 10.3% of returns)
Here:
$1,650
State:
$1,863
(% of AGI for various income ranges: 3.2% for AGIs below $25k, 0.9% for AGIs $25k-50k)
Percentage of individuals using paid preparers for their 2012 taxes: 43.6%
Here:
44%
State:
45%
(% for various income ranges: 33.3% for AGIs below $25k, 42.9% for AGIs $25k-50k, 53.8% for AGIs $50k-75k, 37.5% for AGIs $75k-100k, 50.0% for AGIs $100k-200k, 60.0% for AGIs over 200k)
Averages for the 2004 tax year for zip code 03043, filed in 2005:
Average Adjusted Gross Income (AGI) in 2004: $59,578 (Individual Income Tax Returns)
Here:
$59,578
State:
$54,348
Salary/wage: $52,688 (reported on 82.7% of returns)
Here:
$52,688
State:
$46,966
(% of AGI for various income ranges: 90.4% for AGIs below $10k, 67.9% for AGIs $10k-25k, 77.1% for AGIs $25k-50k, 80.9% for AGIs $50k-75k, 79.5% for AGIs $75k-100k, 67.2% for AGIs over 100k)
Taxable interest for individuals: $1,579 (reported on 56.0% of returns)
This zip code:
$1,579
New Hampshire:
$1,634
(% of AGI for various income ranges: 7.9% for AGIs below $10k, 4.8% for AGIs $10k-25k, 1.1% for AGIs $25k-50k, 1.2% for AGIs $50k-75k, 1.1% for AGIs $75k-100k, 1.4% for AGIs over 100k)
Taxable dividends: $6,314 (reported on 35.6% of returns)
Here:
$6,314
State:
$3,855
(% of AGI for various income ranges: 10.8% for AGIs below $10k, 4.2% for AGIs $10k-25k, 2.9% for AGIs $25k-50k, 2.8% for AGIs $50k-75k, 3.2% for AGIs $75k-100k, 4.4% for AGIs over 100k)
Net capital gain/loss: +$14,923 (reported on 27.0% of returns)
Here:
+$14,923
State:
+$13,739
(% of AGI for various income ranges: -7.9% for AGIs below $10k, -0.5% for AGIs $10k-25k, 0.5% for AGIs $25k-50k, 0.7% for AGIs $50k-75k, 1.3% for AGIs $75k-100k, 13.5% for AGIs over 100k)
Profit/loss from business: +$14,954 (reported on 24.2% of returns)
Here:
+$14,954
State:
+$16,641
(% of AGI for various income ranges: 11.5% for AGIs below $10k, 11.5% for AGIs $10k-25k, 5.8% for AGIs $25k-50k, 6.8% for AGIs $50k-75k, 1.8% for AGIs $75k-100k, 6.9% for AGIs over 100k)
IRA payment deduction: $3,079 (reported on 4.7% of returns)
03043:
$3,079
New Hampshire:
$3,013
Total itemized deductions: $18,414 (20% of AGI, reported on 45.9% of returns)
Here:
$18,414
State:
$18,832
Here:
19.9% of AGI
State:
19.6% of AGI
(% of AGI for various income ranges: 39.1% for AGIs below $10k, 15.7% for AGIs $10k-25k, 15.2% for AGIs $25k-50k, 17.0% for AGIs $50k-75k, 15.2% for AGIs $75k-100k, 11.8% for AGIs over 100k)
Charity contributions deductions: $1,944 (2% of AGI, reported on 39.5% of returns)
Here:
$1,944
State:
$2,473
Here:
2.0% of AGI
State:
2.4% of AGI
(% of AGI for various income ranges: 1.0% for AGIs $10k-25k, 1.2% for AGIs $25k-50k, 1.5% for AGIs $50k-75k, 1.7% for AGIs $75k-100k, 1.1% for AGIs over 100k)
Total tax: $9,488 (reported on 79.9% of returns)
03043:
$9,488
State:
$8,835
(% of AGI for various income ranges: 4.0% for AGIs below $10k, 5.9% for AGIs $10k-25k, 6.9% for AGIs $25k-50k, 9.1% for AGIs $50k-75k, 10.7% for AGIs $75k-100k, 17.0% for AGIs over 100k)
Earned income credit: $1,211 (reported on 7.0% of returns)
Here:
$1,211
State:
$1,447
Percentage of individuals using paid preparers for their 2004 taxes: 45.5%
Here:
46%
State:
51%
(% for various income ranges: 32.7% for AGIs below $10k, 40.7% for AGIs $10k-25k, 49.7% for AGIs $25k-50k, 50.4% for AGIs $50k-75k, 37.6% for AGIs $75k-100k, 61.9% for AGIs over 100k)
Household received Food Stamps/SNAP in the past 12 months: 12 Household did not receive Food Stamps/SNAP in the past 12 months: 544
Women who had a birth in the past 12 months: 17 (15 now married, 0 unmarried) Women who did not have a birth in the past 12 months: 189 (111 now married, 78 unmarried)
Housing units in zip code 03043 with a mortgage: 271 (23 second mortgage, 24 both second mortgage and home equity loan) Houses without a mortgage: 31
Median monthly owner costs for units with a mortgage: $2,161 Median monthly owner costs for units without a mortgage: $958
Residents with income below the poverty level in 2022:
This zip code:
7.6%
Whole state:
7.2%
Residents with income below 50% of the poverty level in 2022:
This zip code:
5.5%
Whole state:
3.7%
Median number of rooms in houses and condos:
Here:
6.6
State:
6.4
Median number of rooms in apartments:
Here:
4.8
State:
4.0
Notable locations in this zip code not listed on our city pages
Size of family households: 226 2-persons, 62 3-persons, 61 4-persons, 26 5-persons, 4 6-persons, 24 7-or-more-persons
Size of nonfamily households: 130 1-person, 15 2-persons
310 married couples with children.
20 single-parent households (7 men, 13 women).
97.4% of residents of 03043 zip code speak English at home.
2.1% of residents speak Spanish at home (90% very well, 10% not well).
0.4% of residents speak other Indo-European language at home (100% very well).
0.1% of residents speak Asian or Pacific Island language at home (100% very well).
0.1% of residents speak other language at home (100% very well).
Foreign born population: 65 (4.5%) (76.9% of them are naturalized citizens)
This zip code:
4.5%
Whole state:
6.2%
16%Sweden
16%United Kingdom, excluding England and Scotland
12%India
9%France
9%West Indies
8%Guyana
5%Ukraine
27%English
17%French
13%American
12%Irish
10%German
5%Italian
4%Scottish
Year of entry for the foreign-born population
42010 or later
82000 to 2009
91990 to 1999
42Before 1990
Facilities with environmental interests located in this zip code:
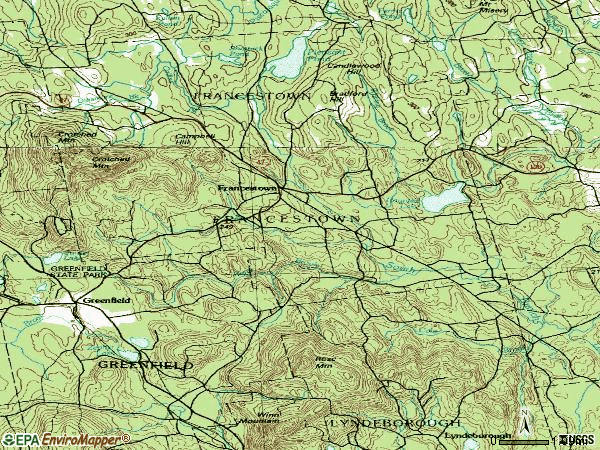
CROTCHED MOUNTAIN GOLF CLUB (740 2ND NH TPKE N in FRANCESTOWN, NH)
Conditionally Exempt Small Quantity Generators, less than 100 kg/month of hazardous waste (Resource Conservation and Recovery Act (tracking hazardous waste)) HAZARDOUS WASTE BIENNIAL REPORTER (Resource Conservation and Recovery Act (tracking hazardous waste)) Organizations: CMR RESORT PROPERTIES (CONTACT/OPERATOR)
, TPR DEVELOPMENT CO LLC (CONTACT/OWNER)
Alternative names: TORY PINES RESORT
A T & T (BEAR HILL RD in FRANCESTOWN, NH)
(Resource Conservation and Recovery Act (tracking hazardous waste)) Alternative names: A T & T FRANCESTOWN REPEATER STA
(Resource Conservation and Recovery Act (tracking hazardous waste))
CROTCHED MOUNTAIN SKI AREA (WEST SLOPE in FRANCESTOWN, NH)
(Resource Conservation and Recovery Act (tracking hazardous waste))
HARDWICK D H & SONS INC (1580 BENNINGTON RD in FRANCESTOWN, NH)
(Resource Conservation and Recovery Act (tracking hazardous waste))
PARTRIDGE DAN RESIDENCE (25 BIBLE HILL RD in FRANCESTOWN, NH)
(Resource Conservation and Recovery Act (tracking hazardous waste))
COUNTRY BROKERS (1490 BIBLE HILL RD in FRANCESTOWN, NH)
Conditionally Exempt Small Quantity Generators, less than 100 kg/month of hazardous waste (Resource Conservation and Recovery Act (tracking hazardous waste))
Housing units lacking complete plumbing facilities: 3.4% Housing units lacking complete kitchen facilities: 1.6%
47.2%Fuel oil, kerosene, etc.
22.1%Bottled, tank, or LP gas
20.8%Wood
7.2%Electricity
2.0%Other fuel
0.7%Utility gas
0.6%No fuel used
Population in 1990: 1,219. Population change in the 1990s: +646 (+53.0%).
Place of birth for U.S.-born residents:
This state: 764
Northeast: 435
Midwest: 60
South: 63
West: 70
65% of the 03043 zip code residents lived in the same house 5 years ago. Out of people who lived in different houses, 55% lived in this county. Out of people who lived in different counties, 50% lived in New Hampshire.
94% of the 03043 zip code residents lived in the same house 1 year ago. Out of people who lived in different houses, 35% moved from this county. Out of people who lived in different houses, 35% moved from different county within same state. Out of people who lived in different houses, 31% moved from different state.
Private vs. public school enrollment:
Students in private schools in grades 1 to 8 (elementary and middle school): 11
Here:
7.2%
New Hampshire:
11.4%
Students in private schools in grades 9 to 12 (high school): 14
Here:
19.9%
New Hampshire:
14.0%
Students in private undergraduate colleges: 3
Here:
37.2%
New Hampshire:
38.0%
Occupation by median earnings in the past 12 months ($)
115,668Health diagnosing and treating practitioners and other technical occupations
111,629Sales and related occupations
97,202Computer and mathematical occupations
93,689Fire fighting and prevention, and other protective service workers including supervisors
80,363Architecture and engineering occupations
76,799Installation, maintenance, and repair occupations
Companies with federal contracts located in this zip code:
NH ELEVATOR INC (475 DENNISON POND RD in FRANCESTOWN, NH; small business)
$3,870 with Army for Maintenance, Repair or Alteration of Real Property -- Miscellaneous Buildings. Signed on 2006-06-27. Completion date: 2007-07-31.
Top industries in this zip code by the number of employees in 2005:
Accommodation and Food Services: Hotels (except Casino Hotels) and Motels (10-19 employees: 1 establishment, 5-9 employees: 1 establishment)
Construction: Site Preparation Contractors (10-19: 1)
Accommodation and Food Services: Full-Service Restaurants (5-9: 1, 1-4: 1)
Administrative and Support and Waste Management and Remediation Services: Landscaping Services (5-9: 1)
Construction: Plumbing, Heating, and Air-Conditioning Contractors (1-4: 3)
Professional, Scientific, and Technical Services: Advertising Agencies (1-4: 1)
Home Mortgage Disclosure Act Aggregated Statistics For Year 2009 (Based on 6 partial tracts)
A) FHA, FSA/RHS & VA Home Purchase Loans
B) Conventional Home Purchase Loans
C) Refinancings
D) Home Improvement Loans
F) Non-occupant Loans on < 5 Family Dwellings (A B C & D)
G) Loans On Manufactured Home Dwelling (A B C & D)
Number
Average Value
Number
Average Value
Number
Average Value
Number
Average Value
Number
Average Value
Number
Average Value
LOANS ORIGINATED
16
$177,602
21
$191,727
130
$185,296
11
$126,575
9
$177,262
2
$54,105
APPLICATIONS APPROVED, NOT ACCEPTED
0
$0
0
$0
15
$168,169
2
$107,360
0
$0
0
$0
APPLICATIONS DENIED
6
$116,530
4
$225,148
71
$214,294
7
$100,820
1
$237,990
6
$86,133
APPLICATIONS WITHDRAWN
3
$168,390
4
$223,392
30
$207,278
2
$75,330
2
$123,750
1
$148,990
FILES CLOSED FOR INCOMPLETENESS
0
$0
0
$0
11
$178,033
1
$164,050
0
$0
0
$0
Aggregated Statistics For Year 2008 (Based on 6 partial tracts)
A) FHA, FSA/RHS & VA Home Purchase Loans
B) Conventional Home Purchase Loans
C) Refinancings
D) Home Improvement Loans
F) Non-occupant Loans on < 5 Family Dwellings (A B C & D)
G) Loans On Manufactured Home Dwelling (A B C & D)
Number
Average Value
Number
Average Value
Number
Average Value
Number
Average Value
Number
Average Value
Number
Average Value
LOANS ORIGINATED
7
$204,629
24
$173,623
90
$182,932
16
$78,983
14
$193,302
5
$70,052
APPLICATIONS APPROVED, NOT ACCEPTED
1
$274,180
2
$212,840
18
$179,624
2
$48,945
1
$85,370
1
$97,090
APPLICATIONS DENIED
3
$152,147
8
$145,662
80
$200,265
16
$85,018
5
$234,040
4
$103,468
APPLICATIONS WITHDRAWN
0
$0
5
$199,566
29
$203,619
3
$209,283
1
$106,300
0
$0
FILES CLOSED FOR INCOMPLETENESS
2
$195,020
2
$97,930
10
$251,037
1
$144,040
2
$164,470
0
$0
Aggregated Statistics For Year 2007 (Based on 6 partial tracts)
A) FHA, FSA/RHS & VA Home Purchase Loans
B) Conventional Home Purchase Loans
C) Refinancings
D) Home Improvement Loans
F) Non-occupant Loans on < 5 Family Dwellings (A B C & D)
G) Loans On Manufactured Home Dwelling (A B C & D)
Number
Average Value
Number
Average Value
Number
Average Value
Number
Average Value
Number
Average Value
Number
Average Value
LOANS ORIGINATED
5
$182,182
62
$173,735
114
$168,289
27
$73,909
10
$187,743
9
$65,583
APPLICATIONS APPROVED, NOT ACCEPTED
0
$0
7
$161,330
27
$159,919
4
$32,248
0
$0
2
$51,875
APPLICATIONS DENIED
4
$177,342
14
$227,530
105
$188,493
19
$85,764
4
$224,805
5
$134,210
APPLICATIONS WITHDRAWN
0
$0
10
$175,549
55
$179,207
3
$123,287
3
$198,330
1
$56,930
FILES CLOSED FOR INCOMPLETENESS
0
$0
1
$174,310
16
$211,234
0
$0
0
$0
1
$128,900
Aggregated Statistics For Year 2006 (Based on 6 partial tracts)
A) FHA, FSA/RHS & VA Home Purchase Loans
B) Conventional Home Purchase Loans
C) Refinancings
D) Home Improvement Loans
F) Non-occupant Loans on < 5 Family Dwellings (A B C & D)
G) Loans On Manufactured Home Dwelling (A B C & D)
Number
Average Value
Number
Average Value
Number
Average Value
Number
Average Value
Number
Average Value
Number
Average Value
LOANS ORIGINATED
5
$198,388
101
$152,892
134
$159,753
36
$88,021
19
$180,002
11
$76,094
APPLICATIONS APPROVED, NOT ACCEPTED
0
$0
18
$186,659
31
$163,833
6
$49,768
3
$152,940
1
$37,670
APPLICATIONS DENIED
1
$160,700
24
$212,463
102
$159,951
28
$69,382
9
$124,462
7
$85,680
APPLICATIONS WITHDRAWN
1
$173,260
5
$164,998
53
$156,452
6
$89,573
1
$248,990
2
$69,235
FILES CLOSED FOR INCOMPLETENESS
0
$0
4
$130,830
17
$206,365
0
$0
3
$111,880
0
$0
Aggregated Statistics For Year 2005 (Based on 6 partial tracts)
A) FHA, FSA/RHS & VA Home Purchase Loans
B) Conventional Home Purchase Loans
C) Refinancings
D) Home Improvement Loans
F) Non-occupant Loans on < 5 Family Dwellings (A B C & D)
G) Loans On Manufactured Home Dwelling (A B C & D)
Number
Average Value
Number
Average Value
Number
Average Value
Number
Average Value
Number
Average Value
Number
Average Value
LOANS ORIGINATED
4
$211,980
113
$170,800
187
$145,297
29
$59,529
28
$150,138
12
$78,211
APPLICATIONS APPROVED, NOT ACCEPTED
0
$0
9
$147,612
31
$143,305
5
$94,550
2
$132,130
3
$119,413
APPLICATIONS DENIED
2
$168,655
17
$121,332
105
$142,340
27
$56,404
6
$123,548
12
$81,291
APPLICATIONS WITHDRAWN
0
$0
15
$177,398
65
$138,778
12
$101,037
2
$182,295
1
$95,020
FILES CLOSED FOR INCOMPLETENESS
0
$0
6
$107,400
41
$178,786
3
$51,907
1
$202,550
1
$167,170
Aggregated Statistics For Year 2004 (Based on 6 partial tracts)
A) FHA, FSA/RHS & VA Home Purchase Loans
B) Conventional Home Purchase Loans
C) Refinancings
D) Home Improvement Loans
E) Loans on Dwellings For 5+ Families
F) Non-occupant Loans on < 5 Family Dwellings (A B C & D)
G) Loans On Manufactured Home Dwelling (A B C & D)
Number
Average Value
Number
Average Value
Number
Average Value
Number
Average Value
Number
Average Value
Number
Average Value
Number
Average Value
LOANS ORIGINATED
4
$183,268
96
$158,064
220
$143,676
33
$85,519
0
$0
15
$118,234
9
$102,048
APPLICATIONS APPROVED, NOT ACCEPTED
0
$0
14
$184,109
31
$139,631
5
$66,322
0
$0
3
$98,513
3
$72,310
APPLICATIONS DENIED
1
$197,480
21
$136,719
76
$138,726
22
$59,838
1
$16,740
5
$134,758
4
$108,045
APPLICATIONS WITHDRAWN
0
$0
15
$176,664
52
$134,273
8
$92,308
0
$0
1
$108,810
1
$144,750
FILES CLOSED FOR INCOMPLETENESS
0
$0
2
$117,525
40
$161,331
3
$45,257
0
$0
0
$0
2
$116,640
Aggregated Statistics For Year 2003 (Based on 2 partial tracts)
B) Conventional Home Purchase Loans
C) Refinancings
D) Home Improvement Loans
F) Non-occupant Loans on < 5 Family Dwellings (A B C & D)
Number
Average Value
Number
Average Value
Number
Average Value
Number
Average Value
LOANS ORIGINATED
9
$207,498
39
$165,846
2
$77,430
1
$82,440
APPLICATIONS APPROVED, NOT ACCEPTED
2
$168,280
5
$188,836
0
$0
0
$0
APPLICATIONS DENIED
1
$236,220
8
$155,364
2
$82,580
0
$0
APPLICATIONS WITHDRAWN
0
$0
5
$150,300
0
$0
0
$0
FILES CLOSED FOR INCOMPLETENESS
0
$0
1
$43,800
0
$0
0
$0
Aggregated Statistics For Year 2002 (Based on 2 partial tracts)
A) FHA, FSA/RHS & VA Home Purchase Loans
B) Conventional Home Purchase Loans
C) Refinancings
D) Home Improvement Loans
Number
Average Value
Number
Average Value
Number
Average Value
Number
Average Value
LOANS ORIGINATED
1
$117,570
7
$187,709
26
$158,882
2
$40,275
APPLICATIONS APPROVED, NOT ACCEPTED
0
$0
1
$179,530
2
$182,180
0
$0
APPLICATIONS DENIED
0
$0
1
$136,140
5
$145,824
1
$18,980
APPLICATIONS WITHDRAWN
0
$0
1
$125,700
2
$200,415
0
$0
FILES CLOSED FOR INCOMPLETENESS
0
$0
0
$0
1
$164,890
0
$0
Aggregated Statistics For Year 2001 (Based on 2 partial tracts)
B) Conventional Home Purchase Loans
C) Refinancings
D) Home Improvement Loans
Number
Average Value
Number
Average Value
Number
Average Value
LOANS ORIGINATED
8
$203,214
18
$137,159
1
$51,800
APPLICATIONS APPROVED, NOT ACCEPTED
1
$166,790
2
$123,395
1
$27,120
APPLICATIONS DENIED
1
$276,760
5
$108,264
1
$26,170
APPLICATIONS WITHDRAWN
0
$0
3
$119,600
0
$0
FILES CLOSED FOR INCOMPLETENESS
0
$0
1
$119,460
0
$0
Aggregated Statistics For Year 2000 (Based on 2 partial tracts)
B) Conventional Home Purchase Loans
C) Refinancings
D) Home Improvement Loans
Number
Average Value
Number
Average Value
Number
Average Value
LOANS ORIGINATED
5
$145,688
4
$132,108
2
$22,375
APPLICATIONS APPROVED, NOT ACCEPTED
1
$179,400
1
$33,630
0
$0
APPLICATIONS DENIED
1
$85,160
1
$128,010
1
$29,700
APPLICATIONS WITHDRAWN
1
$93,560
2
$51,460
1
$18,170
FILES CLOSED FOR INCOMPLETENESS
0
$0
0
$0
0
$0
Aggregated Statistics For Year 1999 (Based on 1 partial tract)
2004 - 2018 National Fire Incident Reporting System (NFIRS) incidents
Based on the data from the years 2004 - 2018 the average number of fire incidents per year is 12. The highest number of fire incidents - 27 took place in 2010, and the least - 2 in 2006. The data has a constant trend.
When looking into fire subcategories, the most incidents belonged to: Structure Fires (64.1%), and Outside Fires (25.0%).
Fire incident types reported to NFIRS in Zip Code 03043


 Nearest zip codes: 03047, 03442, 03082, 03281, 03070, 03057.


 Based on the data from the years 2004 - 2018 the average number of fire incidents per year is 12. The highest number of fire incidents - 27 took place in 2010, and the least - 2 in 2006. The data has a constant trend.
 When looking into fire subcategories, the most incidents belonged to: Structure Fires (64.1%), and Outside Fires (25.0%).