Estimated zip code population in 2022: 3,444 Zip code population in 2010: 3,660 Zip code population in 2000: 3,242
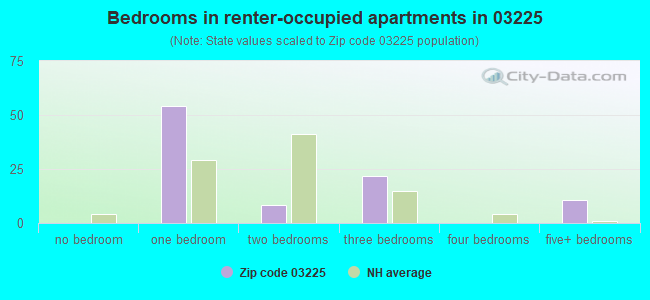
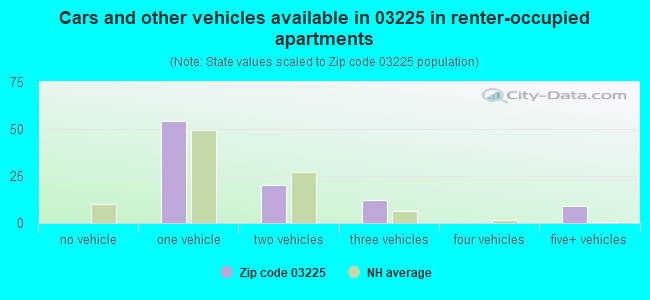
Houses and condos: 1,899 Renter-occupied apartments: 101
% of renters here:
8%
State:
28%
March 2022 cost of living index in zip code 03225: 99.5 (near average, U.S. average is 100)
Land area: 28.8 sq. mi. Water area: 1.7 sq. mi.
Population density: 120 people per square mile
(very low).
OSM Map
Google Map
MSN Map
OSM Map
General Map
Google Map
MSN Map
OSM Map
Google Map
MSN Map
OSM Map
Google Map
MSN Map
Please wait while loading the map...
Real estate property taxes paid for housing units in 2022:
This zip code:
1.8% ($5,434)
New Hampshire:
1.6% ($6,209)
Median real estate property taxes paid for housing units with mortgages in 2022: $5,114 (1.8%) Median real estate property taxes paid for housing units with no mortgage in 2022: $6,012 (1.7%)
Business Search- 14 Million verified businesses
Males: 1,617
(47.0%)
Females: 1,827
(53.0%)
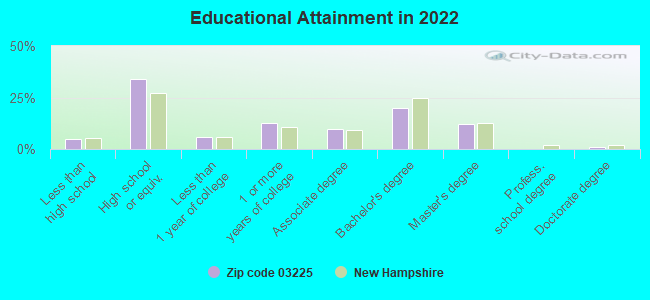
For population 25 years and over in 03225:
High school or higher: 95.5%
Bachelor's degree or higher: 33.3%
Graduate or professional degree: 13.1%
Unemployed: 1.6%
Mean travel time to work (commute): 34.3 minutes
For population 15 years and over in 03225:
Never married: 25.6%
Now married: 61.0%
Separated: 0.4%
Widowed: 4.0%
Divorced: 9.0%
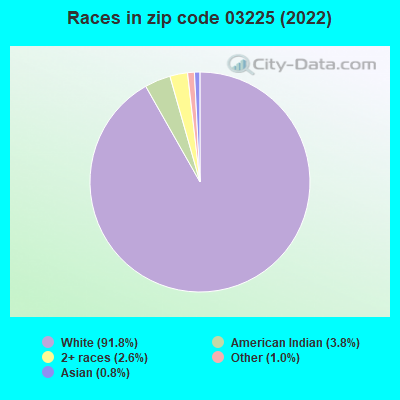
Zip code 03225 compared to state average:
Black race population percentage significantly below state average.
Hispanic race population percentage significantly below state average.
Foreign-born population percentage below state average.
Renting percentage significantly below state average.
Estimated median house/condo value in 2022: $304,816
03225:
$304,816
New Hampshire:
$384,700
According to our research of New Hampshire and other state lists, there were 4 registered sex offenders living in 03225 zip code as of May 26, 2024. The ratio of all residents to sex offenders in zip code 03225 is 921 to 1. The ratio of registered sex offenders to all residents in this zip code is lower than the state average.
Median resident age:
This zip code:
44.7 years
New Hampshire median age:
43.3 years
Average household size:
This zip code:
2.7 people
New Hampshire:
2.4 people
Averages for the 2020 tax year for zip code 03225, filed in 2021:
Average Adjusted Gross Income (AGI) in 2020: $67,826 (Individual Income Tax Returns)
Here:
$67,826
State:
$88,845
Salary/wage: $60,629 (reported on 85.5% of returns)
Here:
$60,629
State:
$71,693
(% of AGI for various income ranges: 1108.9% for AGIs below $25k, 3672.6% for AGIs $25k-50k, 6706.7% for AGIs $50k-75k, 9282.5% for AGIs $75k-100k, 15036.3% for AGIs $100k-200k)
Taxable interest for individuals: $459 (reported on 28.0% of returns)
This zip code:
$459
New Hampshire:
$1,640
(% of AGI for various income ranges: 11.7% for AGIs below $25k, 15.3% for AGIs $25k-50k, 17.0% for AGIs $50k-75k, 18.0% for AGIs $75k-100k, 18.3% for AGIs $100k-200k)
Ordinary dividends: $2,937 (reported on 15.0% of returns)
Here:
$2,937
State:
$8,258
(% of AGI for various income ranges: 28.6% for AGIs below $25k, 47.1% for AGIs $25k-50k, 37.8% for AGIs $50k-75k, 105.0% for AGIs $75k-100k, 47.1% for AGIs $100k-200k)
Net capital gain/loss in AGI: +$10,836 (reported on 12.5% of returns)
Here:
+$10,836
State:
+$28,952
(% of AGI for various income ranges: 15.1% for AGIs below $25k, 8.7% for AGIs $25k-50k, 36.3% for AGIs $50k-75k, 59.0% for AGIs $75k-100k, 330.0% for AGIs $100k-200k)
Profit/loss from business: +$21,624 (reported on 14.5% of returns)
Here:
+$21,624
State:
+$24,424
(% of AGI for various income ranges: 140.9% for AGIs below $25k, 188.7% for AGIs $25k-50k, 397.8% for AGIs $50k-75k, 480.0% for AGIs $75k-100k, 1261.2% for AGIs $100k-200k)
Taxable individual retirement arrangement distribution: $16,425 (reported on 8.0% of returns)
03225:
$16,425
New Hampshire:
$21,952
(% of AGI for various income ranges: 66.9% for AGIs below $25k, 73.7% for AGIs $25k-50k, 155.6% for AGIs $50k-75k, 242.5% for AGIs $75k-100k, 503.7% for AGIs $100k-200k)
Total itemized deductions: $26,080 (reported on 5.0% of returns)
Here:
$26,080
State:
$32,702
(% of AGI for various income ranges: 146.3% for AGIs $25k-50k, 282.6% for AGIs $50k-75k, 537.1% for AGIs $100k-200k)
Charity contributions: $4,033 (reported on 3.0% of returns)
Here:
$4,033
State:
$9,866
(% of AGI for various income ranges: 13.2% for AGIs $25k-50k, 80.0% for AGIs $100k-200k)
Taxes paid: $7,560 (reported on 5.0% of returns)
03225:
$7,560
State:
$8,247
(% of AGI for various income ranges: 42.9% for AGIs below $25k, 88.1% for AGIs $50k-75k, 153.3% for AGIs $100k-200k)
Earned income credit: $1,753 (reported on 9.5% of returns)
Here:
$1,753
State:
$1,831
(% of AGI for various income ranges: 50.6% for AGIs below $25k, 41.1% for AGIs $25k-50k)
Percentage of individuals using paid preparers for their 2020 taxes: 92.0%
Here:
92%
State:
92%
(% for various income ranges: 87.5% for AGIs below $25k, 93.6% for AGIs $25k-50k, 94.6% for AGIs $50k-75k, 92.6% for AGIs $75k-100k, 94.3% for AGIs $100k-200k, 83.3% for AGIs over 200k)
Averages for the 2012 tax year for zip code 03225, filed in 2013:
Average Adjusted Gross Income (AGI) in 2012: $49,305 (Individual Income Tax Returns)
Here:
$49,305
State:
$66,185
Salary/wage: $44,279 (reported on 86.1% of returns)
Here:
$44,279
State:
$55,674
(% of AGI for various income ranges: 74.3% for AGIs below $25k, 81.0% for AGIs $25k-50k, 80.2% for AGIs $50k-75k, 81.0% for AGIs $75k-100k, 71.0% for AGIs $100k-200k)
Taxable interest for individuals: $984 (reported on 26.0% of returns)
This zip code:
$984
New Hampshire:
$1,674
(% of AGI for various income ranges: 0.9% for AGIs below $25k, 0.4% for AGIs $25k-50k, 0.2% for AGIs $50k-75k, 0.5% for AGIs $75k-100k, 0.7% for AGIs $100k-200k)
Ordinary dividends: $2,481 (reported on 15.6% of returns)
Here:
$2,481
State:
$6,774
(% of AGI for various income ranges: 3.0% for AGIs below $25k, 0.8% for AGIs $25k-50k, 0.7% for AGIs $50k-75k, 0.3% for AGIs $75k-100k, 0.6% for AGIs $100k-200k)
Net capital gain/loss in AGI: +$2,417 (reported on 10.4% of returns)
Here:
+$2,417
State:
+$13,759
(% of AGI for various income ranges: 0.2% for AGIs $25k-50k, 1.6% for AGIs $100k-200k)
Profit/loss from business: +$12,013 (reported on 17.3% of returns)
Here:
+$12,013
State:
+$19,298
(% of AGI for various income ranges: 10.4% for AGIs below $25k, 5.7% for AGIs $25k-50k, 3.4% for AGIs $50k-75k, 3.7% for AGIs $75k-100k, 2.4% for AGIs $100k-200k)
Taxable individual retirement arrangement distribution: $19,693 (reported on 8.1% of returns)
03225:
$19,693
New Hampshire:
$16,908
(% of AGI for various income ranges: 2.8% for AGIs below $25k, 1.6% for AGIs $25k-50k, 2.2% for AGIs $50k-75k, 2.0% for AGIs $75k-100k, 6.1% for AGIs $100k-200k)
Total itemized deductions: $16,673 (24% of AGI, reported on 34.1% of returns)
Here:
$16,673
State:
$22,617
Here:
23.5% of AGI
State:
18.1% of AGI
(% of AGI for various income ranges: 11.3% for AGIs below $25k, 11.2% for AGIs $25k-50k, 12.3% for AGIs $50k-75k, 12.1% for AGIs $75k-100k, 10.9% for AGIs $100k-200k)
Charity contributions: $1,755 (reported on 22.0% of returns)
Here:
$1,755
State:
$2,860
(% of AGI for various income ranges: 0.4% for AGIs below $25k, 0.6% for AGIs $25k-50k, 0.8% for AGIs $50k-75k, 0.9% for AGIs $75k-100k, 0.9% for AGIs $100k-200k)
Taxes paid: $5,652 (reported on 32.4% of returns)
03225:
$5,652
State:
$8,830
(% of AGI for various income ranges: 3.5% for AGIs below $25k, 3.5% for AGIs $25k-50k, 4.0% for AGIs $50k-75k, 3.5% for AGIs $75k-100k, 3.9% for AGIs $100k-200k)
Earned income credit: $1,800 (reported on 15.0% of returns)
Here:
$1,800
State:
$1,863
(% of AGI for various income ranges: 4.1% for AGIs below $25k, 1.0% for AGIs $25k-50k)
Percentage of individuals using paid preparers for their 2012 taxes: 43.4%
Here:
43%
State:
45%
(% for various income ranges: 41.1% for AGIs below $25k, 41.2% for AGIs $25k-50k, 46.4% for AGIs $50k-75k, 45.0% for AGIs $75k-100k, 50.0% for AGIs $100k-200k)
Averages for the 2004 tax year for zip code 03225, filed in 2005:
Average Adjusted Gross Income (AGI) in 2004: $42,250 (Individual Income Tax Returns)
Here:
$42,250
State:
$54,348
Salary/wage: $38,898 (reported on 87.5% of returns)
Here:
$38,898
State:
$46,966
(% of AGI for various income ranges: 103.7% for AGIs below $10k, 74.4% for AGIs $10k-25k, 83.7% for AGIs $25k-50k, 85.5% for AGIs $50k-75k, 81.2% for AGIs $75k-100k, 67.1% for AGIs over 100k)
Taxable interest for individuals: $781 (reported on 41.7% of returns)
This zip code:
$781
New Hampshire:
$1,634
(% of AGI for various income ranges: 3.2% for AGIs below $10k, 1.4% for AGIs $10k-25k, 0.6% for AGIs $25k-50k, 0.8% for AGIs $50k-75k, 0.6% for AGIs $75k-100k, 0.5% for AGIs over 100k)
Taxable dividends: $1,376 (reported on 19.7% of returns)
Here:
$1,376
State:
$3,855
(% of AGI for various income ranges: 2.9% for AGIs below $10k, 0.3% for AGIs $10k-25k, 0.7% for AGIs $25k-50k, 0.4% for AGIs $50k-75k, 1.0% for AGIs $75k-100k, 0.6% for AGIs over 100k)
Net capital gain/loss: +$3,579 (reported on 15.3% of returns)
Here:
+$3,579
State:
+$13,739
(% of AGI for various income ranges: -4.4% for AGIs below $10k, -0.2% for AGIs $10k-25k, 0.7% for AGIs $25k-50k, 0.9% for AGIs $50k-75k, 2.0% for AGIs $75k-100k, 3.3% for AGIs over 100k)
Profit/loss from business: +$11,784 (reported on 19.2% of returns)
Here:
+$11,784
State:
+$16,641
(% of AGI for various income ranges: 9.6% for AGIs below $10k, 9.0% for AGIs $10k-25k, 6.2% for AGIs $25k-50k, 4.2% for AGIs $50k-75k, 2.7% for AGIs $75k-100k, 7.0% for AGIs over 100k)
IRA payment deduction: $2,592 (reported on 3.0% of returns)
03225:
$2,592
New Hampshire:
$3,013
Total itemized deductions: $15,457 (26% of AGI, reported on 36.9% of returns)
Here:
$15,457
State:
$18,832
Here:
25.6% of AGI
State:
19.6% of AGI
(% of AGI for various income ranges: 12.8% for AGIs below $10k, 14.4% for AGIs $10k-25k, 13.7% for AGIs $25k-50k, 13.2% for AGIs $50k-75k, 12.6% for AGIs $75k-100k, 14.5% for AGIs over 100k)
Charity contributions deductions: $1,472 (2% of AGI, reported on 28.4% of returns)
Here:
$1,472
State:
$2,473
Here:
2.3% of AGI
State:
2.4% of AGI
(% of AGI for various income ranges: 0.8% for AGIs $10k-25k, 1.0% for AGIs $25k-50k, 1.0% for AGIs $50k-75k, 1.2% for AGIs $75k-100k, 1.0% for AGIs over 100k)
Total tax: $4,930 (reported on 80.8% of returns)
03225:
$4,930
State:
$8,835
(% of AGI for various income ranges: 3.2% for AGIs below $10k, 5.3% for AGIs $10k-25k, 7.3% for AGIs $25k-50k, 8.4% for AGIs $50k-75k, 10.8% for AGIs $75k-100k, 15.5% for AGIs over 100k)
Earned income credit: $1,494 (reported on 10.9% of returns)
Here:
$1,494
State:
$1,447
Percentage of individuals using paid preparers for their 2004 taxes: 51.7%
Here:
52%
State:
51%
(% for various income ranges: 44.2% for AGIs below $10k, 49.5% for AGIs $10k-25k, 50.9% for AGIs $25k-50k, 53.6% for AGIs $50k-75k, 65.6% for AGIs $75k-100k, 55.3% for AGIs over 100k)
Household received Food Stamps/SNAP in the past 12 months: 37 Household did not receive Food Stamps/SNAP in the past 12 months: 1,226
Women who had a birth in the past 12 months: 36 (15 now married, 23 unmarried) Women who did not have a birth in the past 12 months: 655 (337 now married, 318 unmarried)
Housing units in zip code 03225 with a mortgage: 704 (45 second mortgage, 12 both second mortgage and home equity loan) Houses without a mortgage: 24
Median monthly owner costs for units with a mortgage: $1,883 Median monthly owner costs for units without a mortgage: $825
Residents with income below the poverty level in 2022:
This zip code:
3.6%
Whole state:
7.2%
Residents with income below 50% of the poverty level in 2022:
This zip code:
1.6%
Whole state:
3.7%
Median number of rooms in houses and condos:
Here:
6.2
State:
6.4
Median number of rooms in apartments:
Here:
3.9
State:
4.0
Notable locations in this zip code not listed on our city pages
Notable locations in zip code 03225: Camp Fatima (A), Shackford Corners (B), North Barnstead (C), Barnstead Fire Rescue Station 2 (D). Display/hide their locations on the map
Lakes and reservoirs: Brindle Pond (A), Huntress Pond (B), Lower Suncook Lake (C), Upper Suncook Lake (D), Locke Lake (E), Suncook Lake (F). Display/hide their locations on the map
Size of family households: 526 2-persons, 196 3-persons, 197 4-persons, 31 5-persons, 12 6-persons, 14 7-or-more-persons
Size of nonfamily households: 250 1-person, 32 2-persons
519 married couples with children.
88 single-parent households (55 men, 33 women).
98.3% of residents of 03225 zip code speak English at home.
1.1% of residents speak other Indo-European language at home (34% very well, 66% well).
0.8% of residents speak Asian or Pacific Island language at home (100% very well).
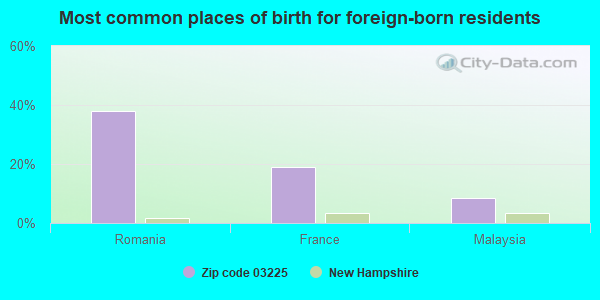
Foreign born population: 106 (3.1%) (54.4% of them are naturalized citizens)
This zip code:
3.1%
Whole state:
6.2%
38%Romania
19%France
9%Malaysia
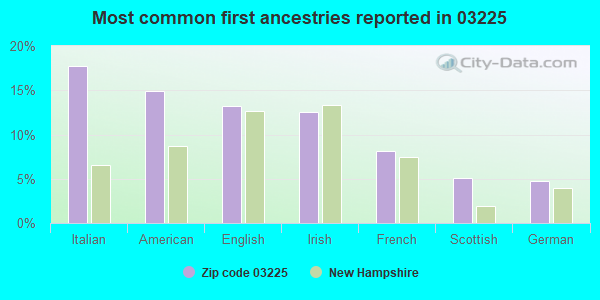
18%Italian
15%American
13%English
13%Irish
8%French
5%Scottish
5%German
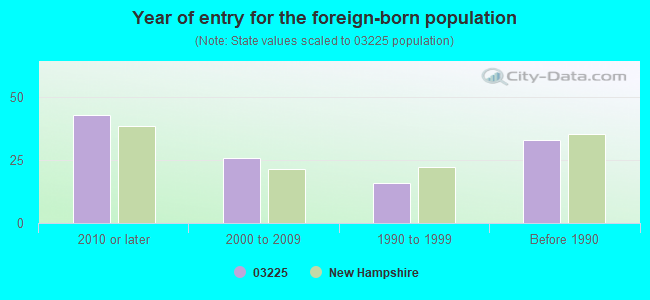
Year of entry for the foreign-born population
432010 or later
262000 to 2009
161990 to 1999
33Before 1990
Facilities with environmental interests located in this zip code:
TIMCO FOREST PRODUCTS PROCESSING CENTER (25 DEPOT STREET in CENTER BARNSTEAD, NH)
AIR MINOR (AIRS/AFS) (Integrated Compliance Information System) - ICIS-01-1997-0108, FORMAL ENFORCEMENT ACTION CRITERIA AND HAZARDOUS AIR POLLUTANT INVENTORY (Inventory of air pollution sources) (Resource Conservation and Recovery Act (tracking hazardous waste)) Business SIC classification: NAILED AND LOCK CORNER WOOD BOXES AND SHOOK; WOOD CONTAINERS; WOOD PRODUCTS Alternative names: TIMCO INC
BARNSTEAD ELEMENTARY SCHOOL (91 MAPLE STREET in CENTER BARNSTEAD, NH)
COMPLIANCE ACTIVITY (Tracking inspections of insecticide, fungicide, and rodenticide, and toxic substances) (National Center for Education Statistics) - STATE ID-05103103122485 Organizations: BARNSTEAD SCHOOL DISTRICT (SCHOOL DISTRICT)
Alternative names: BARNSTEAD ELEM - PRE SCH PRG
Housing units lacking complete plumbing facilities: 0.7% Housing units lacking complete kitchen facilities: 0.7%
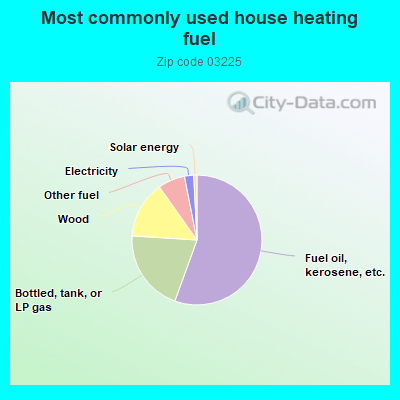
55.6%Fuel oil, kerosene, etc.
20.5%Bottled, tank, or LP gas
14.2%Wood
6.7%Other fuel
2.3%Electricity
0.8%Solar energy
Population in 1990: 2,307. Population change in the 1990s: +935 (+40.5%).
Place of birth for U.S.-born residents:
This state: 1,660
Northeast: 1,356
Midwest: 69
South: 149
West: 84
57% of the 03225 zip code residents lived in the same house 5 years ago. Out of people who lived in different houses, 23% lived in this county. Out of people who lived in different counties, 50% lived in New Hampshire.
94% of the 03225 zip code residents lived in the same house 1 year ago. Out of people who lived in different houses, 41% moved from this county. Out of people who lived in different houses, 45% moved from different county within same state. Out of people who lived in different houses, 19% moved from different state.
Private vs. public school enrollment:
Students in private schools in grades 1 to 8 (elementary and middle school): 93
Here:
22.1%
New Hampshire:
11.4%
Students in private schools in grades 9 to 12 (high school): 19
Here:
13.0%
New Hampshire:
14.0%
Students in private undergraduate colleges: 11
Here:
24.8%
New Hampshire:
38.0%
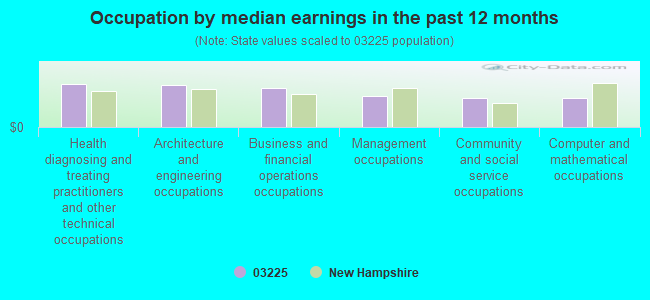
Occupation by median earnings in the past 12 months ($)
99,955Health diagnosing and treating practitioners and other technical occupations
98,554Architecture and engineering occupations
90,376Business and financial operations occupations
73,134Management occupations
68,320Community and social service occupations
67,910Computer and mathematical occupations
Companies with federal contracts located in this zip code:
HAMPSTEAD PLAYERS INC (1053 NORTH BARNSTEAD ROAD in CENTER BARNSTE, NH; small business) : $3,722 in 2 contractsin 2001
$2,700 with Army for Education Services. Taking place in AL. Signed on 2001-11-29. Completion date: 2002-05-10.
$1,022, same as above.Signed on 2001-11-09. Completion date: 2002-05-08.
Top industries in this zip code by the number of employees in 2005:
Arts, Entertainment, and Recreation: Theater Companies and Dinner Theaters (10-19 employees: 1 establishment, 1-4 employees: 1 establishment)
Accommodation and Food Services: Full-Service Restaurants (10-19: 1)
Other Services (except Public Administration): Other Similar Organizations (except Business, Professional, Labor, and Political Organizations) (5-9: 1)
Information: Internet Service Providers (5-9: 1)
Construction: Masonry Contractors (1-4: 3)
Construction: Plumbing, Heating, and Air-Conditioning Contractors (1-4: 2)
Accommodation and Food Services: Snack and Nonalcoholic Beverage Bars (1-4: 2)
Fatal accident statistics in 2013:
Fatal accident count: 1
Vehicles involved in fatal accidents: 1
Fatal accidents caused by drunken drivers: 1
Fatalities: 1
Persons involved in fatal accidents: 1
Pedestrians involved in fatal accidents: 0
Fatal accident statistics in 2012:
Fatal accident count: 1
Vehicles involved in fatal accidents: 1
Fatal accidents caused by drunken drivers: 0
Fatalities: 1
Persons involved in fatal accidents: 1
Pedestrians involved in fatal accidents: 0
Home Mortgage Disclosure Act Aggregated Statistics For Year 2009 (Based on 2 partial tracts)
A) FHA, FSA/RHS & VA Home Purchase Loans
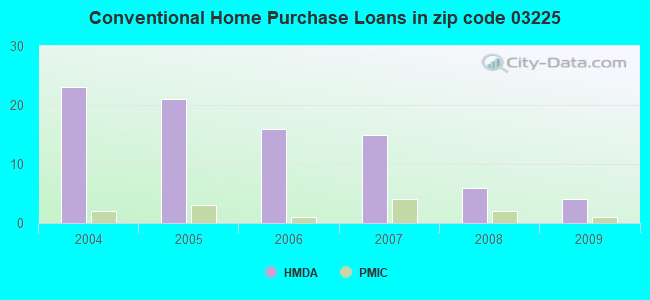
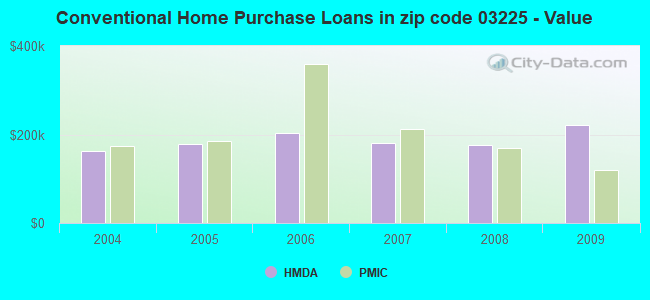
B) Conventional Home Purchase Loans
C) Refinancings
D) Home Improvement Loans
F) Non-occupant Loans on < 5 Family Dwellings (A B C & D)
G) Loans On Manufactured Home Dwelling (A B C & D)
Number
Average Value
Number
Average Value
Number
Average Value
Number
Average Value
Number
Average Value
Number
Average Value
LOANS ORIGINATED
4
$222,232
4
$220,812
34
$180,904
5
$126,298
2
$215,880
1
$66,680
APPLICATIONS APPROVED, NOT ACCEPTED
0
$0
0
$0
3
$131,360
0
$0
0
$0
0
$0
APPLICATIONS DENIED
1
$301,390
1
$290,330
12
$176,983
2
$57,555
1
$194,650
1
$13,460
APPLICATIONS WITHDRAWN
1
$122,290
1
$276,570
10
$217,283
0
$0
0
$0
0
$0
FILES CLOSED FOR INCOMPLETENESS
0
$0
0
$0
1
$146,510
0
$0
0
$0
0
$0
Aggregated Statistics For Year 2008 (Based on 2 partial tracts)
A) FHA, FSA/RHS & VA Home Purchase Loans
B) Conventional Home Purchase Loans
C) Refinancings
D) Home Improvement Loans
F) Non-occupant Loans on < 5 Family Dwellings (A B C & D)
G) Loans On Manufactured Home Dwelling (A B C & D)
Number
Average Value
Number
Average Value
Number
Average Value
Number
Average Value
Number
Average Value
Number
Average Value
LOANS ORIGINATED
2
$205,415
6
$176,210
19
$174,034
3
$72,457
1
$324,710
1
$181,190
APPLICATIONS APPROVED, NOT ACCEPTED
0
$0
1
$197,640
4
$177,232
1
$18,840
1
$100,760
1
$40,360
APPLICATIONS DENIED
1
$118,100
0
$0
17
$200,735
2
$95,230
1
$281,060
1
$78,640
APPLICATIONS WITHDRAWN
0
$0
0
$0
6
$212,240
1
$152,190
0
$0
0
$0
FILES CLOSED FOR INCOMPLETENESS
0
$0
0
$0
1
$210,790
0
$0
0
$0
0
$0
Aggregated Statistics For Year 2007 (Based on 2 partial tracts)
A) FHA, FSA/RHS & VA Home Purchase Loans
B) Conventional Home Purchase Loans
C) Refinancings
D) Home Improvement Loans
F) Non-occupant Loans on < 5 Family Dwellings (A B C & D)
G) Loans On Manufactured Home Dwelling (A B C & D)
Number
Average Value
Number
Average Value
Number
Average Value
Number
Average Value
Number
Average Value
Number
Average Value
LOANS ORIGINATED
0
$0
15
$180,317
24
$159,467
7
$71,119
4
$178,578
2
$67,575
APPLICATIONS APPROVED, NOT ACCEPTED
0
$0
2
$230,975
4
$219,540
1
$14,050
0
$0
0
$0
APPLICATIONS DENIED
1
$134,250
3
$143,920
22
$182,200
5
$83,540
3
$208,003
1
$145,910
APPLICATIONS WITHDRAWN
0
$0
1
$148,600
9
$179,799
1
$38,570
1
$191,960
0
$0
FILES CLOSED FOR INCOMPLETENESS
0
$0
1
$74,750
2
$251,010
0
$0
0
$0
0
$0
Aggregated Statistics For Year 2006 (Based on 2 partial tracts)
A) FHA, FSA/RHS & VA Home Purchase Loans
B) Conventional Home Purchase Loans
C) Refinancings
D) Home Improvement Loans
F) Non-occupant Loans on < 5 Family Dwellings (A B C & D)
G) Loans On Manufactured Home Dwelling (A B C & D)
Number
Average Value
Number
Average Value
Number
Average Value
Number
Average Value
Number
Average Value
Number
Average Value
LOANS ORIGINATED
1
$183,590
16
$203,208
31
$153,281
9
$56,478
1
$267,600
2
$117,805
APPLICATIONS APPROVED, NOT ACCEPTED
0
$0
3
$224,150
6
$186,477
1
$20,630
0
$0
0
$0
APPLICATIONS DENIED
0
$0
3
$155,280
17
$164,907
7
$65,993
1
$154,880
1
$46,340
APPLICATIONS WITHDRAWN
0
$0
1
$381,220
16
$198,723
2
$102,555
0
$0
0
$0
FILES CLOSED FOR INCOMPLETENESS
0
$0
0
$0
6
$164,998
1
$90,300
1
$81,330
0
$0
Aggregated Statistics For Year 2005 (Based on 2 partial tracts)
A) FHA, FSA/RHS & VA Home Purchase Loans
B) Conventional Home Purchase Loans
C) Refinancings
D) Home Improvement Loans
F) Non-occupant Loans on < 5 Family Dwellings (A B C & D)
G) Loans On Manufactured Home Dwelling (A B C & D)
Number
Average Value
Number
Average Value
Number
Average Value
Number
Average Value
Number
Average Value
Number
Average Value
LOANS ORIGINATED
1
$177,010
21
$178,147
54
$159,190
10
$84,467
3
$243,983
2
$155,180
APPLICATIONS APPROVED, NOT ACCEPTED
0
$0
3
$171,127
5
$167,022
1
$51,430
0
$0
0
$0
APPLICATIONS DENIED
0
$0
4
$168,562
19
$148,257
8
$55,390
1
$4,780
2
$104,050
APPLICATIONS WITHDRAWN
0
$0
2
$242,040
19
$185,049
4
$55,240
0
$0
0
$0
FILES CLOSED FOR INCOMPLETENESS
0
$0
1
$316,640
10
$161,550
0
$0
0
$0
0
$0
Aggregated Statistics For Year 2004 (Based on 2 partial tracts)
A) FHA, FSA/RHS & VA Home Purchase Loans
B) Conventional Home Purchase Loans
C) Refinancings
D) Home Improvement Loans
F) Non-occupant Loans on < 5 Family Dwellings (A B C & D)
G) Loans On Manufactured Home Dwelling (A B C & D)
Detailed PMIC statistics for the following Tracts:0860.00
2002 - 2018 National Fire Incident Reporting System (NFIRS) incidents
According to the data from the years 2002 - 2018 the average number of fire incidents per year is 28. The highest number of fires - 49 took place in 2002, and the least - 4 in 2003. The data has a decreasing trend.
When looking into fire subcategories, the most incidents belonged to: Structure Fires (51.0%), and Outside Fires (30.1%).
Fire incident types reported to NFIRS in Zip Code 03225


 Nearest zip codes: 03218, 03263, 03809, 03884, 03837, 03855.
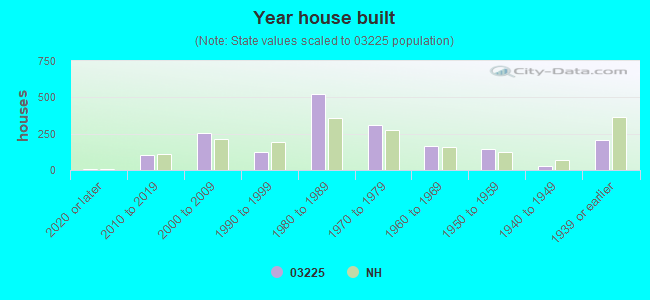


 According to the data from the years 2002 - 2018 the average number of fire incidents per year is 28. The highest number of fires - 49 took place in 2002, and the least - 4 in 2003. The data has a decreasing trend.
 When looking into fire subcategories, the most incidents belonged to: Structure Fires (51.0%), and Outside Fires (30.1%).