Estimated median house/condo value in 2022: $343,503
03852:
$343,503
New Hampshire:
$384,700
According to our research of New Hampshire and other state lists, there were 3 registered sex offenders living in 03852 zip code as of June 20, 2024. The ratio of all residents to sex offenders in zip code 03852 is 211 to 1.
Median resident age:
This zip code:
49.6 years
New Hampshire median age:
43.3 years
Average household size:
This zip code:
2.8 people
New Hampshire:
2.4 people
Averages for the 2020 tax year for zip code 03852, filed in 2021:
Average Adjusted Gross Income (AGI) in 2020: $62,262 (Individual Income Tax Returns)
Here:
$62,262
State:
$88,845
Salary/wage: $53,786 (reported on 87.5% of returns)
Here:
$53,786
State:
$71,693
(% of AGI for various income ranges: 1370.0% for AGIs below $25k, 3491.4% for AGIs $25k-50k, 6752.0% for AGIs $50k-75k, 9003.3% for AGIs $75k-100k, 14635.0% for AGIs $100k-200k)
Taxable interest for individuals: $356 (reported on 28.1% of returns)
This zip code:
$356
New Hampshire:
$1,640
(% of AGI for various income ranges: 30.0% for AGIs below $25k, 20.0% for AGIs $50k-75k, 17.5% for AGIs $100k-200k)
Ordinary dividends: $1,225 (reported on 12.5% of returns)
Here:
$1,225
State:
$8,258
(% of AGI for various income ranges: 163.3% for AGIs $75k-100k)
Net capital gain/loss in AGI: +$5,067 (reported on 9.4% of returns)
Here:
+$5,067
State:
+$28,952
(% of AGI for various income ranges: 304.0% for AGIs $50k-75k)
Profit/loss from business: +$4,967 (reported on 9.4% of returns)
Here:
+$4,967
State:
+$24,424
(% of AGI for various income ranges: 212.9% for AGIs $25k-50k)
Taxable individual retirement arrangement distribution: $15,267 (reported on 9.4% of returns)
03852:
$15,267
New Hampshire:
$21,952
(% of AGI for various income ranges: 916.0% for AGIs $50k-75k)
Earned income credit: $2,025 (reported on 12.5% of returns)
Here:
$2,025
State:
$1,831
(% of AGI for various income ranges: 82.0% for AGIs below $25k, 57.1% for AGIs $25k-50k)
Percentage of individuals using paid preparers for their 2020 taxes: 90.6%
Here:
91%
State:
92%
(% for various income ranges: 100.0% for AGIs below $25k, 88.9% for AGIs $25k-50k, 85.7% for AGIs $50k-75k, 75.0% for AGIs $75k-100k, 100.0% for AGIs $100k-200k)
Averages for the 2012 tax year for zip code 03852, filed in 2013:
Average Adjusted Gross Income (AGI) in 2012: $51,589 (Individual Income Tax Returns)
Here:
$51,589
State:
$66,185
Salary/wage: $44,596 (reported on 89.3% of returns)
Here:
$44,596
State:
$55,674
(% of AGI for various income ranges: 75.8% for AGIs below $25k, 80.6% for AGIs $25k-50k, 79.9% for AGIs $50k-75k, 79.6% for AGIs $75k-100k, 71.9% for AGIs $100k-200k)
Taxable interest for individuals: $333 (reported on 21.4% of returns)
This zip code:
$333
New Hampshire:
$1,674
Ordinary dividends: $2,550 (reported on 14.3% of returns)
Here:
$2,550
State:
$6,774
Net capital gain/loss in AGI: +$850 (reported on 7.1% of returns)
Here:
+$850
State:
+$13,759
Profit/loss from business: +$4,575 (reported on 14.3% of returns)
Here:
+$4,575
State:
+$19,298
Taxable individual retirement arrangement distribution: $5,200 (reported on 10.7% of returns)
03852:
$5,200
New Hampshire:
$16,908
Total itemized deductions: $17,711 (22% of AGI, reported on 32.1% of returns)
Here:
$17,711
State:
$22,617
Here:
22.1% of AGI
State:
18.1% of AGI
(% of AGI for various income ranges: 25.9% for AGIs below $25k, 13.2% for AGIs $50k-75k, 11.3% for AGIs $75k-100k, 12.3% for AGIs $100k-200k)
Charity contributions: $2,083 (reported on 21.4% of returns)
Here:
$2,083
State:
$2,860
Taxes paid: $6,888 (reported on 28.6% of returns)
03852:
$6,888
State:
$8,830
(% of AGI for various income ranges: 7.3% for AGIs below $25k, 3.7% for AGIs $50k-75k, 4.5% for AGIs $75k-100k, 4.9% for AGIs $100k-200k)
Earned income credit: $2,350 (reported on 14.3% of returns)
Here:
$2,350
State:
$1,863
(% of AGI for various income ranges: 8.0% for AGIs below $25k)
Percentage of individuals using paid preparers for their 2012 taxes: 50.0%
Here:
50%
State:
45%
(% for various income ranges: 44.4% for AGIs below $25k, 50.0% for AGIs $25k-50k, 40.0% for AGIs $50k-75k, 133.3% for AGIs $75k-100k)
Averages for the 2004 tax year for zip code 03852, filed in 2005:
Average Adjusted Gross Income (AGI) in 2004: $37,075 (Individual Income Tax Returns)
Here:
$37,075
State:
$54,348
Salary/wage: $34,634 (reported on 82.4% of returns)
Here:
$34,634
State:
$46,966
(% of AGI for various income ranges: 87.5% for AGIs below $10k, 67.2% for AGIs $10k-25k, 75.8% for AGIs $25k-50k, 81.6% for AGIs $50k-75k, 126.9% for AGIs $75k-100k)
Taxable interest for individuals: $637 (reported on 42.5% of returns)
This zip code:
$637
New Hampshire:
$1,634
(% of AGI for various income ranges: 1.7% for AGIs below $10k, 0.9% for AGIs $10k-25k, 1.4% for AGIs $25k-50k, 0.5% for AGIs $50k-75k, 0.3% for AGIs $75k-100k)
Taxable dividends: $636 (reported on 13.8% of returns)
Here:
$636
State:
$3,855
Net capital gain/loss: +$6,273 (reported on 10.4% of returns)
Here:
+$6,273
State:
+$13,739
Profit/loss from business: +$11,684 (reported on 17.9% of returns)
Here:
+$11,684
State:
+$16,641
(% of AGI for various income ranges: 9.9% for AGIs below $10k, 14.3% for AGIs $10k-25k, 9.4% for AGIs $25k-50k, 4.2% for AGIs $50k-75k)
IRA payment deduction: $3,000 (reported on 3.5% of returns)
03852:
$3,000
New Hampshire:
$3,013
Total itemized deductions: $13,750 (23% of AGI, reported on 31.4% of returns)
Here:
$13,750
State:
$18,832
Here:
22.6% of AGI
State:
19.6% of AGI
Charity contributions deductions: $1,813 (3% of AGI, reported on 23.6% of returns)
Here:
$1,813
State:
$2,473
Here:
2.8% of AGI
State:
2.4% of AGI
Total tax: $4,457 (reported on 77.7% of returns)
03852:
$4,457
State:
$8,835
(% of AGI for various income ranges: 2.2% for AGIs below $10k, 5.8% for AGIs $10k-25k, 7.3% for AGIs $25k-50k, 9.3% for AGIs $50k-75k, 11.4% for AGIs $75k-100k, 15.9% for AGIs over 100k)
Earned income credit: $1,897 (reported on 12.3% of returns)
Here:
$1,897
State:
$1,447
Percentage of individuals using paid preparers for their 2004 taxes: 48.4%
Here:
48%
State:
51%
(% for various income ranges: 33.3% for AGIs below $10k, 44.7% for AGIs $10k-25k, 48.8% for AGIs $25k-50k, 56.5% for AGIs $50k-75k, 100.0% for AGIs $75k-100k)
Household received Food Stamps/SNAP in the past 12 months: 8 Household did not receive Food Stamps/SNAP in the past 12 months: 104
Women who did not have a birth in the past 12 months: 82 (40 now married, 41 unmarried)
Housing units in zip code 03852 with a mortgage: 81 Median monthly owner costs for units with a mortgage: $1,468 Median monthly owner costs for units without a mortgage: $669
Residents with income below the poverty level in 2022:
This zip code:
5.1%
Whole state:
7.2%
Median number of rooms in houses and condos:
Here:
6.4
State:
6.4
Notable locations in this zip code not listed on our city pages
SUPERFUND (Superfund database) Alternative names: BRANCH ROAD LANDFILL
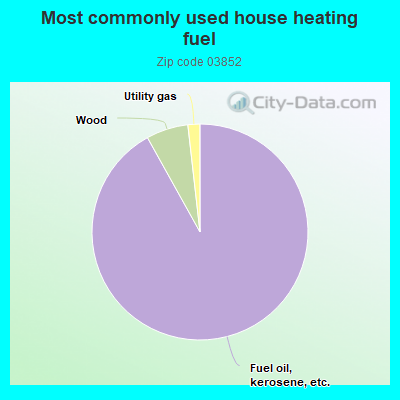
92.3%Fuel oil, kerosene, etc.
6.3%Wood
1.8%Utility gas
Population in 1990: 514. Population change in the 1990s: +20 (+3.9%).
Place of birth for U.S.-born residents:
This state: 124
Northeast: 152
South: 32
West: 8
86% of the 03852 zip code residents lived in the same house 5 years ago. Out of people who lived in different houses, 62% lived in this county. Out of people who lived in different counties, 50% lived in New Hampshire.
85% of the 03852 zip code residents lived in the same house 1 year ago. Out of people who lived in different houses, 69% moved from this county. Out of people who lived in different houses, 15% moved from different county within same state.
Private vs. public school enrollment:
Students in private schools in grades 1 to 8 (elementary and middle school):
Here:
0.0%
New Hampshire:
11.4%
Students in private schools in grades 9 to 12 (high school):
Here:
0.0%
New Hampshire:
14.0%
Students in private undergraduate colleges: 2
Here:
100.0%
New Hampshire:
38.0%
Occupation by median earnings in the past 12 months ($)
60,872Sales and related occupations
38,721Office and administrative support occupations
Top industries in this zip code by the number of employees in 2005:
Health Care and Social Assistance: Offices of Physicians (except Mental Health Specialists) (1-4 employees: 1 establishment)
Administrative and Support and Waste Management and Remediation Services: Landscaping Services (1-4: 1)
Construction: New Single-Family Housing Construction (except Operative Builders) (1-4: 1)
Health Care and Social Assistance: Offices of All Other Miscellaneous Health Practitioners (1-4: 1)
Construction: Electrical Contractors (1-4: 1)
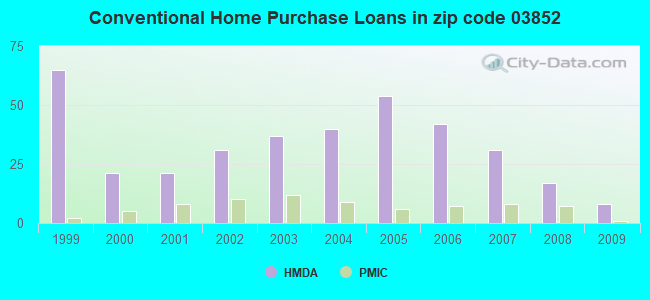
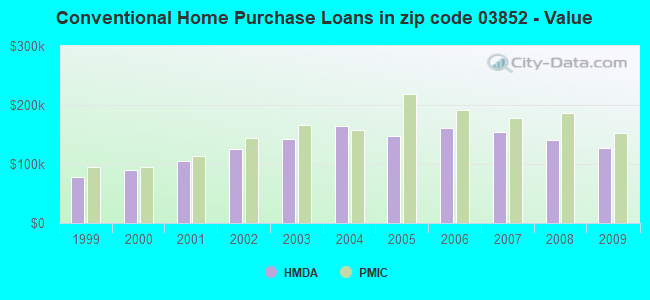
Home Mortgage Disclosure Act Aggregated Statistics For Year 2009 (Based on 2 partial tracts)
A) FHA, FSA/RHS & VA Home Purchase Loans
B) Conventional Home Purchase Loans
C) Refinancings
D) Home Improvement Loans
F) Non-occupant Loans on < 5 Family Dwellings (A B C & D)
G) Loans On Manufactured Home Dwelling (A B C & D)
Number
Average Value
Number
Average Value
Number
Average Value
Number
Average Value
Number
Average Value
Number
Average Value
LOANS ORIGINATED
12
$166,620
8
$127,938
40
$171,443
2
$57,675
6
$157,305
3
$103,327
APPLICATIONS APPROVED, NOT ACCEPTED
1
$127,240
1
$84,040
3
$93,023
0
$0
0
$0
0
$0
APPLICATIONS DENIED
2
$179,965
2
$63,820
28
$157,937
3
$9,647
1
$170,450
5
$109,882
APPLICATIONS WITHDRAWN
2
$103,855
2
$87,010
13
$172,769
0
$0
1
$54,700
1
$115,750
FILES CLOSED FOR INCOMPLETENESS
0
$0
1
$25,370
2
$195,425
0
$0
0
$0
0
$0
Aggregated Statistics For Year 2008 (Based on 2 partial tracts)
A) FHA, FSA/RHS & VA Home Purchase Loans
B) Conventional Home Purchase Loans
C) Refinancings
D) Home Improvement Loans
F) Non-occupant Loans on < 5 Family Dwellings (A B C & D)
G) Loans On Manufactured Home Dwelling (A B C & D)
Number
Average Value
Number
Average Value
Number
Average Value
Number
Average Value
Number
Average Value
Number
Average Value
LOANS ORIGINATED
6
$200,975
17
$140,559
33
$161,275
10
$55,337
5
$221,588
6
$96,392
APPLICATIONS APPROVED, NOT ACCEPTED
1
$136,360
2
$171,840
6
$171,575
0
$0
1
$263,210
1
$121,690
APPLICATIONS DENIED
1
$185,910
2
$191,860
31
$172,025
9
$67,432
1
$208,510
3
$106,237
APPLICATIONS WITHDRAWN
0
$0
1
$243,790
11
$166,308
2
$229,910
0
$0
0
$0
FILES CLOSED FOR INCOMPLETENESS
0
$0
0
$0
2
$118,325
0
$0
0
$0
0
$0
Aggregated Statistics For Year 2007 (Based on 2 partial tracts)
A) FHA, FSA/RHS & VA Home Purchase Loans
B) Conventional Home Purchase Loans
C) Refinancings
D) Home Improvement Loans
F) Non-occupant Loans on < 5 Family Dwellings (A B C & D)
G) Loans On Manufactured Home Dwelling (A B C & D)
Number
Average Value
Number
Average Value
Number
Average Value
Number
Average Value
Number
Average Value
Number
Average Value
LOANS ORIGINATED
2
$148,850
31
$153,867
33
$156,686
15
$65,829
7
$158,164
6
$92,493
APPLICATIONS APPROVED, NOT ACCEPTED
1
$143,500
4
$154,100
10
$167,122
3
$106,897
2
$192,055
0
$0
APPLICATIONS DENIED
1
$139,140
8
$170,501
37
$184,347
13
$41,744
4
$179,768
5
$107,186
APPLICATIONS WITHDRAWN
0
$0
4
$177,588
19
$166,488
3
$43,867
1
$223,170
0
$0
FILES CLOSED FOR INCOMPLETENESS
0
$0
0
$0
4
$206,325
0
$0
0
$0
0
$0
Aggregated Statistics For Year 2006 (Based on 2 partial tracts)
A) FHA, FSA/RHS & VA Home Purchase Loans
B) Conventional Home Purchase Loans
C) Refinancings
D) Home Improvement Loans
F) Non-occupant Loans on < 5 Family Dwellings (A B C & D)
G) Loans On Manufactured Home Dwelling (A B C & D)
Number
Average Value
Number
Average Value
Number
Average Value
Number
Average Value
Number
Average Value
Number
Average Value
LOANS ORIGINATED
3
$191,330
42
$160,872
48
$155,645
18
$56,179
8
$183,731
5
$96,800
APPLICATIONS APPROVED, NOT ACCEPTED
0
$0
5
$159,274
10
$163,674
3
$57,477
2
$238,635
0
$0
APPLICATIONS DENIED
1
$110,200
13
$154,840
36
$157,415
15
$56,474
3
$181,550
5
$59,778
APPLICATIONS WITHDRAWN
0
$0
4
$132,100
26
$127,397
4
$94,838
2
$117,135
1
$114,960
FILES CLOSED FOR INCOMPLETENESS
0
$0
0
$0
7
$153,407
0
$0
0
$0
0
$0
Aggregated Statistics For Year 2005 (Based on 2 partial tracts)
A) FHA, FSA/RHS & VA Home Purchase Loans
B) Conventional Home Purchase Loans
C) Refinancings
D) Home Improvement Loans
E) Loans on Dwellings For 5+ Families
F) Non-occupant Loans on < 5 Family Dwellings (A B C & D)
G) Loans On Manufactured Home Dwelling (A B C & D)
Number
Average Value
Number
Average Value
Number
Average Value
Number
Average Value
Number
Average Value
Number
Average Value
Number
Average Value
LOANS ORIGINATED
1
$268,760
54
$147,644
81
$144,309
12
$48,988
1
$450,310
10
$169,620
5
$78,488
APPLICATIONS APPROVED, NOT ACCEPTED
0
$0
3
$78,223
10
$164,585
3
$30,920
0
$0
1
$74,130
1
$78,880
APPLICATIONS DENIED
0
$0
19
$99,371
38
$151,957
11
$51,280
0
$0
2
$94,145
8
$74,275
APPLICATIONS WITHDRAWN
0
$0
6
$99,893
34
$150,061
2
$183,335
0
$0
3
$193,973
2
$118,325
FILES CLOSED FOR INCOMPLETENESS
0
$0
1
$208,510
14
$167,366
0
$0
0
$0
0
$0
0
$0
Aggregated Statistics For Year 2004 (Based on 2 partial tracts)
A) FHA, FSA/RHS & VA Home Purchase Loans
B) Conventional Home Purchase Loans
C) Refinancings
D) Home Improvement Loans
F) Non-occupant Loans on < 5 Family Dwellings (A B C & D)
G) Loans On Manufactured Home Dwelling (A B C & D)
Number
Average Value
Number
Average Value
Number
Average Value
Number
Average Value
Number
Average Value
Number
Average Value
LOANS ORIGINATED
2
$127,445
40
$165,140
77
$130,035
22
$53,298
8
$179,619
7
$77,071
APPLICATIONS APPROVED, NOT ACCEPTED
0
$0
4
$113,470
17
$121,485
4
$33,892
2
$157,175
1
$90,380
APPLICATIONS DENIED
2
$179,175
15
$103,936
32
$135,916
11
$34,198
3
$156,447
10
$54,584
APPLICATIONS WITHDRAWN
1
$130,020
6
$156,908
36
$139,720
3
$72,540
1
$235,070
3
$111,520
FILES CLOSED FOR INCOMPLETENESS
0
$0
1
$164,510
8
$118,176
0
$0
0
$0
1
$52,320
Aggregated Statistics For Year 2003 (Based on 2 partial tracts)
A) FHA, FSA/RHS & VA Home Purchase Loans
B) Conventional Home Purchase Loans
C) Refinancings
D) Home Improvement Loans
F) Non-occupant Loans on < 5 Family Dwellings (A B C & D)
Number
Average Value
Number
Average Value
Number
Average Value
Number
Average Value
Number
Average Value
LOANS ORIGINATED
2
$149,245
37
$143,036
134
$115,417
11
$59,352
12
$148,122
APPLICATIONS APPROVED, NOT ACCEPTED
0
$0
6
$134,710
21
$120,204
4
$53,910
1
$115,350
APPLICATIONS DENIED
0
$0
10
$66,159
47
$112,139
13
$44,122
2
$162,720
APPLICATIONS WITHDRAWN
0
$0
4
$98,802
25
$123,280
2
$52,525
1
$187,890
FILES CLOSED FOR INCOMPLETENESS
0
$0
1
$118,920
4
$98,902
1
$31,710
1
$51,530
Aggregated Statistics For Year 2002 (Based on 2 partial tracts)
A) FHA, FSA/RHS & VA Home Purchase Loans
B) Conventional Home Purchase Loans
C) Refinancings
D) Home Improvement Loans
F) Non-occupant Loans on < 5 Family Dwellings (A B C & D)
Number
Average Value
Number
Average Value
Number
Average Value
Number
Average Value
Number
Average Value
LOANS ORIGINATED
4
$128,532
31
$124,981
73
$102,966
9
$32,726
7
$104,706
APPLICATIONS APPROVED, NOT ACCEPTED
0
$0
4
$51,532
11
$77,226
3
$32,240
0
$0
APPLICATIONS DENIED
1
$116,540
13
$61,503
25
$92,932
8
$38,451
1
$139,140
APPLICATIONS WITHDRAWN
0
$0
5
$95,850
17
$114,933
3
$33,693
1
$202,560
FILES CLOSED FOR INCOMPLETENESS
0
$0
1
$79,280
8
$106,631
0
$0
0
$0
Aggregated Statistics For Year 2001 (Based on 2 partial tracts)
A) FHA, FSA/RHS & VA Home Purchase Loans
B) Conventional Home Purchase Loans
C) Refinancings
D) Home Improvement Loans
F) Non-occupant Loans on < 5 Family Dwellings (A B C & D)
Number
Average Value
Number
Average Value
Number
Average Value
Number
Average Value
Number
Average Value
LOANS ORIGINATED
6
$124,272
21
$104,970
53
$98,098
7
$27,011
6
$122,290
APPLICATIONS APPROVED, NOT ACCEPTED
1
$111,780
4
$58,072
5
$78,250
2
$50,145
1
$47,960
APPLICATIONS DENIED
0
$0
5
$70,480
17
$76,995
10
$27,510
2
$63,225
APPLICATIONS WITHDRAWN
0
$0
0
$0
16
$73,458
3
$46,907
0
$0
FILES CLOSED FOR INCOMPLETENESS
0
$0
0
$0
2
$98,305
0
$0
0
$0
Aggregated Statistics For Year 2000 (Based on 2 partial tracts)
A) FHA, FSA/RHS & VA Home Purchase Loans
B) Conventional Home Purchase Loans
C) Refinancings
D) Home Improvement Loans
F) Non-occupant Loans on < 5 Family Dwellings (A B C & D)
Number
Average Value
Number
Average Value
Number
Average Value
Number
Average Value
Number
Average Value
LOANS ORIGINATED
5
$107,820
21
$89,228
16
$74,622
8
$33,842
3
$109,933
APPLICATIONS APPROVED, NOT ACCEPTED
1
$88,790
3
$96,060
2
$41,025
0
$0
0
$0
APPLICATIONS DENIED
0
$0
14
$57,054
7
$73,107
8
$23,289
1
$43,600
APPLICATIONS WITHDRAWN
0
$0
2
$44,395
6
$67,388
1
$19,820
1
$65,010
FILES CLOSED FOR INCOMPLETENESS
0
$0
1
$148,250
2
$48,360
0
$0
0
$0
Aggregated Statistics For Year 1999 (Based on 2 partial tracts)
A) FHA, FSA/RHS & VA Home Purchase Loans
B) Conventional Home Purchase Loans
C) Refinancings
D) Home Improvement Loans
F) Non-occupant Loans on < 5 Family Dwellings (A B C & D)


 Nearest zip codes: 04001, 03851, 03887, 03872, 03830, 04027.