Estimated zip code population in 2022: 1,336 Zip code population in 2010: 1,362 Zip code population in 2000: 1,253
Houses and condos: 612 Renter-occupied apartments: 60
% of renters here:
12%
State:
26%
March 2022 cost of living index in zip code 04969: 86.3 (less than average, U.S. average is 100)
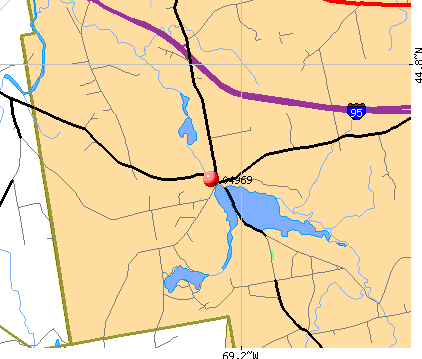
Land area: 29.7 sq. mi. Water area: 1.3 sq. mi.
Population density: 45 people per square mile
(very low).
OSM Map
Google Map
MSN Map
OSM Map
General Map
Google Map
MSN Map
OSM Map
Google Map
MSN Map
OSM Map
Google Map
MSN Map
Please wait while loading the map...
Real estate property taxes paid for housing units in 2022:
This zip code:
0.8% ($1,557)
Maine:
1.0% ($2,785)
Median real estate property taxes paid for housing units with mortgages in 2022: $1,698 (0.8%) Median real estate property taxes paid for housing units with no mortgage in 2022: $1,189 (0.8%)
Business Search- 14 Million verified businesses
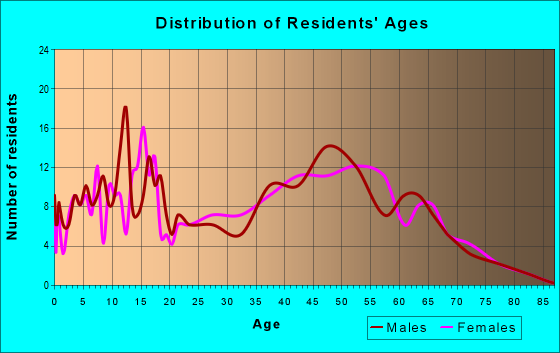
Males: 654
(49.0%)
Females: 681
(51.0%)
For population 25 years and over in 04969:
High school or higher: 92.7%
Bachelor's degree or higher: 13.6%
Graduate or professional degree: 5.3%
Unemployed: 3.0%
Mean travel time to work (commute): 23.6 minutes
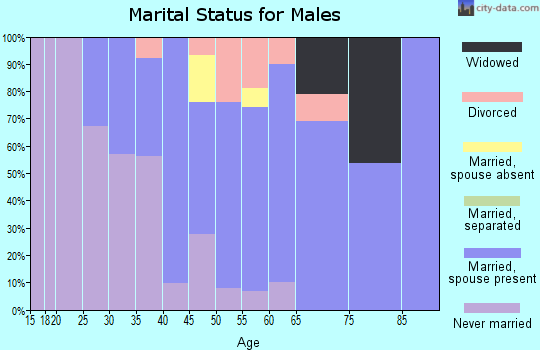
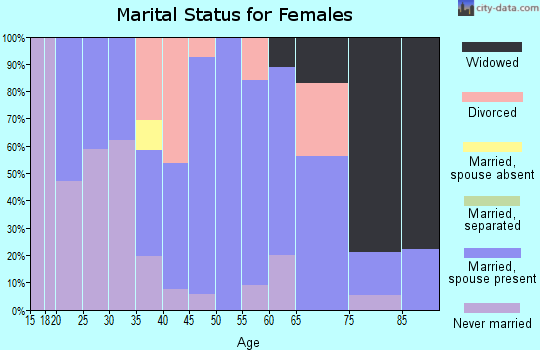
For population 15 years and over in 04969:
Never married: 27.4%
Now married: 55.6%
Separated: 1.0%
Widowed: 5.4%
Divorced: 10.5%
Zip code 04969 compared to state average:
Black race population percentage below state average.
Hispanic race population percentage significantly below state average.
Median age below state average.
Foreign-born population percentage significantly below state average.
Renting percentage below state average.
Length of stay since moving in significantly above state average.
Percentage of population with a bachelor's degree or higher significantly below state average.
Averages for the 2020 tax year for zip code 04969, filed in 2021:
Average Adjusted Gross Income (AGI) in 2020: $47,241 (Individual Income Tax Returns)
Here:
$47,241
State:
$68,227
Salary/wage: $42,924 (reported on 84.4% of returns)
Here:
$42,924
State:
$55,127
(% of AGI for various income ranges: 1195.3% for AGIs below $25k, 3457.1% for AGIs $25k-50k, 6037.5% for AGIs $50k-75k, 9780.0% for AGIs $75k-100k, 22556.7% for AGIs $100k-200k)
Taxable interest for individuals: $225 (reported on 25.0% of returns)
This zip code:
$225
Maine:
$1,162
(% of AGI for various income ranges: 6.7% for AGIs below $25k, 4.7% for AGIs $25k-50k, 6.2% for AGIs $50k-75k, 43.3% for AGIs $100k-200k)
Ordinary dividends: $767 (reported on 4.7% of returns)
Here:
$767
State:
$7,695
(% of AGI for various income ranges: 28.7% for AGIs $50k-75k)
Net capital gain/loss in AGI: +$3,025 (reported on 6.2% of returns)
Here:
+$3,025
State:
+$22,201
(% of AGI for various income ranges: 151.2% for AGIs $50k-75k)
Profit/loss from business: +$6,717 (reported on 9.4% of returns)
Here:
+$6,717
State:
+$15,095
(% of AGI for various income ranges: 193.3% for AGIs below $25k, 141.2% for AGIs $50k-75k)
Taxable individual retirement arrangement distribution: $10,800 (reported on 6.2% of returns)
04969:
$10,800
Maine:
$18,314
(% of AGI for various income ranges: 254.1% for AGIs $25k-50k)
Earned income credit: $1,964 (reported on 17.2% of returns)
Here:
$1,964
State:
$1,960
(% of AGI for various income ranges: 75.3% for AGIs below $25k, 60.6% for AGIs $25k-50k)
Percentage of individuals using paid preparers for their 2020 taxes: 89.1%
Here:
89%
State:
92%
(% for various income ranges: 85.7% for AGIs below $25k, 95.0% for AGIs $25k-50k, 90.0% for AGIs $50k-75k, 83.3% for AGIs $75k-100k, 85.7% for AGIs $100k-200k)
Averages for the 2012 tax year for zip code 04969, filed in 2013:
Average Adjusted Gross Income (AGI) in 2012: $38,589 (Individual Income Tax Returns)
Here:
$38,589
State:
$52,375
Salary/wage: $34,573 (reported on 88.9% of returns)
Here:
$34,573
State:
$43,415
(% of AGI for various income ranges: 80.1% for AGIs below $25k, 78.4% for AGIs $25k-50k, 82.2% for AGIs $50k-75k, 83.8% for AGIs $75k-100k, 73.4% for AGIs $100k-200k)
Taxable interest for individuals: $355 (reported on 20.4% of returns)
This zip code:
$355
Maine:
$1,221
(% of AGI for various income ranges: 0.5% for AGIs below $25k, 0.3% for AGIs $25k-50k)
Ordinary dividends: $540 (reported on 9.3% of returns)
Here:
$540
State:
$5,812
Net capital gain/loss in AGI: +$233 (reported on 5.6% of returns)
Here:
+$233
State:
+$11,897
Profit/loss from business: +$4,071 (reported on 13.0% of returns)
Here:
+$4,071
State:
+$12,144
Taxable individual retirement arrangement distribution: $8,500 (reported on 7.4% of returns)
04969:
$8,500
Maine:
$13,385
Total itemized deductions: $16,789 (23% of AGI, reported on 16.7% of returns)
Here:
$16,789
State:
$21,859
Here:
22.7% of AGI
State:
20.9% of AGI
(% of AGI for various income ranges: 6.5% for AGIs $25k-50k, 8.3% for AGIs $50k-75k, 20.4% for AGIs $75k-100k)
Charity contributions: $1,600 (reported on 9.3% of returns)
Here:
$1,600
State:
$2,741
Taxes paid: $5,844 (reported on 16.7% of returns)
04969:
$5,844
State:
$9,996
(% of AGI for various income ranges: 1.4% for AGIs $25k-50k, 2.6% for AGIs $50k-75k, 9.3% for AGIs $75k-100k)
Earned income credit: $2,115 (reported on 24.1% of returns)
Here:
$2,115
State:
$1,959
(% of AGI for various income ranges: 6.7% for AGIs below $25k, 1.4% for AGIs $25k-50k)
Percentage of individuals using paid preparers for their 2012 taxes: 37.0%
Here:
37%
State:
48%
(% for various income ranges: 28.6% for AGIs below $25k, 38.9% for AGIs $25k-50k, 50.0% for AGIs $50k-75k, 75.0% for AGIs $75k-100k)
Averages for the 2004 tax year for zip code 04969, filed in 2005:
Average Adjusted Gross Income (AGI) in 2004: $31,970 (Individual Income Tax Returns)
Here:
$31,970
State:
$42,606
Salary/wage: $31,000 (reported on 90.5% of returns)
Here:
$31,000
State:
$36,376
(% of AGI for various income ranges: 97.8% for AGIs below $10k, 82.8% for AGIs $10k-25k, 88.9% for AGIs $25k-50k, 86.3% for AGIs $50k-75k, 89.9% for AGIs $75k-100k, 91.1% for AGIs over 100k)
Taxable interest for individuals: $500 (reported on 30.1% of returns)
This zip code:
$500
Maine:
$1,367
(% of AGI for various income ranges: 2.4% for AGIs below $10k, 1.5% for AGIs $10k-25k, 0.3% for AGIs $25k-50k, 0.2% for AGIs $50k-75k, 0.1% for AGIs $75k-100k)
Taxable dividends: $419 (reported on 11.1% of returns)
Here:
$419
State:
$3,533
(% of AGI for various income ranges: 0.4% for AGIs $10k-25k, 0.1% for AGIs $25k-50k, 0.2% for AGIs $50k-75k, 0.0% for AGIs $75k-100k)
Net capital gain/loss: +$2,404 (reported on 8.4% of returns)
Here:
+$2,404
State:
+$11,433
Profit/loss from business: +$2,400 (reported on 14.3% of returns)
Here:
+$2,400
State:
+$10,755
(% of AGI for various income ranges: 4.9% for AGIs below $10k, -1.7% for AGIs $10k-25k, 4.4% for AGIs $25k-50k, -0.8% for AGIs $50k-75k)
Total itemized deductions: $13,306 (22% of AGI, reported on 19.9% of returns)
Here:
$13,306
State:
$18,231
Here:
22.4% of AGI
State:
21.7% of AGI
(% of AGI for various income ranges: 4.6% for AGIs $10k-25k, 7.7% for AGIs $25k-50k, 7.7% for AGIs $50k-75k, 14.9% for AGIs $75k-100k, 12.4% for AGIs over 100k)
Charity contributions deductions: $1,466 (2% of AGI, reported on 15.8% of returns)
Here:
$1,466
State:
$2,466
Here:
2.3% of AGI
State:
2.8% of AGI
Total tax: $3,505 (reported on 72.0% of returns)
04969:
$3,505
State:
$6,047
(% of AGI for various income ranges: 2.4% for AGIs below $10k, 4.1% for AGIs $10k-25k, 6.5% for AGIs $25k-50k, 8.4% for AGIs $50k-75k, 9.8% for AGIs $75k-100k, 16.7% for AGIs over 100k)
Earned income credit: $1,648 (reported on 18.8% of returns)
Here:
$1,648
State:
$1,520
Percentage of individuals using paid preparers for their 2004 taxes: 48.6%
Here:
49%
State:
53%
(% for various income ranges: 31.3% for AGIs below $10k, 43.8% for AGIs $10k-25k, 56.5% for AGIs $25k-50k, 60.7% for AGIs $50k-75k, 91.7% for AGIs $75k-100k)
Likely homosexual households (counted as self-reported same-sex unmarried-partner households)
Lesbian couples: 1.1% of all households
Gay men: 0.0% of all households
Household received Food Stamps/SNAP in the past 12 months: 61 Household did not receive Food Stamps/SNAP in the past 12 months: 453
Women who had a birth in the past 12 months: 21 (5 now married, 16 unmarried) Women who did not have a birth in the past 12 months: 257 (137 now married, 119 unmarried)
Housing units in zip code 04969 with a mortgage: 278 (24 second mortgage, 24 both second mortgage and home equity loan) Houses without a mortgage: 4
Median monthly owner costs for units with a mortgage: $1,189 Median monthly owner costs for units without a mortgage: $434
Residents with income below the poverty level in 2022:
This zip code:
10.5%
Whole state:
10.8%
Residents with income below 50% of the poverty level in 2022:
This zip code:
3.2%
Whole state:
5.8%
Median number of rooms in houses and condos:
Here:
5.3
State:
6.1
Median number of rooms in apartments:
Here:
6.2
State:
4.0
Notable locations in this zip code not listed on our city pages
In group quarters: 5 (-1 institutionalized population)
Size of family households: 176 2-persons, 40 3-persons, 62 4-persons, 64 5-persons, 10 7-or-more-persons
Size of nonfamily households: 137 1-person, 19 2-persons, 4 4-persons
193 married couples with children.
85 single-parent households (8 men, 77 women).
99.3% of residents of 04969 zip code speak English at home.
0.3% of residents speak other Indo-European language at home (25% very well, 75% well).
Foreign born population: 6 (0.5%) (34.6% of them are naturalized citizens)
This zip code:
0.5%
Whole state:
4.1%
67%Haiti
17%Barbados
27%English
24%American
11%Scottish
9%French
7%Irish
4%French Canadian
2%Jamaican
Year of entry for the foreign-born population
22010 or later
02000 to 2009
91990 to 1999
1Before 1990
Facilities with environmental interests located in this zip code:
HOWS CORNER WEST SITE (SAWYER RD LOT 17 in PLYMOUTH, ME)
SUPERFUND NPL (Superfund database) - ICIS-01-2004-0014, FORMAL ENFORCEMENT ACTION, ICIS-01-2003-0060, ICIS-01-2004-0025, ENFORCEMENT/COMPLIANCE ACTIVITY (Integrated Compliance Information System) - ICIS-01-2000-0058, FORMAL ENFORCEMENT ACTION, ICIS-01-2000-0233, ICIS-01-2001-0013, ICIS-01-2001-0167, ICIS-01-2002-0162, ICIS-01-2005-0200, ENFORCEMENT/COMPLIANCE ACTIVITY Large Quantity Generators, more that 1000 kg of hazardous waste/month (Resource Conservation and Recovery Act (tracking hazardous waste)) - notification - ICIS-01-2002-0162, FORMAL ENFORCEMENT ACTION (Resource Conservation and Recovery Act (tracking hazardous waste)) Organizations: OPERNAME (CONTACT/OPERATOR)
, GEORGE WEST JR (CONTACT/OWNER)
Alternative names: HOWSCORNER WEST SITE, SAWYER ROAD SITE, WEST SITE HOWS CORNERS
SOIL PREPARATION INC (135 VALLEY RD in PLYMOUTH, ME)
National Pollutant Discharge Elimination System NON-MAJOR (Tracking pollutant discharge elimination systems) - permit National Pollutant Discharge Elimination System NON-MAJOR (Tracking pollutant discharge elimination systems) - permit Business SIC classification: SOIL PREPARATION SERVICES; IRRIGATION SYSTEMS
LANDSTONE & MATERIALS (71 CRESTMONT RD. in PLYMOUTH, ME)
AIR MINOR (AIRS/AFS) Business SIC classification: ASPHALT PAVING MIXTURES AND BLOCKS
PLYMOUTH AUTO SALES (RTE 7 in PLYMOUTH, ME)
Conditionally Exempt Small Quantity Generators, less than 100 kg/month of hazardous waste (Resource Conservation and Recovery Act (tracking hazardous waste)) - notification
Housing units lacking complete plumbing facilities: 2.1% Housing units lacking complete kitchen facilities: 0.3%
62.0%Fuel oil, kerosene, etc.
15.1%Bottled, tank, or LP gas
13.2%Wood
8.5%Electricity
1.0%Other fuel
0.6%No fuel used
Population in 1990: 974. Population change in the 1990s: +279 (+28.6%).
Place of birth for U.S.-born residents:
This state: 980
Northeast: 226
Midwest: 13
South: 55
West: 30
73% of the 04969 zip code residents lived in the same house 5 years ago. Out of people who lived in different houses, 36% lived in this county. Out of people who lived in different counties, 50% lived in Maine.
91% of the 04969 zip code residents lived in the same house 1 year ago. Out of people who lived in different houses, 26% moved from this county. Out of people who lived in different houses, 30% moved from different county within same state. Out of people who lived in different houses, 47% moved from different state.
Private vs. public school enrollment:
Students in private schools in grades 1 to 8 (elementary and middle school): 40
Here:
23.3%
Maine:
12.7%
Students in private schools in grades 9 to 12 (high school): 15
Here:
22.4%
Maine:
12.6%
Students in private undergraduate colleges: 1
Here:
12.4%
Maine:
34.5%
Occupation by median earnings in the past 12 months ($)
114,556Business and financial operations occupations
85,058Personal care and service occupations
70,988Health diagnosing and treating practitioners and other technical occupations
62,976Sales and related occupations
59,017Management occupations
56,073Material moving occupations
Top industries in this zip code by the number of employees in 2005:
Administrative and Support and Waste Management and Remediation Services: Septic Tank and Related Services (20-49 employees: 1 establishment)
Health Care and Social Assistance: Other Residential Care Facilities (20-49: 1)
Professional, Scientific, and Technical Services: Engineering Services (10-19: 1)
Construction: Site Preparation Contractors (1-4: 2)
Construction: New Single-Family Housing Construction (except Operative Builders) (1-4: 2)
Accommodation and Food Services: Limited-Service Restaurants (1-4: 1)
Professional, Scientific, and Technical Services: Graphic Design Services (1-4: 1)
Construction: Framing Contractors (1-4: 1)
People in group quarters in 2010:
9 people in residential treatment centers for juveniles (non-correctional)
People in group quarters in 2000:
8 people in other group homes
Home Mortgage Disclosure Act Aggregated Statistics For Year 2009 (Based on 2 partial tracts)
A) FHA, FSA/RHS & VA Home Purchase Loans
B) Conventional Home Purchase Loans
C) Refinancings
D) Home Improvement Loans
F) Non-occupant Loans on < 5 Family Dwellings (A B C & D)
G) Loans On Manufactured Home Dwelling (A B C & D)
Number
Average Value
Number
Average Value
Number
Average Value
Number
Average Value
Number
Average Value
Number
Average Value
LOANS ORIGINATED
12
$106,660
5
$120,892
51
$107,104
5
$45,800
0
$0
4
$61,022
APPLICATIONS APPROVED, NOT ACCEPTED
0
$0
1
$137,580
7
$95,354
0
$0
0
$0
1
$23,080
APPLICATIONS DENIED
3
$109,173
4
$61,468
31
$139,296
8
$75,668
4
$58,138
6
$69,528
APPLICATIONS WITHDRAWN
1
$101,190
3
$100,003
6
$119,530
2
$13,315
0
$0
0
$0
FILES CLOSED FOR INCOMPLETENESS
0
$0
0
$0
2
$119,380
0
$0
0
$0
0
$0
Aggregated Statistics For Year 2008 (Based on 2 partial tracts)
A) FHA, FSA/RHS & VA Home Purchase Loans
B) Conventional Home Purchase Loans
C) Refinancings
D) Home Improvement Loans
F) Non-occupant Loans on < 5 Family Dwellings (A B C & D)
G) Loans On Manufactured Home Dwelling (A B C & D)
Number
Average Value
Number
Average Value
Number
Average Value
Number
Average Value
Number
Average Value
Number
Average Value
LOANS ORIGINATED
8
$115,388
13
$105,488
39
$137,328
15
$40,119
5
$88,582
10
$66,392
APPLICATIONS APPROVED, NOT ACCEPTED
0
$0
0
$0
4
$66,570
1
$17,750
0
$0
2
$54,585
APPLICATIONS DENIED
2
$103,850
4
$75,890
21
$117,205
16
$20,359
4
$61,022
8
$38,166
APPLICATIONS WITHDRAWN
0
$0
2
$57,250
9
$139,452
1
$28,400
1
$74,560
1
$96,750
FILES CLOSED FOR INCOMPLETENESS
0
$0
0
$0
3
$147,933
3
$34,023
0
$0
0
$0
Aggregated Statistics For Year 2007 (Based on 2 partial tracts)
A) FHA, FSA/RHS & VA Home Purchase Loans
B) Conventional Home Purchase Loans
C) Refinancings
D) Home Improvement Loans
F) Non-occupant Loans on < 5 Family Dwellings (A B C & D)
G) Loans On Manufactured Home Dwelling (A B C & D)
Number
Average Value
Number
Average Value
Number
Average Value
Number
Average Value
Number
Average Value
Number
Average Value
LOANS ORIGINATED
6
$118,198
23
$103,772
51
$103,797
19
$25,086
4
$112,948
18
$57,546
APPLICATIONS APPROVED, NOT ACCEPTED
1
$82,550
1
$228,110
4
$146,455
1
$74,560
0
$0
1
$82,550
APPLICATIONS DENIED
0
$0
8
$78,441
27
$120,451
10
$39,054
2
$72,340
5
$50,238
APPLICATIONS WITHDRAWN
1
$82,550
0
$0
9
$98,129
1
$199,710
0
$0
2
$94,975
FILES CLOSED FOR INCOMPLETENESS
0
$0
1
$130,480
6
$151,188
0
$0
0
$0
0
$0
Aggregated Statistics For Year 2006 (Based on 2 partial tracts)
A) FHA, FSA/RHS & VA Home Purchase Loans
B) Conventional Home Purchase Loans
C) Refinancings
D) Home Improvement Loans
F) Non-occupant Loans on < 5 Family Dwellings (A B C & D)
G) Loans On Manufactured Home Dwelling (A B C & D)
Number
Average Value
Number
Average Value
Number
Average Value
Number
Average Value
Number
Average Value
Number
Average Value
LOANS ORIGINATED
4
$144,458
35
$100,958
62
$103,434
19
$34,569
5
$65,150
16
$39,276
APPLICATIONS APPROVED, NOT ACCEPTED
0
$0
3
$70,120
8
$101,075
2
$54,145
2
$96,750
1
$34,620
APPLICATIONS DENIED
2
$91,865
10
$84,056
48
$112,226
18
$38,117
4
$70,785
8
$56,474
APPLICATIONS WITHDRAWN
0
$0
2
$104,295
25
$107,790
3
$43,493
1
$93,200
1
$13,310
FILES CLOSED FOR INCOMPLETENESS
0
$0
1
$90,540
4
$129,368
1
$191,720
0
$0
1
$191,720
Aggregated Statistics For Year 2005 (Based on 2 partial tracts)
A) FHA, FSA/RHS & VA Home Purchase Loans
B) Conventional Home Purchase Loans
C) Refinancings
D) Home Improvement Loans
F) Non-occupant Loans on < 5 Family Dwellings (A B C & D)
G) Loans On Manufactured Home Dwelling (A B C & D)
Number
Average Value
Number
Average Value
Number
Average Value
Number
Average Value
Number
Average Value
Number
Average Value
LOANS ORIGINATED
7
$123,503
36
$108,879
62
$93,484
10
$41,362
3
$64,203
16
$65,017
APPLICATIONS APPROVED, NOT ACCEPTED
0
$0
3
$271,607
10
$104,559
0
$0
0
$0
0
$0
APPLICATIONS DENIED
0
$0
8
$100,188
54
$90,042
21
$41,844
0
$0
7
$49,071
APPLICATIONS WITHDRAWN
1
$150,890
3
$90,240
36
$101,951
6
$108,435
1
$37,280
4
$56,808
FILES CLOSED FOR INCOMPLETENESS
0
$0
3
$69,823
2
$97,635
1
$124,260
0
$0
0
$0
Aggregated Statistics For Year 2004 (Based on 2 partial tracts)
A) FHA, FSA/RHS & VA Home Purchase Loans
B) Conventional Home Purchase Loans
C) Refinancings
D) Home Improvement Loans
F) Non-occupant Loans on < 5 Family Dwellings (A B C & D)
G) Loans On Manufactured Home Dwelling (A B C & D)
Detailed PMIC statistics for the following Tracts:0125.00
2005 - 2018 National Fire Incident Reporting System (NFIRS) incidents
According to the data from the years 2005 - 2018 the average number of fires per year is 12. The highest number of fire incidents - 22 took place in 2018, and the least - 6 in 2005. The data has an increasing trend.
When looking into fire subcategories, the most incidents belonged to: Structure Fires (64.5%), and Mobile Property/Vehicle Fires (17.2%).
Fire incident types reported to NFIRS in Zip Code 04969


 Nearest zip codes: 04933, 04929, 04953, 04434, 04987, 04932.


 According to the data from the years 2005 - 2018 the average number of fires per year is 12. The highest number of fire incidents - 22 took place in 2018, and the least - 6 in 2005. The data has an increasing trend.
 When looking into fire subcategories, the most incidents belonged to: Structure Fires (64.5%), and Mobile Property/Vehicle Fires (17.2%).