Estimated zip code population in 2022: 4,832 Zip code population in 2010: 4,664 Zip code population in 2000: 4,740
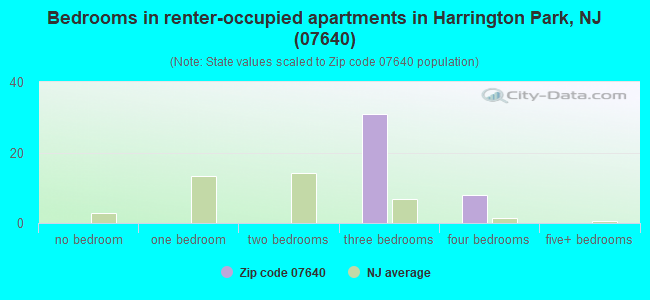
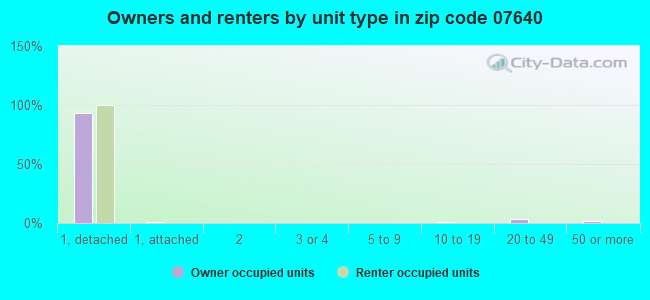
Houses and condos: 1,832 Renter-occupied apartments: 41
% of renters here:
2%
State:
35%
March 2022 cost of living index in zip code 07640: 122.4 (high, U.S. average is 100)
Land area: 1.8 sq. mi. Water area: 0.2 sq. mi.
Population density: 2,638 people per square mile
(average).
OSM Map
Google Map
MSN Map
OSM Map
General Map
Google Map
MSN Map
OSM Map
Google Map
MSN Map
OSM Map
Google Map
MSN Map
Please wait while loading the map...
Real estate property taxes paid for housing units in 2022:
This zip code:
1.3% ($9,521)
New Jersey:
2.1% ($8,897)
Median real estate property taxes paid for housing units with mortgages in 2022: $9,557 (1.1%) Median real estate property taxes paid for housing units with no mortgage in 2022: $9,483 (1.6%)
Business Search- 14 Million verified businesses
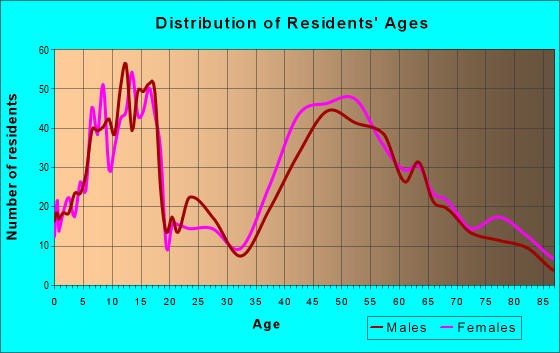
Males: 2,334
(48.3%)
Females: 2,498
(51.7%)
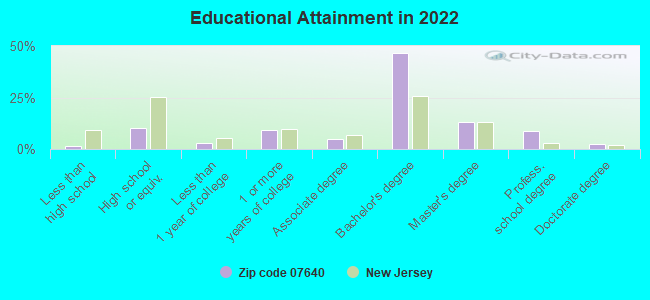
For population 25 years and over in 07640:
High school or higher: 99.3%
Bachelor's degree or higher: 71.9%
Graduate or professional degree: 24.8%
Unemployed: 2.0%
Mean travel time to work (commute): 33.7 minutes
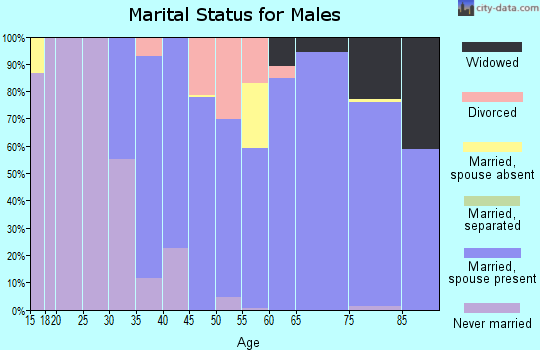
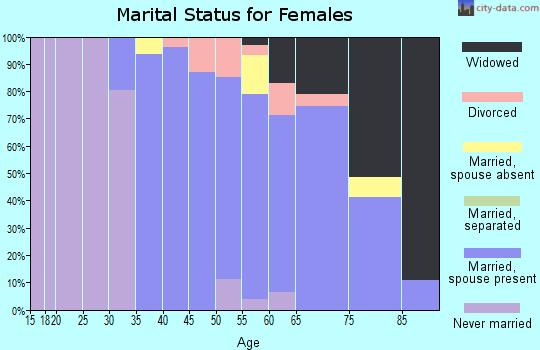
For population 15 years and over in 07640:
Never married: 18.8%
Now married: 73.2%
Separated: 0.0%
Widowed: 2.9%
Divorced: 5.0%
Zip code 07640 compared to state average:
Median household income above state average.
Median house value above state average.
Unemployed percentage below state average.
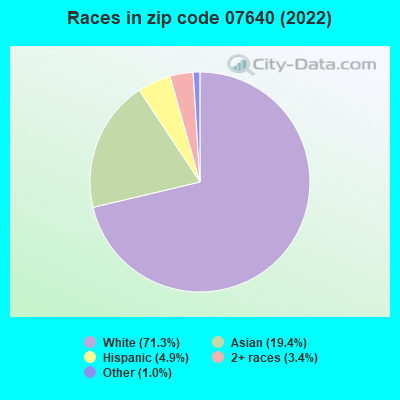
Black race population percentage significantly below state average.
Hispanic race population percentage significantly below state average.
Median age above state average.
Foreign-born population percentage below state average.
Renting percentage significantly below state average.
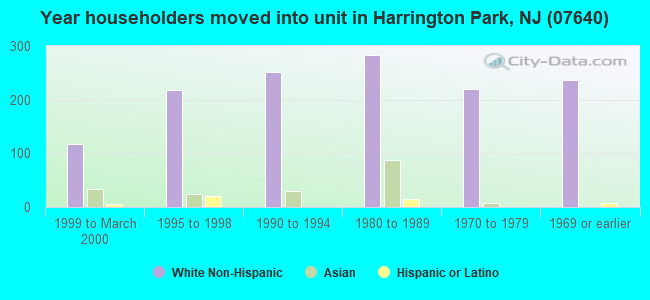
Length of stay since moving in above state average.
Number of rooms per house above state average.
Percentage of population with a bachelor's degree or higher above state average.
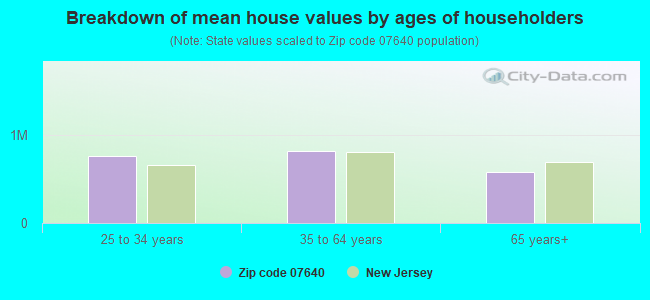
Estimated median house/condo value in 2022: $737,165
07640:
$737,165
New Jersey:
$428,900
Median resident age:
This zip code:
47.4 years
New Jersey median age:
40.4 years
Average household size:
This zip code:
2.7 people
New Jersey:
2.6 people
Averages for the 2020 tax year for zip code 07640, filed in 2021:
Average Adjusted Gross Income (AGI) in 2020: $162,963 (Individual Income Tax Returns)
Here:
$162,963
State:
$95,247
Salary/wage: $140,344 (reported on 77.9% of returns)
Here:
$140,344
State:
$80,635
(% of AGI for various income ranges: 1465.8% for AGIs below $25k, 4014.0% for AGIs $25k-50k, 6797.7% for AGIs $50k-75k, 11592.2% for AGIs $75k-100k, 22095.6% for AGIs $100k-200k, 116921.4% for AGIs over 200k)
Taxable interest for individuals: $3,260 (reported on 55.8% of returns)
This zip code:
$3,260
New Jersey:
$2,414
(% of AGI for various income ranges: 102.6% for AGIs below $25k, 122.7% for AGIs $25k-50k, 110.8% for AGIs $50k-75k, 225.6% for AGIs $75k-100k, 354.4% for AGIs $100k-200k, 1782.9% for AGIs over 200k)
Ordinary dividends: $9,720 (reported on 51.3% of returns)
Here:
$9,720
State:
$8,057
(% of AGI for various income ranges: 155.3% for AGIs below $25k, 252.7% for AGIs $25k-50k, 323.8% for AGIs $50k-75k, 768.9% for AGIs $75k-100k, 1238.0% for AGIs $100k-200k, 4566.4% for AGIs over 200k)
Net capital gain/loss in AGI: +$16,929 (reported on 46.5% of returns)
Here:
+$16,929
State:
+$25,022
(% of AGI for various income ranges: 107.9% for AGIs below $25k, 263.3% for AGIs $25k-50k, 221.5% for AGIs $50k-75k, 426.7% for AGIs $75k-100k, 858.0% for AGIs $100k-200k, 10255.7% for AGIs over 200k)
Profit/loss from business: +$29,456 (reported on 19.0% of returns)
Here:
+$29,456
State:
+$18,035
(% of AGI for various income ranges: 192.6% for AGIs below $25k, 316.0% for AGIs $25k-50k, 301.5% for AGIs $50k-75k, 807.8% for AGIs $75k-100k, 1316.4% for AGIs $100k-200k, 5297.1% for AGIs over 200k)
Taxable individual retirement arrangement distribution: $26,618 (reported on 14.6% of returns)
07640:
$26,618
New Jersey:
$21,558
(% of AGI for various income ranges: 96.8% for AGIs below $25k, 326.7% for AGIs $25k-50k, 463.8% for AGIs $50k-75k, 1106.7% for AGIs $75k-100k, 1536.8% for AGIs $100k-200k, 1906.4% for AGIs over 200k)
Self-employed (Keogh) retirement plans: $27,140 (reported on 2.2% of returns)
07640:
$27,140
New Jersey:
$30,844
(% of AGI for various income ranges: 969.3% for AGIs over 200k)
Total itemized deductions: $37,305 (reported on 27.4% of returns)
Here:
$37,305
State:
$32,863
(% of AGI for various income ranges: 341.6% for AGIs below $25k, 452.7% for AGIs $25k-50k, 901.5% for AGIs $50k-75k, 1413.3% for AGIs $75k-100k, 2557.2% for AGIs $100k-200k, 9260.0% for AGIs over 200k)
Charity contributions: $7,167 (reported on 24.3% of returns)
Here:
$7,167
State:
$7,880
(% of AGI for various income ranges: 64.0% for AGIs $25k-50k, 95.4% for AGIs $50k-75k, 190.0% for AGIs $75k-100k, 358.0% for AGIs $100k-200k, 1897.1% for AGIs over 200k)
Taxes paid: $9,693 (reported on 27.0% of returns)
07640:
$9,693
State:
$9,183
(% of AGI for various income ranges: 106.8% for AGIs below $25k, 150.0% for AGIs $25k-50k, 285.4% for AGIs $50k-75k, 471.1% for AGIs $75k-100k, 777.6% for AGIs $100k-200k, 1961.4% for AGIs over 200k)
Earned income credit: $1,600 (reported on 3.5% of returns)
Here:
$1,600
State:
$2,148
(% of AGI for various income ranges: 67.4% for AGIs below $25k)
Percentage of individuals using paid preparers for their 2020 taxes: 93.4%
Here:
93%
State:
92%
(% for various income ranges: 88.6% for AGIs below $25k, 96.2% for AGIs $25k-50k, 90.9% for AGIs $50k-75k, 94.7% for AGIs $75k-100k, 96.6% for AGIs $100k-200k, 92.9% for AGIs over 200k)
Averages for the 2012 tax year for zip code 07640, filed in 2013:
Average Adjusted Gross Income (AGI) in 2012: $135,203 (Individual Income Tax Returns)
Here:
$135,203
State:
$79,688
Salary/wage: $114,250 (reported on 78.9% of returns)
Here:
$114,250
State:
$68,122
(% of AGI for various income ranges: 65.6% for AGIs below $25k, 68.8% for AGIs $25k-50k, 61.1% for AGIs $50k-75k, 55.3% for AGIs $75k-100k, 70.0% for AGIs $100k-200k, 66.6% for AGIs over 200k)
Taxable interest for individuals: $2,950 (reported on 57.7% of returns)
This zip code:
$2,950
New Jersey:
$2,193
(% of AGI for various income ranges: 3.8% for AGIs below $25k, 0.9% for AGIs $25k-50k, 2.5% for AGIs $50k-75k, 1.6% for AGIs $75k-100k, 1.5% for AGIs $100k-200k, 1.0% for AGIs over 200k)
Ordinary dividends: $6,451 (reported on 51.5% of returns)
Here:
$6,451
State:
$6,828
(% of AGI for various income ranges: 8.5% for AGIs below $25k, 2.5% for AGIs $25k-50k, 3.3% for AGIs $50k-75k, 4.8% for AGIs $75k-100k, 2.6% for AGIs $100k-200k, 1.9% for AGIs over 200k)
Net capital gain/loss in AGI: +$8,946 (reported on 40.5% of returns)
Here:
+$8,946
State:
+$15,358
(% of AGI for various income ranges: 0.9% for AGIs below $25k, 0.1% for AGIs $50k-75k, 1.3% for AGIs $100k-200k, 3.9% for AGIs over 200k)
Profit/loss from business: +$35,065 (reported on 18.9% of returns)
Here:
+$35,065
State:
+$19,577
(% of AGI for various income ranges: 9.3% for AGIs below $25k, 7.4% for AGIs $25k-50k, 4.1% for AGIs $50k-75k, 6.7% for AGIs $75k-100k, 3.6% for AGIs $100k-200k, 5.1% for AGIs over 200k)
Taxable individual retirement arrangement distribution: $23,084 (reported on 16.3% of returns)
07640:
$23,084
New Jersey:
$18,214
(% of AGI for various income ranges: 7.0% for AGIs below $25k, 3.5% for AGIs $25k-50k, 7.2% for AGIs $50k-75k, 5.4% for AGIs $75k-100k, 4.3% for AGIs $100k-200k, 1.3% for AGIs over 200k)
Self-employment retirement plans: $28,071 (reported on 3.1% of returns)
07640:
$28,071
New Jersey:
$24,511
(% of AGI for various income ranges: 1.8% for AGIs $75k-100k, 0.9% for AGIs over 200k)
Total itemized deductions: $41,374 (21% of AGI, reported on 63.4% of returns)
Here:
$41,374
State:
$30,827
Here:
21.0% of AGI
State:
21.2% of AGI
(% of AGI for various income ranges: 35.3% for AGIs below $25k, 24.8% for AGIs $25k-50k, 26.0% for AGIs $50k-75k, 25.8% for AGIs $75k-100k, 22.7% for AGIs $100k-200k, 16.1% for AGIs over 200k)
Charity contributions: $3,705 (reported on 56.8% of returns)
Here:
$3,705
State:
$3,451
(% of AGI for various income ranges: 1.4% for AGIs below $25k, 1.3% for AGIs $25k-50k, 2.1% for AGIs $50k-75k, 1.8% for AGIs $75k-100k, 2.0% for AGIs $100k-200k, 1.3% for AGIs over 200k)
Taxes paid: $24,095 (reported on 63.4% of returns)
07640:
$24,095
State:
$15,801
(% of AGI for various income ranges: 16.8% for AGIs below $25k, 11.5% for AGIs $25k-50k, 13.2% for AGIs $50k-75k, 13.7% for AGIs $75k-100k, 12.0% for AGIs $100k-200k, 10.4% for AGIs over 200k)
Earned income credit: $1,711 (reported on 4.0% of returns)
Here:
$1,711
State:
$2,182
(% of AGI for various income ranges: 2.8% for AGIs below $25k)
Percentage of individuals using paid preparers for their 2012 taxes: 73.6%
Here:
74%
State:
65%
(% for various income ranges: 67.2% for AGIs below $25k, 65.4% for AGIs $25k-50k, 78.3% for AGIs $50k-75k, 78.9% for AGIs $75k-100k, 76.4% for AGIs $100k-200k, 79.1% for AGIs over 200k)
Averages for the 2004 tax year for zip code 07640, filed in 2005:
Average Adjusted Gross Income (AGI) in 2004: $103,939 (Individual Income Tax Returns)
Here:
$103,939
State:
$64,921
Salary/wage: $94,096 (reported on 78.1% of returns)
Here:
$94,096
State:
$57,755
(% of AGI for various income ranges: 200.0% for AGIs below $10k, 62.8% for AGIs $10k-25k, 68.5% for AGIs $25k-50k, 64.7% for AGIs $50k-75k, 67.4% for AGIs $75k-100k, 71.4% for AGIs over 100k)
Taxable interest for individuals: $2,512 (reported on 71.6% of returns)
This zip code:
$2,512
New Jersey:
$2,068
(% of AGI for various income ranges: 21.8% for AGIs below $10k, 7.2% for AGIs $10k-25k, 3.2% for AGIs $25k-50k, 2.7% for AGIs $50k-75k, 3.0% for AGIs $75k-100k, 1.2% for AGIs over 100k)
Taxable dividends: $4,272 (reported on 60.2% of returns)
Here:
$4,272
State:
$3,959
(% of AGI for various income ranges: 27.3% for AGIs below $10k, 6.7% for AGIs $10k-25k, 3.5% for AGIs $25k-50k, 2.8% for AGIs $50k-75k, 3.4% for AGIs $75k-100k, 2.1% for AGIs over 100k)
Net capital gain/loss: +$10,443 (reported on 49.8% of returns)
Here:
+$10,443
State:
+$13,591
(% of AGI for various income ranges: -24.0% for AGIs below $10k, 0.4% for AGIs $10k-25k, -0.1% for AGIs $25k-50k, -0.1% for AGIs $50k-75k, 1.0% for AGIs $75k-100k, 6.4% for AGIs over 100k)
Profit/loss from business: +$32,022 (reported on 18.2% of returns)
Here:
+$32,022
State:
+$17,520
(% of AGI for various income ranges: 10.4% for AGIs below $10k, 9.7% for AGIs $10k-25k, 7.7% for AGIs $25k-50k, 6.9% for AGIs $50k-75k, 3.8% for AGIs $75k-100k, 5.5% for AGIs over 100k)
IRA payment deduction: $4,048 (reported on 4.7% of returns)
07640:
$4,048
New Jersey:
$3,270
(% of AGI for various income ranges: 0.6% for AGIs $25k-50k, 0.4% for AGIs $50k-75k, 0.4% for AGIs $75k-100k, 0.1% for AGIs over 100k)
Self-employed pension: $14,154 (reported on 2.9% of returns)
Here:
$14,154
New Jersey:
$17,258
Total itemized deductions: $31,078 (21% of AGI, reported on 64.5% of returns)
Here:
$31,078
State:
$23,924
Here:
20.8% of AGI
State:
21.1% of AGI
(% of AGI for various income ranges: 75.6% for AGIs below $10k, 37.1% for AGIs $10k-25k, 32.9% for AGIs $25k-50k, 25.7% for AGIs $50k-75k, 25.8% for AGIs $75k-100k, 16.5% for AGIs over 100k)
Charity contributions deductions: $3,515 (2% of AGI, reported on 59.5% of returns)
Here:
$3,515
State:
$3,242
Here:
2.3% of AGI
State:
2.7% of AGI
(% of AGI for various income ranges: 2.5% for AGIs below $10k, 2.9% for AGIs $10k-25k, 2.3% for AGIs $25k-50k, 2.6% for AGIs $50k-75k, 2.7% for AGIs $75k-100k, 1.8% for AGIs over 100k)
Total tax: $22,104 (reported on 82.0% of returns)
07640:
$22,104
State:
$12,321
(% of AGI for various income ranges: 5.0% for AGIs below $10k, 4.9% for AGIs $10k-25k, 8.0% for AGIs $25k-50k, 9.3% for AGIs $50k-75k, 10.0% for AGIs $75k-100k, 19.9% for AGIs over 100k)
Earned income credit: $1,339 (reported on 2.8% of returns)
Here:
$1,339
State:
$1,711
Percentage of individuals using paid preparers for their 2004 taxes: 72.8%
Here:
73%
State:
65%
(% for various income ranges: 67.0% for AGIs below $10k, 69.4% for AGIs $10k-25k, 67.7% for AGIs $25k-50k, 79.3% for AGIs $50k-75k, 75.3% for AGIs $75k-100k, 76.2% for AGIs over 100k)
Household received Food Stamps/SNAP in the past 12 months: 0 Household did not receive Food Stamps/SNAP in the past 12 months: 1,755
Women who had a birth in the past 12 months: 44 (45 now married, 0 unmarried) Women who did not have a birth in the past 12 months: 819 (531 now married, 283 unmarried)
Housing units in zip code 07640 with a mortgage: 1,000 (98 second mortgage, 10 home equity loan, 89 both second mortgage and home equity loan) Houses without a mortgage: 48
Median monthly owner costs for units with a mortgage: $3,744 Median monthly owner costs for units without a mortgage: $1,425
Residents with income below the poverty level in 2022:
This zip code:
5.7%
Whole state:
9.7%
Residents with income below 50% of the poverty level in 2022:
This zip code:
4.8%
Whole state:
5.2%
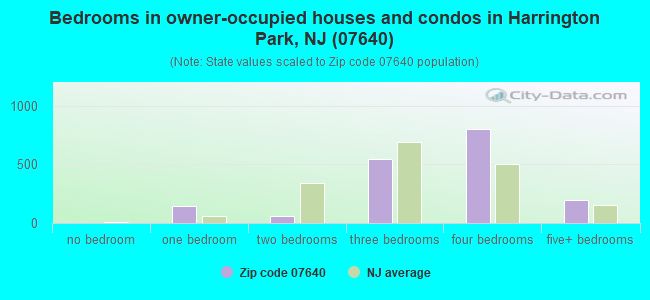
Median number of rooms in houses and condos:
Here:
7.7
State:
6.8
Median number of rooms in apartments:
Here:
6.7
State:
3.9
Notable locations in this zip code not listed on our city pages
Notable locations in zip code 07640: Harrington Park Public Library (A), Harrington Park Volunteer Ambulance Corps (B), Harrington Park Fire Department (C), Harrington Park Boro Hall (D). Display/hide their locations on the map
Churches in zip code 07640 include: Community Church of Harrington Park (A), Our Lady of Victories Church (B), Saint Andrew's Episcopal Church (C). Display/hide their locations on the map
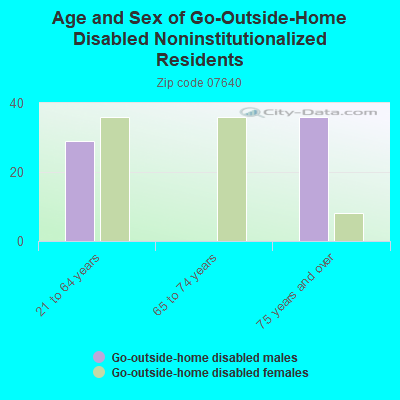
In group quarters: 4 (-1 institutionalized population)
Size of family households: 682 2-persons, 342 3-persons, 334 4-persons, 109 5-persons, 34 6-persons
Size of nonfamily households: 264 1-person
1,048 married couples with children.
102 single-parent households (13 men, 89 women).
79.7% of residents of 07640 zip code speak English at home.
2.0% of residents speak Spanish at home (100% very well).
6.1% of residents speak other Indo-European language at home (97% very well, 3% well).
12.0% of residents speak Asian or Pacific Island language at home (51% very well, 28% well, 21% not well).
0.2% of residents speak other language at home (100% very well).
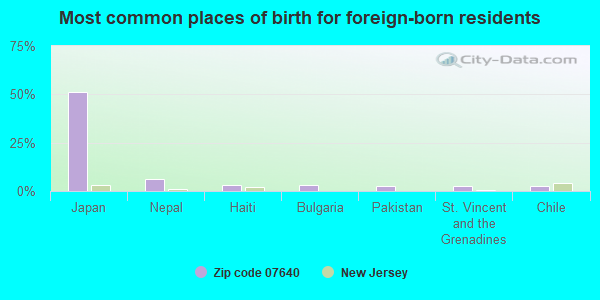
Foreign born population: 706 (14.6%) (82.3% of them are naturalized citizens)
This zip code:
14.6%
Whole state:
23.5%
51%Japan
6%Nepal
3%Haiti
3%Bulgaria
3%Pakistan
3%St. Vincent and the Grenadines
2%Chile
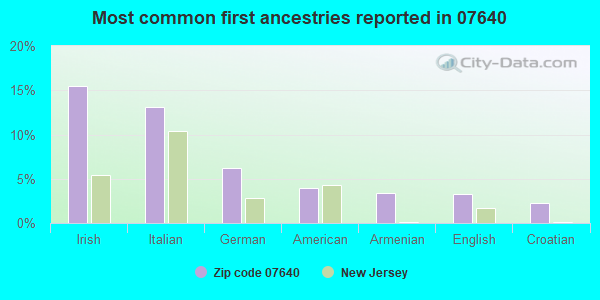
15%Irish
13%Italian
6%German
4%American
3%Armenian
3%English
2%Croatian
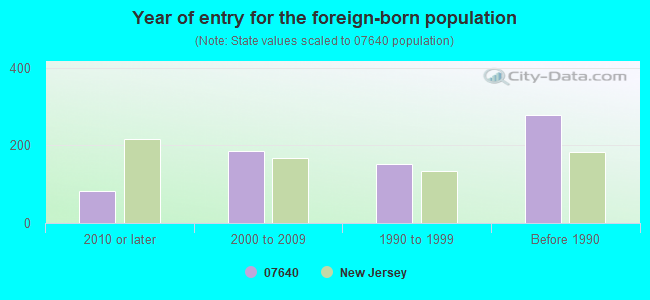
Year of entry for the foreign-born population
832010 or later
1862000 to 2009
1521990 to 1999
278Before 1990
Facilities with environmental interests located in this zip code:
HARRINGTON PARK BORO BD OF ED HARRINGTON PARK ELEMENTARY SCHOOL (191 HARRIOT AVE in HARRINGTON PARK, NJ)
COMPLIANCE ACTIVITY (Tracking inspections of insecticide, fungicide, and rodenticide, and toxic substances) (National Center for Education Statistics) - STATE ID-050 STATE MASTER (New Jersey environmental info) - NJEMS-019594, STATE CLEANUP SITE, NJEMS-02551, AIR PROGRAM Alternative names: HARRINGTON PARK BOARD OF ED, HARRINGTON PARK PUBLIC SCHOOL
HARRINGTON PARK BORO MUNICIPAL CENTER (85 HARRIOT AVE in HARRINGTON PARK, NJ)
STATE MASTER (New Jersey environmental info) - NJEMS-201970, National Pollutant Discharge Elimination System Permit National Pollutant Discharge Elimination System NON-MAJOR (Tracking pollutant discharge elimination systems) - permit Organizations: HARRINGTON PARK BORO COMPOST, HARRINGTON PARK BORO COMPOST (CONTACT/OWNER)
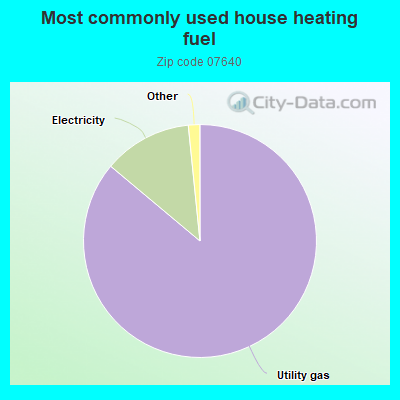
86.1%Utility gas
12.3%Electricity
0.6%Fuel oil, kerosene, etc.
0.6%Bottled, tank, or LP gas
Population in 1990: 4,628. Population change in the 1990s: +112 (+2.4%).
Place of birth for U.S.-born residents:
This state: 2,390
Northeast: 1,529
Midwest: 85
South: 91
West: 21
72% of the 07640 zip code residents lived in the same house 5 years ago. Out of people who lived in different houses, 80% lived in this county. Out of people who lived in different counties, 50% lived in New Jersey.
95% of the 07640 zip code residents lived in the same house 1 year ago. Out of people who lived in different houses, 37% moved from this county. Out of people who lived in different houses, 33% moved from different county within same state. Out of people who lived in different houses, 33% moved from different state.
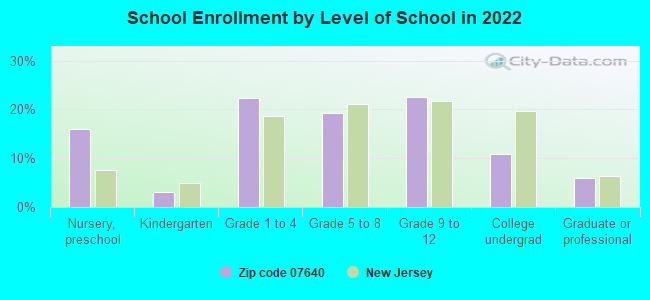
Private vs. public school enrollment:
Students in private schools in grades 1 to 8 (elementary and middle school): 36
Here:
7.3%
New Jersey:
12.3%
Students in private schools in grades 9 to 12 (high school): 53
Here:
19.5%
New Jersey:
13.1%
Students in private undergraduate colleges: 70
Here:
51.8%
New Jersey:
33.2%
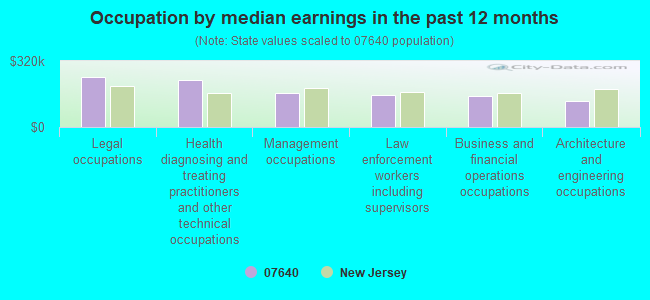
Occupation by median earnings in the past 12 months ($)
242,553Legal occupations
229,385Health diagnosing and treating practitioners and other technical occupations
167,167Management occupations
153,436Law enforcement workers including supervisors
148,494Business and financial operations occupations
127,485Architecture and engineering occupations
Top industries in this zip code by the number of employees in 2005:
Utilities: Water Supply and Irrigation Systems (100-249 employees: 1 establishment, 20-49 employees: 1 establishment, 10-19 employees: 1 establishment)
Construction: Plumbing, Heating, and Air-Conditioning Contractors (20-49: 1, 5-9: 1)
Health Care and Social Assistance: Offices of Physicians (except Mental Health Specialists) (20-49: 1, 1-4: 1)
Professional, Scientific, and Technical Services: Industrial Design Services (20-49: 1)
Other Services (except Public Administration): Religious Organizations (10-19: 1, 1-4: 3)
Health Care and Social Assistance: Offices of Dentists (5-9: 2, 1-4: 1)
Accommodation and Food Services: Caterers (10-19: 1)
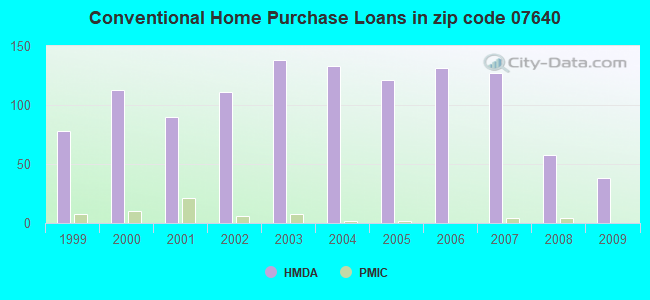
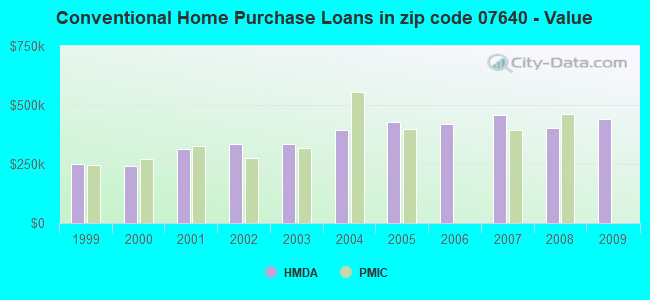
Detailed PMIC statistics for the following Tracts:0242.00
2004 - 2018 National Fire Incident Reporting System (NFIRS) incidents
According to the data from the years 2004 - 2018 the average number of fire incidents per year is 10. The highest number of reported fires - 20 took place in 2005, and the least - 0 in 2015. The data has a declining trend.
When looking into fire subcategories, the most incidents belonged to: Structure Fires (80.4%), and Outside Fires (15.4%).
Fire incident types reported to NFIRS in Zip Code 07640


 Nearest zip codes: 07675, 07624, 07648, 07641, 07647, 07627.
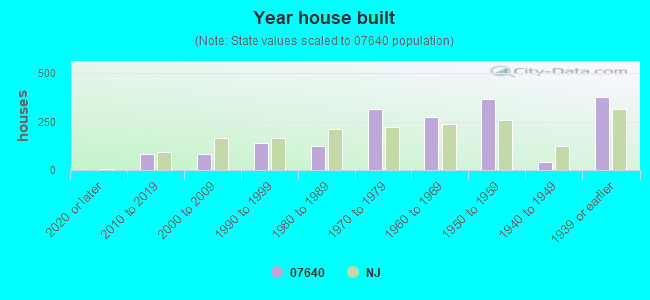


 According to the data from the years 2004 - 2018 the average number of fire incidents per year is 10. The highest number of reported fires - 20 took place in 2005, and the least - 0 in 2015. The data has a declining trend.
 When looking into fire subcategories, the most incidents belonged to: Structure Fires (80.4%), and Outside Fires (15.4%).