Estimated zip code population in 2022: 4,375 Zip code population in 2010: 3,487 Zip code population in 2000: 4,076
Houses and condos: 1,519 Renter-occupied apartments: 268
% of renters here:
20%
State:
46%
March 2022 cost of living index in zip code 10548: 144.4 (very high, U.S. average is 100)
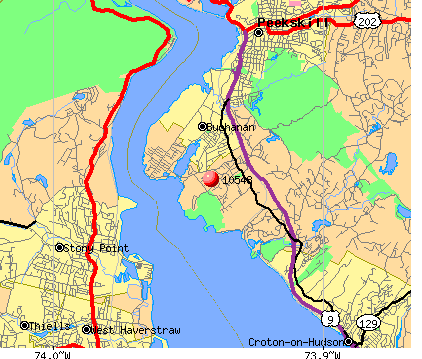
Land area: 2.3 sq. mi. Water area: 0.1 sq. mi.
Population density: 1,867 people per square mile
(low).
OSM Map
General Map
Google Map
MSN Map
OSM Map
General Map
Google Map
MSN Map
OSM Map
General Map
Google Map
MSN Map
OSM Map
General Map
Google Map
MSN Map
Please wait while loading the map...
Real estate property taxes paid for housing units in 2022:
This zip code:
1.8% ($7,837)
New York:
1.5% ($6,180)
Median real estate property taxes paid for housing units with mortgages in 2022: $7,749 (1.8%) Median real estate property taxes paid for housing units with no mortgage in 2022: $9,144 (2.1%)
Business Search- 14 Million verified businesses
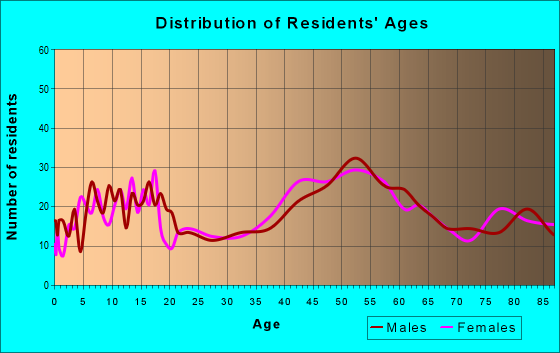
Males: 2,076
(47.5%)
Females: 2,299
(52.5%)
For population 25 years and over in 10548:
High school or higher: 93.1%
Bachelor's degree or higher: 46.0%
Graduate or professional degree: 17.1%
Unemployed: 13.8%
Mean travel time to work (commute): 38.2 minutes
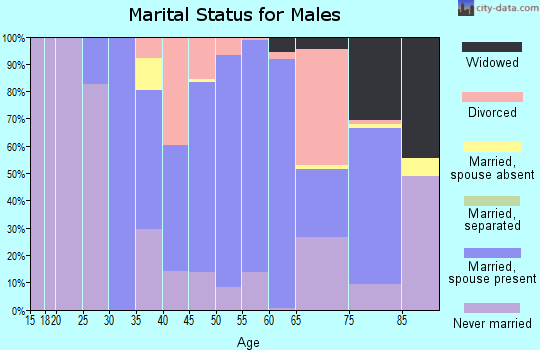
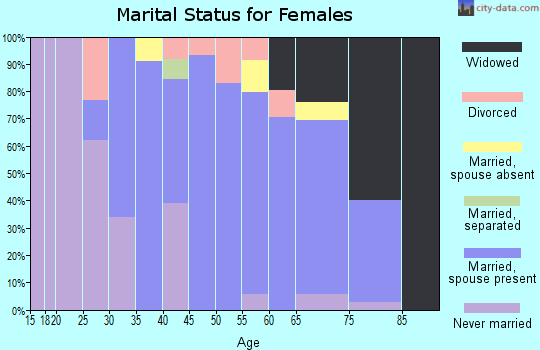
For population 15 years and over in 10548:
Never married: 37.6%
Now married: 47.3%
Separated: 3.1%
Widowed: 5.1%
Divorced: 7.0%
Zip code 10548 compared to state average:
Unemployed percentage above state average.
Black race population percentage below state average.
Foreign-born population percentage significantly below state average.
Renting percentage significantly below state average.
Length of stay since moving in significantly above state average.
Averages for the 2020 tax year for zip code 10548, filed in 2021:
Average Adjusted Gross Income (AGI) in 2020: $88,226 (Individual Income Tax Returns)
Here:
$88,226
State:
$90,930
Salary/wage: $78,179 (reported on 80.0% of returns)
Here:
$78,179
State:
$72,104
(% of AGI for various income ranges: 1008.1% for AGIs below $25k, 3546.4% for AGIs $25k-50k, 6615.8% for AGIs $50k-75k, 9540.8% for AGIs $75k-100k, 16929.6% for AGIs $100k-200k, 66848.0% for AGIs over 200k)
Taxable interest for individuals: $967 (reported on 42.9% of returns)
This zip code:
$967
New York:
$3,075
(% of AGI for various income ranges: 20.4% for AGIs below $25k, 20.5% for AGIs $25k-50k, 30.0% for AGIs $50k-75k, 96.2% for AGIs $75k-100k, 124.2% for AGIs $100k-200k, 294.0% for AGIs over 200k)
Ordinary dividends: $5,248 (reported on 28.6% of returns)
Here:
$5,248
State:
$11,095
(% of AGI for various income ranges: 33.1% for AGIs below $25k, 64.5% for AGIs $25k-50k, 83.2% for AGIs $50k-75k, 157.7% for AGIs $75k-100k, 368.3% for AGIs $100k-200k, 2298.0% for AGIs over 200k)
Net capital gain/loss in AGI: +$7,524 (reported on 24.0% of returns)
Here:
+$7,524
State:
+$44,925
(% of AGI for various income ranges: 33.1% for AGIs below $25k, 29.5% for AGIs $25k-50k, 36.8% for AGIs $50k-75k, 192.3% for AGIs $75k-100k, 256.2% for AGIs $100k-200k, 4148.0% for AGIs over 200k)
Profit/loss from business: +$9,864 (reported on 14.3% of returns)
Here:
+$9,864
State:
+$14,940
(% of AGI for various income ranges: 153.1% for AGIs below $25k, 230.0% for AGIs $25k-50k, 167.4% for AGIs $50k-75k, 54.6% for AGIs $75k-100k, 145.0% for AGIs $100k-200k, 1650.0% for AGIs over 200k)
Taxable individual retirement arrangement distribution: $17,306 (reported on 9.1% of returns)
10548:
$17,306
New York:
$19,609
(% of AGI for various income ranges: 48.8% for AGIs below $25k, 92.3% for AGIs $25k-50k, 318.4% for AGIs $50k-75k, 764.2% for AGIs $100k-200k)
Total itemized deductions: $28,041 (reported on 15.4% of returns)
Here:
$28,041
State:
$39,326
(% of AGI for various income ranges: 254.6% for AGIs below $25k, 361.1% for AGIs $50k-75k, 781.5% for AGIs $75k-100k, 1206.2% for AGIs $100k-200k, 4624.0% for AGIs over 200k)
Charity contributions: $4,717 (reported on 13.1% of returns)
Here:
$4,717
State:
$15,420
(% of AGI for various income ranges: 37.9% for AGIs $50k-75k, 90.0% for AGIs $75k-100k, 234.2% for AGIs $100k-200k, 668.0% for AGIs over 200k)
Taxes paid: $8,807 (reported on 16.0% of returns)
10548:
$8,807
State:
$9,183
(% of AGI for various income ranges: 90.8% for AGIs below $25k, 127.4% for AGIs $50k-75k, 252.3% for AGIs $75k-100k, 416.7% for AGIs $100k-200k, 1320.0% for AGIs over 200k)
Earned income credit: $1,831 (reported on 7.4% of returns)
Here:
$1,831
State:
$2,138
(% of AGI for various income ranges: 61.9% for AGIs below $25k, 35.0% for AGIs $25k-50k)
Percentage of individuals using paid preparers for their 2020 taxes: 94.3%
Here:
94%
State:
95%
(% for various income ranges: 90.5% for AGIs below $25k, 93.3% for AGIs $25k-50k, 96.3% for AGIs $50k-75k, 95.0% for AGIs $75k-100k, 97.6% for AGIs $100k-200k, 93.3% for AGIs over 200k)
Averages for the 2012 tax year for zip code 10548, filed in 2013:
Average Adjusted Gross Income (AGI) in 2012: $78,309 (Individual Income Tax Returns)
Here:
$78,309
State:
$77,088
Salary/wage: $68,488 (reported on 83.0% of returns)
Here:
$68,488
State:
$60,593
(% of AGI for various income ranges: 65.5% for AGIs below $25k, 78.4% for AGIs $25k-50k, 75.6% for AGIs $50k-75k, 70.2% for AGIs $75k-100k, 78.9% for AGIs $100k-200k, 61.9% for AGIs over 200k)
Taxable interest for individuals: $1,004 (reported on 50.3% of returns)
This zip code:
$1,004
New York:
$3,125
(% of AGI for various income ranges: 1.8% for AGIs below $25k, 0.7% for AGIs $25k-50k, 0.5% for AGIs $50k-75k, 0.7% for AGIs $75k-100k, 0.6% for AGIs $100k-200k, 0.6% for AGIs over 200k)
Ordinary dividends: $4,616 (reported on 31.4% of returns)
Here:
$4,616
State:
$10,299
(% of AGI for various income ranges: 3.1% for AGIs below $25k, 2.0% for AGIs $25k-50k, 1.5% for AGIs $50k-75k, 1.4% for AGIs $75k-100k, 1.5% for AGIs $100k-200k, 2.6% for AGIs over 200k)
Net capital gain/loss in AGI: +$2,137 (reported on 22.0% of returns)
Here:
+$2,137
State:
+$42,474
(% of AGI for various income ranges: 0.9% for AGIs $100k-200k, 1.1% for AGIs over 200k)
Profit/loss from business: +$11,610 (reported on 13.2% of returns)
Here:
+$11,610
State:
+$16,168
(% of AGI for various income ranges: 5.2% for AGIs below $25k, 2.0% for AGIs $25k-50k, 2.1% for AGIs $50k-75k, 0.7% for AGIs $75k-100k, 3.2% for AGIs $100k-200k)
Taxable individual retirement arrangement distribution: $13,758 (reported on 11.9% of returns)
10548:
$13,758
New York:
$17,621
(% of AGI for various income ranges: 4.0% for AGIs below $25k, 2.3% for AGIs $25k-50k, 3.1% for AGIs $50k-75k, 3.5% for AGIs $75k-100k, 2.5% for AGIs $100k-200k)
Total itemized deductions: $28,461 (23% of AGI, reported on 50.3% of returns)
Here:
$28,461
State:
$34,985
Here:
22.9% of AGI
State:
21.3% of AGI
(% of AGI for various income ranges: 18.7% for AGIs below $25k, 14.5% for AGIs $25k-50k, 18.7% for AGIs $50k-75k, 17.8% for AGIs $75k-100k, 20.1% for AGIs $100k-200k, 16.6% for AGIs over 200k)
Charity contributions: $2,629 (reported on 44.0% of returns)
Here:
$2,629
State:
$5,572
(% of AGI for various income ranges: 0.6% for AGIs below $25k, 0.9% for AGIs $25k-50k, 1.7% for AGIs $50k-75k, 1.5% for AGIs $75k-100k, 1.6% for AGIs $100k-200k, 1.5% for AGIs over 200k)
Taxes paid: $14,155 (reported on 50.3% of returns)
10548:
$14,155
State:
$18,656
(% of AGI for various income ranges: 5.4% for AGIs below $25k, 5.3% for AGIs $25k-50k, 7.4% for AGIs $50k-75k, 7.7% for AGIs $75k-100k, 10.0% for AGIs $100k-200k, 11.0% for AGIs over 200k)
Earned income credit: $1,525 (reported on 7.5% of returns)
Here:
$1,525
State:
$2,230
(% of AGI for various income ranges: 2.3% for AGIs below $25k, 0.7% for AGIs $25k-50k)
Percentage of individuals using paid preparers for their 2012 taxes: 65.4%
Here:
65%
State:
66%
(% for various income ranges: 57.4% for AGIs below $25k, 61.5% for AGIs $25k-50k, 66.7% for AGIs $50k-75k, 66.7% for AGIs $75k-100k, 77.1% for AGIs $100k-200k, 66.7% for AGIs over 200k)
Averages for the 2004 tax year for zip code 10548, filed in 2005:
Average Adjusted Gross Income (AGI) in 2004: $70,752 (Individual Income Tax Returns)
Here:
$70,752
State:
$59,519
Salary/wage: $66,771 (reported on 83.3% of returns)
Here:
$66,771
State:
$50,673
(% of AGI for various income ranges: 96.1% for AGIs below $10k, 60.3% for AGIs $10k-25k, 80.8% for AGIs $25k-50k, 76.5% for AGIs $50k-75k, 83.1% for AGIs $75k-100k, 78.5% for AGIs over 100k)
Taxable interest for individuals: $1,577 (reported on 65.7% of returns)
This zip code:
$1,577
New York:
$2,377
(% of AGI for various income ranges: 5.0% for AGIs below $10k, 4.1% for AGIs $10k-25k, 1.5% for AGIs $25k-50k, 2.2% for AGIs $50k-75k, 1.5% for AGIs $75k-100k, 1.1% for AGIs over 100k)
Taxable dividends: $2,488 (reported on 41.4% of returns)
Here:
$2,488
State:
$5,394
(% of AGI for various income ranges: 5.3% for AGIs below $10k, 3.2% for AGIs $10k-25k, 1.1% for AGIs $25k-50k, 1.2% for AGIs $50k-75k, 0.7% for AGIs $75k-100k, 1.6% for AGIs over 100k)
Net capital gain/loss: +$7,874 (reported on 31.0% of returns)
Here:
+$7,874
State:
+$23,581
(% of AGI for various income ranges: -2.4% for AGIs below $10k, 0.1% for AGIs $10k-25k, 0.6% for AGIs $25k-50k, 1.2% for AGIs $50k-75k, 0.0% for AGIs $75k-100k, 5.7% for AGIs over 100k)
Profit/loss from business: +$15,561 (reported on 14.6% of returns)
Here:
+$15,561
State:
+$13,809
(% of AGI for various income ranges: 11.1% for AGIs below $10k, 8.4% for AGIs $10k-25k, 1.9% for AGIs $25k-50k, 2.6% for AGIs $50k-75k, 3.6% for AGIs $75k-100k, 3.1% for AGIs over 100k)
IRA payment deduction: $3,561 (reported on 3.9% of returns)
10548:
$3,561
New York:
$3,115
Self-employed pension: $13,600 (reported on 1.0% of returns)
Here:
$13,600
New York:
$19,016
Total itemized deductions: $23,813 (22% of AGI, reported on 54.5% of returns)
Here:
$23,813
State:
$25,864
Here:
22.0% of AGI
State:
21.9% of AGI
(% of AGI for various income ranges: 19.5% for AGIs $10k-25k, 19.3% for AGIs $25k-50k, 19.4% for AGIs $50k-75k, 21.0% for AGIs $75k-100k, 17.4% for AGIs over 100k)
Charity contributions deductions: $2,857 (3% of AGI, reported on 52.4% of returns)
Here:
$2,857
State:
$4,439
Here:
2.6% of AGI
State:
3.6% of AGI
(% of AGI for various income ranges: 1.5% for AGIs $10k-25k, 2.0% for AGIs $25k-50k, 2.4% for AGIs $50k-75k, 2.0% for AGIs $75k-100k, 2.2% for AGIs over 100k)
Total tax: $11,865 (reported on 82.9% of returns)
10548:
$11,865
State:
$11,730
(% of AGI for various income ranges: 3.4% for AGIs below $10k, 5.1% for AGIs $10k-25k, 7.5% for AGIs $25k-50k, 10.0% for AGIs $50k-75k, 10.5% for AGIs $75k-100k, 17.5% for AGIs over 100k)
Earned income credit: $1,432 (reported on 5.1% of returns)
Here:
$1,432
State:
$1,757
Percentage of individuals using paid preparers for their 2004 taxes: 68.9%
Here:
69%
State:
67%
(% for various income ranges: 61.0% for AGIs below $10k, 66.8% for AGIs $10k-25k, 67.2% for AGIs $25k-50k, 68.6% for AGIs $50k-75k, 74.9% for AGIs $75k-100k, 74.4% for AGIs over 100k)
Household received Food Stamps/SNAP in the past 12 months: 122 Household did not receive Food Stamps/SNAP in the past 12 months: 1,227
Women who had a birth in the past 12 months: 7 (0 now married, 7 unmarried) Women who did not have a birth in the past 12 months: 991 (255 now married, 741 unmarried)
Housing units in zip code 10548 with a mortgage: 815 (136 second mortgage, 21 home equity loan, 118 both second mortgage and home equity loan) Houses without a mortgage: 17
Median monthly owner costs for units with a mortgage: $2,860 Median monthly owner costs for units without a mortgage: $1,214
Residents with income below the poverty level in 2022:
This zip code:
11.5%
Whole state:
14.3%
Residents with income below 50% of the poverty level in 2022:
This zip code:
6.9%
Whole state:
6.8%
Median number of rooms in houses and condos:
Here:
6.5
State:
6.3
Median number of rooms in apartments:
Here:
3.8
State:
3.8
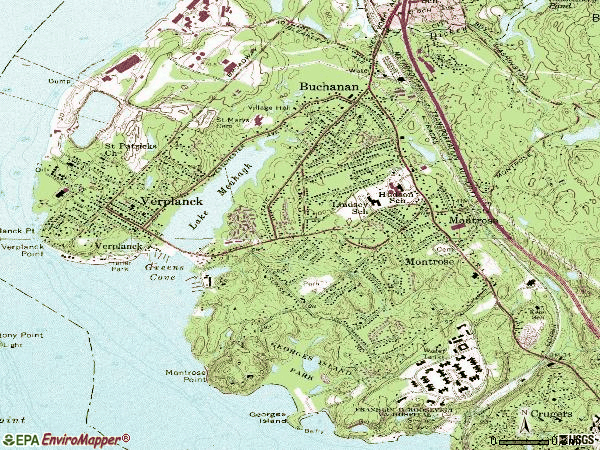
Notable locations in this zip code not listed on our city pages
Notable locations in zip code 10548: Cortlandt Yacht Club (A), Montrose Fire Department (B), Hendrick Hudson Free Library (C). Display/hide their locations on the map
In group quarters: 480 (-1 institutionalized population)
Size of family households: 368 2-persons, 194 3-persons, 255 4-persons, 72 5-persons, 39 6-persons, 40 7-or-more-persons
Size of nonfamily households: 279 1-person, 62 2-persons, 34 5-persons
522 married couples with children.
68 single-parent households (12 men, 56 women).
82.8% of residents of 10548 zip code speak English at home.
11.7% of residents speak Spanish at home (95% very well, 5% well).
4.1% of residents speak other Indo-European language at home (86% very well, 2% well, 12% not well).
0.4% of residents speak Asian or Pacific Island language at home (82% very well, 18% not well).
0.6% of residents speak other language at home (100% very well).
Foreign born population: 365 (8.4%) (69.6% of them are naturalized citizens)
This zip code:
8.4%
Whole state:
22.7%
18%Azores Islands
14%Dominica
10%Chile
8%Belgium
7%Greece
6%India
5%Ukraine
19%Irish
17%Italian
12%American
5%European
3%German
3%English
2%Polish
Year of entry for the foreign-born population
1002010 or later
512000 to 2009
261990 to 1999
252Before 1990
Facilities with environmental interests located in this zip code:
CORTLANDT AUTO BODY (130 ALBANY POST RD in MONTROSE, NY)
STATE MASTER (New York facility tracking) - AIR PROGRAM, HAZARDOUS WASTE PROGRAM Small Quantity Generators, between 100 kg and 1000 kg of hazardous waste/month (Resource Conservation and Recovery Act (tracking hazardous waste)) - notification Organizations: CHRIS BARGER (CONTACT/OWNER)
HARRY MALLES AUTO BODY INC (3 TROLLEY RD in MONTROSE, NY)
STATE MASTER (New York facility tracking) - AIR PROGRAM, Small Quantity Generators, between 100 kg and 1000 kg of hazardous waste/month (Resource Conservation and Recovery Act (tracking hazardous waste)) Business SIC classification: TOP, BODY, AND UPHOLSTERY REPAIR SHOPS AND PAINT SHOPS Business NAICS classification: AUTOMOTIVE BODY, PAINT, AND INTERIOR REPAIR AND MAINTENANCE.
HENDRICK HUDSON HS ( in MONTROSE, NY)
(National Center for Education Statistics) - STATE ID-660203060005 Organizations: HENDRICK HUDSON CSD (SCHOOL DISTRICT)
HENDRICK HUDSON SD - HIGH SCHOOL (61 TROLLEY RD in MONTROSE, NY)
COMPLIANCE ACTIVITY (Tracking inspections of insecticide, fungicide, and rodenticide, and toxic substances) Small Quantity Generators, between 100 kg and 1000 kg of hazardous waste/month (Resource Conservation and Recovery Act (tracking hazardous waste)) Organizations: HENDRICK HUDSON SCHOOL DIST (CONTACT/OWNER)
Alternative names: HENDRICK HUDSON CENTRAL SCHOOL DIST, HENDRICK HUDSON SCHOOL DIST
I U O E LOCAL 14-14B (ALBANY POST RD ACROSS FROM in MONTROSE, NY)
(Resource Conservation and Recovery Act (tracking hazardous waste))
CORTLANDT TOWN OF POLICE & AMBULANCE (RTE 9A & KINGS FERRY RD in MONTROSE, NY)
(Resource Conservation and Recovery Act (tracking hazardous waste))
CORTLANDT SEPTIC TANK SERVICE INC (22 ALBANY POST RD in MONTROSE, NY)
67% of the 10548 zip code residents lived in the same house 5 years ago. Out of people who lived in different houses, 71% lived in this county. Out of people who lived in different counties, 50% lived in New York.
88% of the 10548 zip code residents lived in the same house 1 year ago. Out of people who lived in different houses, 33% moved from this county. Out of people who lived in different houses, 56% moved from different county within same state. Out of people who lived in different houses, 12% moved from different state.
Private vs. public school enrollment:
Students in private schools in grades 1 to 8 (elementary and middle school): 34
Here:
15.1%
New York:
15.6%
Students in private schools in grades 9 to 12 (high school): 12
Here:
6.7%
New York:
15.0%
Students in private undergraduate colleges: 286
Here:
55.7%
New York:
39.2%
Occupation by median earnings in the past 12 months ($)
109,732Business and financial operations occupations
93,301Management occupations
73,728Legal occupations
60,024Health diagnosing and treating practitioners and other technical occupations
55,814Community and social service occupations
55,372Sales and related occupations
Companies with federal contracts located in this zip code:
COMMUNITY AID FOR RETARDED CHI (HUDSON VLY HLTH CARE 18 in MONTROSE, NY) 28 employees, $740000 revenue. Sheltered Workshop (JWOD Provider): $282,000 in 5 contractsin 2001
Contracts for Custodial Janitorial Services by Department of Veterans Affairs Signed by year:2000: $0; 2001: $282,000; 2002: $0; 2003: $0; 2004: $0; 2005: $0; 2006: $0.
Biggest contracts:
$96,000 with Department of Veterans Affairs for Custodial Janitorial Services. Signed on 2001-10-15. Completion date: 2006-09-15.
$93,000, same as above.Signed on 2001-03-15. Completion date: 2006-02-15.
$93,000, same as above.Signed on 2001-07-15. Completion date: 2006-09-15.
$0, same as above.Signed on 2001-10-15. Completion date: 2006-09-15.
CORTLANDT TANK SERVICES LLC (2115 ALBANY POST RD in MONTROSE, NY; small business) : $11,980 in 3 contractsfrom 2003 to 2004
$5,990 with Army for Other Environmental Services, Studies, and Analytical Support. Signed on 2004-10-07. Completion date: 2005-09-30.
$5,990, same as above.Signed on 2003-10-29. Completion date: 2004-09-30.
$0, same as above.Signed on 2003-10-29. Completion date: 2004-09-30.
Top industries in this zip code by the number of employees in 2005:
Health Care and Social Assistance: Psychiatric and Substance Abuse Hospitals (over 1000 employees: 1 establishment)
Arts, Entertainment, and Recreation: Fitness and Recreational Sports Centers (100-249: 1)
Health Care and Social Assistance: Child Day Care Services (20-49: 1, 5-9: 2)
Information: Libraries and Archives (20-49: 1)
Health Care and Social Assistance: Vocational Rehabilitation Services (20-49: 1)
Accommodation and Food Services: Food Service Contractors (20-49: 1)
Administrative and Support and Waste Management and Remediation Services: Janitorial Services (10-19: 1, 1-4: 2)
Administrative and Support and Waste Management and Remediation Services: Landscaping Services (10-19: 1, 1-4: 1)
People in group quarters in 2010:
545 people in nursing facilities/skilled-nursing facilities
People in group quarters in 2000:
139 people in other noninstitutional group quarters
97 people in mental (psychiatric) hospitals or wards
62 people in nursing homes
3 people in religious group quarters
Home Mortgage Disclosure Act Aggregated Statistics For Year 2009 (Based on 4 partial tracts)
A) FHA, FSA/RHS & VA Home Purchase Loans
B) Conventional Home Purchase Loans
C) Refinancings
D) Home Improvement Loans
F) Non-occupant Loans on < 5 Family Dwellings (A B C & D)
Number
Average Value
Number
Average Value
Number
Average Value
Number
Average Value
Number
Average Value
LOANS ORIGINATED
13
$281,069
19
$257,752
53
$239,161
1
$288,560
2
$208,210
APPLICATIONS APPROVED, NOT ACCEPTED
0
$0
1
$181,820
6
$271,940
1
$11,730
0
$0
APPLICATIONS DENIED
1
$446,910
7
$338,494
35
$291,340
5
$53,020
1
$152,490
APPLICATIONS WITHDRAWN
2
$334,305
2
$325,505
18
$339,453
0
$0
0
$0
FILES CLOSED FOR INCOMPLETENESS
1
$376,530
1
$733,130
4
$176,830
1
$146,630
0
$0
Aggregated Statistics For Year 2008 (Based on 4 partial tracts)
A) FHA, FSA/RHS & VA Home Purchase Loans
B) Conventional Home Purchase Loans
C) Refinancings
D) Home Improvement Loans
F) Non-occupant Loans on < 5 Family Dwellings (A B C & D)
G) Loans On Manufactured Home Dwelling (A B C & D)
Number
Average Value
Number
Average Value
Number
Average Value
Number
Average Value
Number
Average Value
Number
Average Value
LOANS ORIGINATED
4
$258,940
31
$246,843
30
$217,513
6
$123,165
2
$195,305
0
$0
APPLICATIONS APPROVED, NOT ACCEPTED
0
$0
9
$286,472
5
$207,386
0
$0
1
$364,800
0
$0
APPLICATIONS DENIED
1
$426,970
7
$245,827
27
$247,013
7
$109,760
0
$0
0
$0
APPLICATIONS WITHDRAWN
1
$387,090
2
$340,755
14
$460,989
1
$52,790
2
$1,260,975
1
$2,346,000
FILES CLOSED FOR INCOMPLETENESS
0
$0
3
$385,860
4
$320,815
1
$105,570
0
$0
0
$0
Aggregated Statistics For Year 2007 (Based on 4 partial tracts)
A) FHA, FSA/RHS & VA Home Purchase Loans
B) Conventional Home Purchase Loans
C) Refinancings
D) Home Improvement Loans
F) Non-occupant Loans on < 5 Family Dwellings (A B C & D)
Number
Average Value
Number
Average Value
Number
Average Value
Number
Average Value
Number
Average Value
LOANS ORIGINATED
1
$303,810
63
$252,996
61
$230,273
12
$69,500
7
$183,993
APPLICATIONS APPROVED, NOT ACCEPTED
0
$0
8
$139,440
15
$253,681
4
$53,958
0
$0
APPLICATIONS DENIED
0
$0
15
$248,527
47
$272,086
15
$132,940
4
$207,620
APPLICATIONS WITHDRAWN
0
$0
11
$282,480
26
$214,118
5
$54,192
0
$0
FILES CLOSED FOR INCOMPLETENESS
0
$0
2
$163,635
7
$344,359
1
$58,650
1
$286,210
Aggregated Statistics For Year 2006 (Based on 4 partial tracts)
A) FHA, FSA/RHS & VA Home Purchase Loans
B) Conventional Home Purchase Loans
C) Refinancings
D) Home Improvement Loans
F) Non-occupant Loans on < 5 Family Dwellings (A B C & D)
Number
Average Value
Number
Average Value
Number
Average Value
Number
Average Value
Number
Average Value
LOANS ORIGINATED
1
$518,470
62
$243,416
94
$226,152
19
$147,551
2
$279,175
APPLICATIONS APPROVED, NOT ACCEPTED
0
$0
8
$229,469
26
$201,395
5
$68,034
1
$93,840
APPLICATIONS DENIED
0
$0
20
$263,690
43
$302,088
11
$144,173
1
$509,080
APPLICATIONS WITHDRAWN
0
$0
7
$336,819
42
$282,561
9
$53,437
0
$0
FILES CLOSED FOR INCOMPLETENESS
0
$0
4
$277,708
7
$228,064
1
$117,300
0
$0
Aggregated Statistics For Year 2005 (Based on 4 partial tracts)
A) FHA, FSA/RHS & VA Home Purchase Loans
B) Conventional Home Purchase Loans
C) Refinancings
D) Home Improvement Loans
E) Loans on Dwellings For 5+ Families
F) Non-occupant Loans on < 5 Family Dwellings (A B C & D)
G) Loans On Manufactured Home Dwelling (A B C & D)
Number
Average Value
Number
Average Value
Number
Average Value
Number
Average Value
Number
Average Value
Number
Average Value
Number
Average Value
LOANS ORIGINATED
1
$220,520
81
$244,027
107
$214,012
15
$150,144
2
$689,140
7
$249,011
0
$0
APPLICATIONS APPROVED, NOT ACCEPTED
0
$0
14
$258,479
30
$231,589
7
$82,947
0
$0
2
$253,370
0
$0
APPLICATIONS DENIED
0
$0
7
$239,963
43
$254,763
20
$82,931
0
$0
5
$146,156
1
$86,800
APPLICATIONS WITHDRAWN
0
$0
16
$179,909
79
$223,583
5
$272,840
1
$175,950
0
$0
0
$0
FILES CLOSED FOR INCOMPLETENESS
0
$0
6
$220,720
9
$217,527
1
$164,220
0
$0
1
$330,790
0
$0
Aggregated Statistics For Year 2004 (Based on 4 partial tracts)
A) FHA, FSA/RHS & VA Home Purchase Loans
B) Conventional Home Purchase Loans
C) Refinancings
D) Home Improvement Loans
E) Loans on Dwellings For 5+ Families
F) Non-occupant Loans on < 5 Family Dwellings (A B C & D)
Number
Average Value
Number
Average Value
Number
Average Value
Number
Average Value
Number
Average Value
Number
Average Value
LOANS ORIGINATED
1
$160,700
75
$241,263
112
$210,315
20
$71,788
2
$799,400
14
$229,824
APPLICATIONS APPROVED, NOT ACCEPTED
0
$0
12
$200,974
23
$223,074
7
$79,597
0
$0
2
$248,090
APPLICATIONS DENIED
0
$0
14
$323,581
34
$242,880
21
$92,779
0
$0
7
$246,666
APPLICATIONS WITHDRAWN
0
$0
14
$253,201
55
$208,346
7
$142,603
0
$0
4
$252,195
FILES CLOSED FOR INCOMPLETENESS
0
$0
2
$226,390
9
$225,607
1
$82,110
0
$0
2
$228,150
Aggregated Statistics For Year 2003 (Based on 4 partial tracts)
A) FHA, FSA/RHS & VA Home Purchase Loans
B) Conventional Home Purchase Loans
C) Refinancings
D) Home Improvement Loans
F) Non-occupant Loans on < 5 Family Dwellings (A B C & D)
Number
Average Value
Number
Average Value
Number
Average Value
Number
Average Value
Number
Average Value
LOANS ORIGINATED
1
$358,940
66
$203,356
211
$178,348
6
$37,537
13
$165,664
APPLICATIONS APPROVED, NOT ACCEPTED
0
$0
15
$219,820
35
$191,076
1
$70,380
4
$127,858
APPLICATIONS DENIED
0
$0
18
$202,017
40
$177,768
5
$24,634
5
$120,116
APPLICATIONS WITHDRAWN
0
$0
7
$217,340
51
$170,300
2
$58,650
4
$133,722
FILES CLOSED FOR INCOMPLETENESS
0
$0
1
$378,880
13
$191,199
1
$129,030
0
$0
Aggregated Statistics For Year 2002 (Based on 4 partial tracts)
A) FHA, FSA/RHS & VA Home Purchase Loans
B) Conventional Home Purchase Loans
C) Refinancings
D) Home Improvement Loans
E) Loans on Dwellings For 5+ Families
F) Non-occupant Loans on < 5 Family Dwellings (A B C & D)
Number
Average Value
Number
Average Value
Number
Average Value
Number
Average Value
Number
Average Value
Number
Average Value
LOANS ORIGINATED
0
$0
53
$227,142
137
$171,038
8
$37,242
2
$550,975
7
$134,727
APPLICATIONS APPROVED, NOT ACCEPTED
0
$0
18
$176,146
19
$170,826
3
$115,603
0
$0
2
$223,455
APPLICATIONS DENIED
0
$0
11
$176,484
38
$179,839
12
$25,318
0
$0
2
$151,315
APPLICATIONS WITHDRAWN
0
$0
10
$181,684
44
$168,200
0
$0
0
$0
1
$52,790
FILES CLOSED FOR INCOMPLETENESS
1
$143,110
1
$245,160
8
$186,948
0
$0
0
$0
0
$0
Aggregated Statistics For Year 2001 (Based on 4 partial tracts)
A) FHA, FSA/RHS & VA Home Purchase Loans
B) Conventional Home Purchase Loans
C) Refinancings
D) Home Improvement Loans
E) Loans on Dwellings For 5+ Families
F) Non-occupant Loans on < 5 Family Dwellings (A B C & D)
Number
Average Value
Number
Average Value
Number
Average Value
Number
Average Value
Number
Average Value
Number
Average Value
LOANS ORIGINATED
1
$159,530
58
$171,351
98
$153,380
7
$30,330
1
$211,140
5
$130,672
APPLICATIONS APPROVED, NOT ACCEPTED
0
$0
4
$103,810
22
$136,015
4
$89,440
0
$0
2
$103,225
APPLICATIONS DENIED
0
$0
4
$212,312
19
$170,887
6
$9,775
0
$0
0
$0
APPLICATIONS WITHDRAWN
0
$0
5
$161,404
34
$155,112
14
$41,725
0
$0
0
$0
FILES CLOSED FOR INCOMPLETENESS
0
$0
0
$0
6
$147,798
0
$0
0
$0
0
$0
Aggregated Statistics For Year 2000 (Based on 2 partial tracts)
A) FHA, FSA/RHS & VA Home Purchase Loans
B) Conventional Home Purchase Loans
C) Refinancings
D) Home Improvement Loans
E) Loans on Dwellings For 5+ Families
F) Non-occupant Loans on < 5 Family Dwellings (A B C & D)
Number
Average Value
Number
Average Value
Number
Average Value
Number
Average Value
Number
Average Value
Number
Average Value
LOANS ORIGINATED
6
$133,527
38
$165,918
34
$111,642
13
$46,559
1
$381,230
8
$179,909
APPLICATIONS APPROVED, NOT ACCEPTED
0
$0
9
$159,137
11
$87,015
5
$31,202
0
$0
0
$0
APPLICATIONS DENIED
0
$0
7
$150,814
16
$111,802
6
$63,147
0
$0
0
$0
APPLICATIONS WITHDRAWN
0
$0
9
$145,582
15
$74,290
2
$46,920
2
$225,805
0
$0
FILES CLOSED FOR INCOMPLETENESS
2
$180,055
2
$136,070
5
$103,224
0
$0
0
$0
1
$164,220
Aggregated Statistics For Year 1999 (Based on 2 partial tracts)
A) FHA, FSA/RHS & VA Home Purchase Loans
B) Conventional Home Purchase Loans
C) Refinancings
D) Home Improvement Loans
E) Loans on Dwellings For 5+ Families
F) Non-occupant Loans on < 5 Family Dwellings (A B C & D)
Detailed PMIC statistics for the following Tracts:0146.04
2002 - 2018 National Fire Incident Reporting System (NFIRS) incidents
According to the data from the years 2002 - 2018 the average number of fires per year is 13. The highest number of fire incidents - 31 took place in 2003, and the least - 5 in 2012. The data has a declining trend.
When looking into fire subcategories, the most reports belonged to: Structure Fires (47.3%), and Outside Fires (40.5%).
Fire incident types reported to NFIRS in Zip Code 10548


 Nearest zip codes: 10511, 10596, 10566, 10993, 10567, 10927.


 According to the data from the years 2002 - 2018 the average number of fires per year is 13. The highest number of fire incidents - 31 took place in 2003, and the least - 5 in 2012. The data has a declining trend.
 When looking into fire subcategories, the most reports belonged to: Structure Fires (47.3%), and Outside Fires (40.5%).