Estimated zip code population in 2022: 631 Zip code population in 2010: 968 Zip code population in 2000: 445
March 2022 cost of living index in zip code 10597: 113.3 (more than average, U.S. average is 100)
Land area: 3.3 sq. mi. Water area: 0.2 sq. mi.
Population density: 189 people per square mile
(very low).
OSM Map
General Map
Google Map
MSN Map
OSM Map
General Map
Google Map
MSN Map
OSM Map
General Map
Google Map
MSN Map
OSM Map
General Map
Google Map
MSN Map
Please wait while loading the map...
Real estate property taxes paid for housing units in 2022:
This zip code:
1.0% ($9,805)
New York:
1.5% ($6,180)
Median real estate property taxes paid for housing units with mortgages in 2022: $9,858 (1.0%) Median real estate property taxes paid for housing units with no mortgage in 2022: $9,755 (0.5%)
Business Search- 14 Million verified businesses
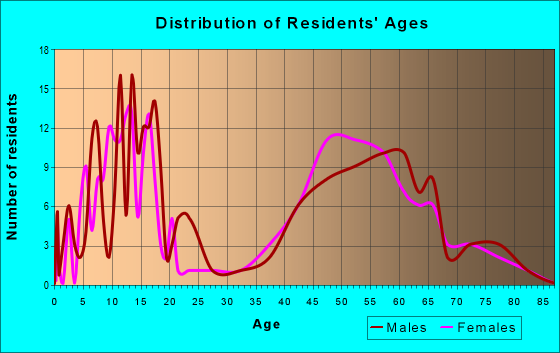
Males: 334
(53.0%)
Females: 297
(47.0%)
For population 25 years and over in 10597:
High school or higher: 97.3%
Bachelor's degree or higher: 84.5%
Graduate or professional degree: 61.4%
Unemployed: 2.7%
Mean travel time to work (commute): 53.1 minutes
For population 15 years and over in 10597:
Never married: 23.6%
Now married: 70.4%
Separated: 3.5%
Widowed: 2.4%
Divorced: 0.0%
Zip code 10597 compared to state average:
Median household income significantly above state average.
Median house value significantly above state average.
Unemployed percentage below state average.
Black race population percentage significantly below state average.
Foreign-born population percentage significantly below state average.
Renting percentage significantly below state average.
Number of rooms per house significantly above state average.
House age below state average.
Percentage of population with a bachelor's degree or higher above state average.
Estimated median house/condo value in 2022: $1,005,222
10597:
$1,005,222
New York:
$400,400
Median resident age:
This zip code:
37.4 years
New York median age:
40.0 years
Average household size:
This zip code:
3.0 people
New York:
2.5 people
Averages for the 2020 tax year for zip code 10597, filed in 2021:
Average Adjusted Gross Income (AGI) in 2020: $454,257 (Individual Income Tax Returns)
Here:
$454,257
State:
$90,930
Salary/wage: $317,275 (reported on 76.6% of returns)
Here:
$317,275
State:
$72,104
(% of AGI for various income ranges: 723.3% for AGIs below $25k, 20405.0% for AGIs $100k-200k, 255952.5% for AGIs over 200k)
Taxable interest for individuals: $10,066 (reported on 61.7% of returns)
This zip code:
$10,066
New York:
$3,075
(% of AGI for various income ranges: 80.0% for AGIs below $25k, 123.3% for AGIs $50k-75k, 287.5% for AGIs $100k-200k, 6797.5% for AGIs over 200k)
Ordinary dividends: $34,654 (reported on 59.6% of returns)
Here:
$34,654
State:
$11,095
(% of AGI for various income ranges: 305.0% for AGIs below $25k, 266.7% for AGIs $50k-75k, 962.5% for AGIs $100k-200k, 22637.5% for AGIs over 200k)
Net capital gain/loss in AGI: +$127,621 (reported on 61.7% of returns)
Here:
+$127,621
State:
+$44,925
(% of AGI for various income ranges: 158.3% for AGIs below $25k, 96.7% for AGIs $50k-75k, 887.5% for AGIs $100k-200k, 91327.5% for AGIs over 200k)
Profit/loss from business: +$62,050 (reported on 21.3% of returns)
Here:
+$62,050
State:
+$14,940
(% of AGI for various income ranges: 2613.3% for AGIs $50k-75k, 13552.5% for AGIs over 200k)
Taxable individual retirement arrangement distribution: $90,483 (reported on 12.8% of returns)
10597:
$90,483
New York:
$19,609
(% of AGI for various income ranges: 1048.3% for AGIs below $25k, 12000.0% for AGIs over 200k)
Self-employed (Keogh) retirement plans: $31,800 (reported on 6.4% of returns)
10597:
$31,800
New York:
$32,497
(% of AGI for various income ranges: 2385.0% for AGIs over 200k)
Total itemized deductions: $56,206 (reported on 38.3% of returns)
Here:
$56,206
State:
$39,326
(% of AGI for various income ranges: 1056.7% for AGIs below $25k, 2962.5% for AGIs $100k-200k, 20745.0% for AGIs over 200k)
Charity contributions: $25,427 (reported on 31.9% of returns)
Here:
$25,427
State:
$15,420
(% of AGI for various income ranges: 432.5% for AGIs $100k-200k, 9102.5% for AGIs over 200k)
Taxes paid: $9,978 (reported on 38.3% of returns)
10597:
$9,978
State:
$9,183
(% of AGI for various income ranges: 268.3% for AGIs below $25k, 805.0% for AGIs $100k-200k, 3282.5% for AGIs over 200k)
Percentage of individuals using paid preparers for their 2020 taxes: 97.9%
Here:
98%
State:
95%
(% for various income ranges: 100.0% for AGIs below $25k, 100.0% for AGIs $25k-50k, 100.0% for AGIs $50k-75k, 100.0% for AGIs $75k-100k, 100.0% for AGIs $100k-200k, 95.2% for AGIs over 200k)
Averages for the 2012 tax year for zip code 10597, filed in 2013:
Average Adjusted Gross Income (AGI) in 2012: $298,583 (Individual Income Tax Returns)
Here:
$298,583
State:
$77,088
Salary/wage: $239,311 (reported on 73.1% of returns)
Here:
$239,311
State:
$60,593
(% of AGI for various income ranges: 63.4% for AGIs below $25k, 74.9% for AGIs $25k-50k, 143.8% for AGIs $50k-75k, 46.1% for AGIs $100k-200k, 59.0% for AGIs over 200k)
Taxable interest for individuals: $15,519 (reported on 59.6% of returns)
This zip code:
$15,519
New York:
$3,125
(% of AGI for various income ranges: 1.3% for AGIs below $25k, 4.4% for AGIs $25k-50k, 1.8% for AGIs $50k-75k, 1.3% for AGIs $100k-200k, 3.3% for AGIs over 200k)
Ordinary dividends: $21,747 (reported on 57.7% of returns)
Here:
$21,747
State:
$10,299
(% of AGI for various income ranges: 7.8% for AGIs below $25k, 10.5% for AGIs $25k-50k, 9.4% for AGIs $50k-75k, 6.6% for AGIs $100k-200k, 3.9% for AGIs over 200k)
Net capital gain/loss in AGI: +$65,189 (reported on 51.9% of returns)
Here:
+$65,189
State:
+$42,474
(% of AGI for various income ranges: 4.8% for AGIs below $25k, 5.7% for AGIs $100k-200k, 12.3% for AGIs over 200k)
Profit/loss from business: +$64,742 (reported on 23.1% of returns)
Here:
+$64,742
State:
+$16,168
(% of AGI for various income ranges: 17.7% for AGIs below $25k, 3.6% for AGIs $100k-200k, 5.2% for AGIs over 200k)
Taxable individual retirement arrangement distribution: $66,786 (reported on 13.5% of returns)
10597:
$66,786
New York:
$17,621
Self-employment retirement plans: $40,000 (reported on 5.8% of returns)
10597:
$40,000
New York:
$27,330
(% of AGI for various income ranges: 0.9% for AGIs over 200k)
Total itemized deductions: $92,347 (20% of AGI, reported on 61.5% of returns)
Here:
$92,347
State:
$34,985
Here:
19.5% of AGI
State:
21.3% of AGI
(% of AGI for various income ranges: 46.3% for AGIs below $25k, 63.4% for AGIs $50k-75k, 33.4% for AGIs $100k-200k, 17.8% for AGIs over 200k)
Charity contributions: $11,738 (reported on 50.0% of returns)
Here:
$11,738
State:
$5,572
(% of AGI for various income ranges: 4.0% for AGIs $25k-50k, 2.5% for AGIs $100k-200k, 2.0% for AGIs over 200k)
Taxes paid: $58,438 (reported on 61.5% of returns)
10597:
$58,438
State:
$18,656
(% of AGI for various income ranges: 22.5% for AGIs below $25k, 21.7% for AGIs $50k-75k, 18.8% for AGIs $100k-200k, 11.7% for AGIs over 200k)
Percentage of individuals using paid preparers for their 2012 taxes: 75.0%
Here:
75%
State:
66%
(% for various income ranges: 73.3% for AGIs below $25k, 66.7% for AGIs $25k-50k, 100.0% for AGIs $50k-75k, 71.4% for AGIs $100k-200k, 84.2% for AGIs over 200k)
Averages for the 2004 tax year for zip code 10597, filed in 2005:
Average Adjusted Gross Income (AGI) in 2004: $317,262 (Individual Income Tax Returns)
Here:
$317,262
State:
$59,519
Salary/wage: $282,048 (reported on 72.5% of returns)
Here:
$282,048
State:
$50,673
(% of AGI for various income ranges: 157.6% for AGIs below $10k, 57.8% for AGIs $10k-25k, 73.9% for AGIs $25k-50k, 77.2% for AGIs $50k-75k, 68.9% for AGIs $75k-100k, 64.1% for AGIs over 100k)
Taxable interest for individuals: $10,402 (reported on 82.6% of returns)
This zip code:
$10,402
New York:
$2,377
(% of AGI for various income ranges: 55.2% for AGIs below $10k, 3.2% for AGIs $10k-25k, 1.1% for AGIs $25k-50k, 1.9% for AGIs $50k-75k, 0.4% for AGIs $75k-100k, 2.7% for AGIs over 100k)
Taxable dividends: $15,622 (reported on 73.5% of returns)
Here:
$15,622
State:
$5,394
(% of AGI for various income ranges: 56.8% for AGIs below $10k, 10.6% for AGIs $10k-25k, 4.8% for AGIs $25k-50k, 2.8% for AGIs $50k-75k, 4.9% for AGIs $75k-100k, 3.5% for AGIs over 100k)
Net capital gain/loss: +$53,232 (reported on 68.1% of returns)
Here:
+$53,232
State:
+$23,581
(% of AGI for various income ranges: -75.2% for AGIs below $10k, -5.2% for AGIs $10k-25k, 5.3% for AGIs $50k-75k, -1.1% for AGIs $75k-100k, 11.9% for AGIs over 100k)
Profit/loss from business: +$50,175 (reported on 22.3% of returns)
Here:
+$50,175
State:
+$13,809
(% of AGI for various income ranges: -0.8% for AGIs below $10k, 9.4% for AGIs $50k-75k, 3.6% for AGIs over 100k)
IRA payment deduction: $3,438 (reported on 3.5% of returns)
10597:
$3,438
New York:
$3,115
Self-employed pension: $31,243 (reported on 8.0% of returns)
Here:
$31,243
New York:
$19,016
Total itemized deductions: $80,891 (17% of AGI, reported on 67.5% of returns)
Here:
$80,891
State:
$25,864
Here:
17.4% of AGI
State:
21.9% of AGI
(% of AGI for various income ranges: 160.8% for AGIs below $10k, 29.5% for AGIs $25k-50k, 43.8% for AGIs $50k-75k, 33.2% for AGIs $75k-100k, 16.5% for AGIs over 100k)
Charity contributions deductions: $12,297 (3% of AGI, reported on 63.6% of returns)
Here:
$12,297
State:
$4,439
Here:
2.5% of AGI
State:
3.6% of AGI
(% of AGI for various income ranges: 2.7% for AGIs $25k-50k, 2.8% for AGIs $50k-75k, 2.9% for AGIs $75k-100k, 2.5% for AGIs over 100k)
Total tax: $92,557 (reported on 82.2% of returns)
10597:
$92,557
State:
$11,730
(% of AGI for various income ranges: 15.2% for AGIs below $10k, 5.8% for AGIs $10k-25k, 7.6% for AGIs $25k-50k, 9.0% for AGIs $50k-75k, 11.0% for AGIs $75k-100k, 24.5% for AGIs over 100k)
Percentage of individuals using paid preparers for their 2004 taxes: 82.2%
Here:
82%
State:
67%
(% for various income ranges: 87.0% for AGIs below $10k, 76.7% for AGIs $10k-25k, 71.4% for AGIs $25k-50k, 53.8% for AGIs $50k-75k, 70.8% for AGIs $75k-100k, 86.1% for AGIs over 100k)
Household received Food Stamps/SNAP in the past 12 months: 0 Household did not receive Food Stamps/SNAP in the past 12 months: 206
Women who did not have a birth in the past 12 months: 137 (72 now married, 64 unmarried)
Housing units in zip code 10597 with a mortgage: 140 (49 second mortgage, 50 both second mortgage and home equity loan) Median monthly owner costs for units with a mortgage: $3,860 Median monthly owner costs for units without a mortgage: $1,487
Median number of rooms in houses and condos:
Here:
9.8
State:
6.3
Notable locations in this zip code not listed on our city pages
Size of family households: 100 2-persons, 16 3-persons, 68 4-persons, 20 5-persons
113 married couples with children.
40 single-parent households (40 women).
94.7% of residents of 10597 zip code speak English at home.
4.8% of residents speak Spanish at home (100% very well).
Foreign born population: 55 (8.8%) (100.0% of them are naturalized citizens)
This zip code:
8.8%
Whole state:
22.7%
35%Romania
26%Barbados
26%Dominica
21%English
21%Italian
9%Russian
7%European
6%British
5%Polish
4%Irish
Year of entry for the foreign-born population
162010 or later
212000 to 2009
01990 to 1999
16Before 1990
68.2%Fuel oil, kerosene, etc.
21.9%Bottled, tank, or LP gas
10.2%Electricity
Population in 1990: 415. Population change in the 1990s: +30 (+7.2%).
Place of birth for U.S.-born residents:
This state: 374
Northeast: 106
Midwest: 38
South: 32
West: 26
46% of the 10597 zip code residents lived in the same house 5 years ago. Out of people who lived in different houses, 52% lived in this county. Out of people who lived in different counties, 50% lived in New York.
83% of the 10597 zip code residents lived in the same house 1 year ago. Out of people who lived in different houses, 26% moved from this county. Out of people who lived in different houses, 74% moved from different county within same state.
Private vs. public school enrollment:
Students in private schools in grades 1 to 8 (elementary and middle school):
Here:
0.0%
New York:
15.6%
Students in private schools in grades 9 to 12 (high school):
Here:
0.0%
New York:
15.0%
Students in private undergraduate colleges:
Here:
0.0%
New York:
39.2%
Occupation by median earnings in the past 12 months ($)
108,590Business and financial operations occupations
91,692Management occupations
Top industries in this zip code by the number of employees in 2005:
Arts, Entertainment, and Recreation: Golf Courses and Country Clubs (20-49 employees: 1 establishment)
Construction: Other Building Equipment Contractors (10-19: 1)
Administrative and Support and Waste Management and Remediation Services: Office Administrative Services (5-9: 1)
Professional, Scientific, and Technical Services: Marketing Consulting Services (1-4: 2)
Information: Motion Picture and Video Production (1-4: 1)
Arts, Entertainment, and Recreation: Independent Artists, Writers, and Performers (1-4: 1)
Wholesale Trade: Wholesale Trade Agents and Brokers (1-4: 1)
Information: Book Publishers (1-4: 1)
Professional, Scientific, and Technical Services: All Other Professional, Scientific, and Technical Services (1-4: 1)
Home Mortgage Disclosure Act Aggregated Statistics For Year 2009 (Based on 2 partial tracts)
A) FHA, FSA/RHS & VA Home Purchase Loans
B) Conventional Home Purchase Loans
C) Refinancings
D) Home Improvement Loans
F) Non-occupant Loans on < 5 Family Dwellings (A B C & D)
Number
Average Value
Number
Average Value
Number
Average Value
Number
Average Value
Number
Average Value
LOANS ORIGINATED
1
$191,950
9
$513,436
25
$485,840
1
$570,840
2
$942,850
APPLICATIONS APPROVED, NOT ACCEPTED
0
$0
1
$664,170
3
$456,530
0
$0
0
$0
APPLICATIONS DENIED
0
$0
1
$79,320
12
$445,117
0
$0
1
$175,560
APPLICATIONS WITHDRAWN
0
$0
1
$564,760
9
$403,092
0
$0
1
$150,180
FILES CLOSED FOR INCOMPLETENESS
0
$0
0
$0
2
$436,130
0
$0
0
$0
Aggregated Statistics For Year 2008 (Based on 2 partial tracts)
B) Conventional Home Purchase Loans
C) Refinancings
D) Home Improvement Loans
F) Non-occupant Loans on < 5 Family Dwellings (A B C & D)
Number
Average Value
Number
Average Value
Number
Average Value
Number
Average Value
LOANS ORIGINATED
12
$548,652
11
$922,467
2
$227,780
1
$1,127,930
APPLICATIONS APPROVED, NOT ACCEPTED
2
$581,150
4
$454,570
0
$0
0
$0
APPLICATIONS DENIED
2
$505,400
8
$561,784
1
$637,200
0
$0
APPLICATIONS WITHDRAWN
2
$516,770
3
$827,130
0
$0
0
$0
FILES CLOSED FOR INCOMPLETENESS
1
$321,770
1
$745,340
1
$92,540
0
$0
Aggregated Statistics For Year 2007 (Based on 2 partial tracts)
B) Conventional Home Purchase Loans
C) Refinancings
D) Home Improvement Loans
F) Non-occupant Loans on < 5 Family Dwellings (A B C & D)
Number
Average Value
Number
Average Value
Number
Average Value
Number
Average Value
LOANS ORIGINATED
20
$598,126
17
$506,979
2
$448,160
2
$816,730
APPLICATIONS APPROVED, NOT ACCEPTED
6
$516,593
3
$380,207
1
$83,810
1
$491,780
APPLICATIONS DENIED
4
$544,598
9
$708,416
1
$281,590
1
$1,063,680
APPLICATIONS WITHDRAWN
2
$581,550
4
$328,055
1
$126,120
0
$0
FILES CLOSED FOR INCOMPLETENESS
0
$0
1
$504,740
1
$118,980
0
$0
Aggregated Statistics For Year 2006 (Based on 2 partial tracts)
B) Conventional Home Purchase Loans
C) Refinancings
D) Home Improvement Loans
F) Non-occupant Loans on < 5 Family Dwellings (A B C & D)
Number
Average Value
Number
Average Value
Number
Average Value
Number
Average Value
LOANS ORIGINATED
19
$664,493
17
$379,336
5
$205,228
2
$1,002,605
APPLICATIONS APPROVED, NOT ACCEPTED
2
$496,940
5
$426,054
1
$436,260
1
$432,820
APPLICATIONS DENIED
4
$585,712
9
$478,123
2
$67,025
0
$0
APPLICATIONS WITHDRAWN
4
$726,902
8
$488,810
1
$174,770
1
$1,242,150
FILES CLOSED FOR INCOMPLETENESS
1
$525,100
2
$432,295
1
$62,130
0
$0
Aggregated Statistics For Year 2005 (Based on 2 partial tracts)
B) Conventional Home Purchase Loans
C) Refinancings
D) Home Improvement Loans
F) Non-occupant Loans on < 5 Family Dwellings (A B C & D)
Number
Average Value
Number
Average Value
Number
Average Value
Number
Average Value
LOANS ORIGINATED
26
$546,413
29
$454,996
4
$389,792
3
$550,480
APPLICATIONS APPROVED, NOT ACCEPTED
3
$495,750
5
$521,186
1
$171,860
1
$171,860
APPLICATIONS DENIED
6
$547,043
12
$465,344
1
$290,310
2
$445,515
APPLICATIONS WITHDRAWN
6
$472,923
13
$481,798
3
$415,900
2
$423,305
FILES CLOSED FOR INCOMPLETENESS
1
$685,850
2
$567,270
0
$0
0
$0
Aggregated Statistics For Year 2004 (Based on 2 partial tracts)
B) Conventional Home Purchase Loans
C) Refinancings
D) Home Improvement Loans
F) Non-occupant Loans on < 5 Family Dwellings (A B C & D)
Number
Average Value
Number
Average Value
Number
Average Value
Number
Average Value
LOANS ORIGINATED
25
$521,630
28
$421,822
3
$187,107
3
$620,900
APPLICATIONS APPROVED, NOT ACCEPTED
3
$517,077
5
$278,836
0
$0
0
$0
APPLICATIONS DENIED
2
$540,830
11
$436,933
3
$202,000
0
$0
APPLICATIONS WITHDRAWN
5
$499,558
16
$374,969
1
$56,320
1
$338,430
FILES CLOSED FOR INCOMPLETENESS
1
$609,180
4
$447,562
1
$79,320
0
$0
Aggregated Statistics For Year 2003 (Based on 2 partial tracts)
B) Conventional Home Purchase Loans
C) Refinancings
D) Home Improvement Loans
F) Non-occupant Loans on < 5 Family Dwellings (A B C & D)
Number
Average Value
Number
Average Value
Number
Average Value
Number
Average Value
LOANS ORIGINATED
23
$486,151
111
$349,253
1
$118,190
3
$487,993
APPLICATIONS APPROVED, NOT ACCEPTED
4
$560,925
18
$344,498
1
$56,850
1
$449,740
APPLICATIONS DENIED
3
$395,983
22
$357,601
2
$172,390
1
$514,520
APPLICATIONS WITHDRAWN
3
$529,330
18
$407,705
0
$0
0
$0
FILES CLOSED FOR INCOMPLETENESS
1
$509,760
6
$317,060
0
$0
0
$0
Aggregated Statistics For Year 2002 (Based on 2 partial tracts)
B) Conventional Home Purchase Loans
C) Refinancings
D) Home Improvement Loans
F) Non-occupant Loans on < 5 Family Dwellings (A B C & D)
Number
Average Value
Number
Average Value
Number
Average Value
Number
Average Value
LOANS ORIGINATED
29
$419,475
73
$332,514
6
$114,308
3
$332,617
APPLICATIONS APPROVED, NOT ACCEPTED
6
$439,037
12
$336,890
4
$90,292
1
$410,350
APPLICATIONS DENIED
2
$464,285
17
$386,506
3
$123,123
1
$125,060
APPLICATIONS WITHDRAWN
6
$465,565
11
$307,569
2
$113,295
0
$0
FILES CLOSED FOR INCOMPLETENESS
1
$1,406,080
7
$297,903
0
$0
0
$0
Aggregated Statistics For Year 2001 (Based on 2 partial tracts)
B) Conventional Home Purchase Loans
C) Refinancings
D) Home Improvement Loans
F) Non-occupant Loans on < 5 Family Dwellings (A B C & D)
Number
Average Value
Number
Average Value
Number
Average Value
Number
Average Value
LOANS ORIGINATED
27
$438,444
47
$315,350
4
$90,952
3
$590,757
APPLICATIONS APPROVED, NOT ACCEPTED
4
$381,792
11
$311,727
2
$86,060
1
$342,400
APPLICATIONS DENIED
3
$489,053
14
$352,615
3
$64,513
2
$246,950
APPLICATIONS WITHDRAWN
3
$697,223
11
$273,390
2
$88,440
1
$399,240
FILES CLOSED FOR INCOMPLETENESS
1
$113,690
2
$388,535
0
$0
0
$0
Aggregated Statistics For Year 2000 (Based on 2 partial tracts)
B) Conventional Home Purchase Loans
C) Refinancings
D) Home Improvement Loans
F) Non-occupant Loans on < 5 Family Dwellings (A B C & D)
Number
Average Value
Number
Average Value
Number
Average Value
Number
Average Value
LOANS ORIGINATED
29
$353,959
13
$284,067
4
$53,145
2
$306,705
APPLICATIONS APPROVED, NOT ACCEPTED
3
$492,137
3
$142,247
2
$34,505
0
$0
APPLICATIONS DENIED
5
$406,118
7
$267,270
3
$44,507
0
$0
APPLICATIONS WITHDRAWN
5
$554,500
5
$91,588
1
$17,190
1
$230,820
FILES CLOSED FOR INCOMPLETENESS
1
$361,700
2
$247,480
0
$0
0
$0
Aggregated Statistics For Year 1999 (Based on 1 partial tract)
B) Conventional Home Purchase Loans
C) Refinancings
D) Home Improvement Loans
F) Non-occupant Loans on < 5 Family Dwellings (A B C & D)


 Nearest zip codes: 10518, 10560, 10590, 10526, 10576, 10519.


