Estimated zip code population in 2022: 2,023 Zip code population in 2010: 2,258 Zip code population in 2000: 1,795
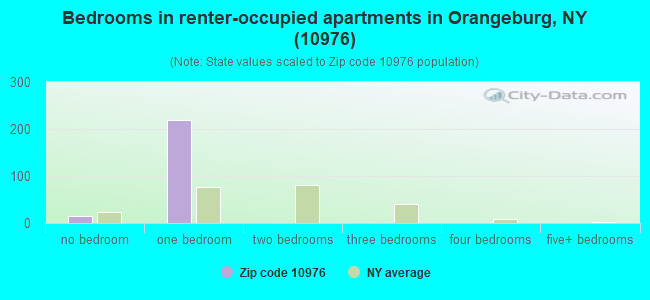
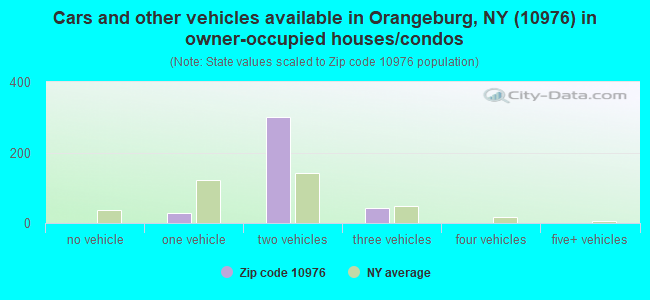
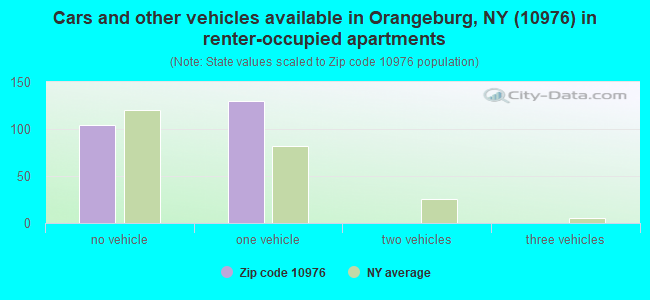
Houses and condos: 682 Renter-occupied apartments: 232
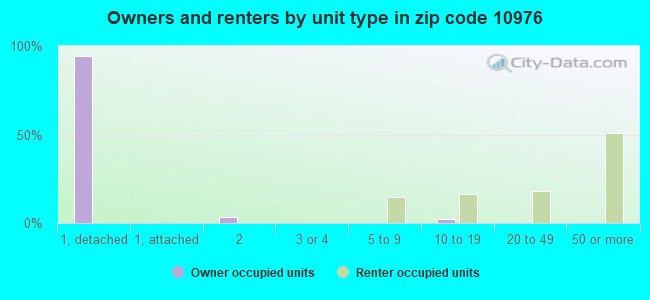
% of renters here:
38%
State:
46%
March 2022 cost of living index in zip code 10976: 130.8 (high, U.S. average is 100)
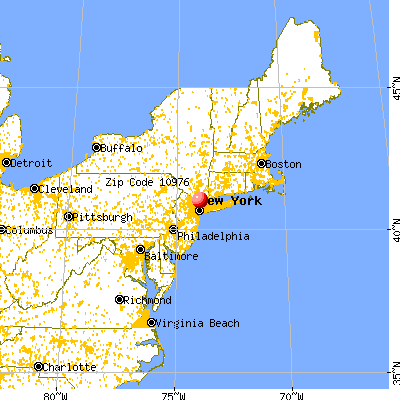
Land area: 1.1 sq. mi. Water area: 0.0 sq. mi.
Population density: 1,762 people per square mile
(low).
OSM Map
General Map
Google Map
MSN Map
OSM Map
General Map
Google Map
MSN Map
OSM Map
General Map
Google Map
MSN Map
OSM Map
General Map
Google Map
MSN Map
Please wait while loading the map...
Real estate property taxes paid for housing units in 2022:
This zip code:
1.7% ($9,805)
New York:
1.5% ($6,180)
Median real estate property taxes paid for housing units with mortgages in 2022: $9,858 (1.7%) Median real estate property taxes paid for housing units with no mortgage in 2022: $9,755 (1.7%)
Business Search- 14 Million verified businesses
Males: 892
(44.1%)
Females: 1,130
(55.9%)
For population 25 years and over in 10976:
High school or higher: 94.0%
Bachelor's degree or higher: 51.3%
Graduate or professional degree: 28.4%
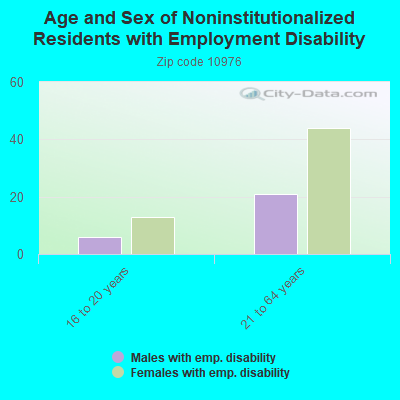
Unemployed: 5.5%
Mean travel time to work (commute): 21.9 minutes
For population 15 years and over in 10976:
Never married: 52.0%
Now married: 38.2%
Separated: 0.9%
Widowed: 5.6%
Divorced: 3.3%
Zip code 10976 compared to state average:
Black race population percentage below state average.
Hispanic race population percentage significantly below state average.
Length of stay since moving in significantly above state average.
Estimated median house/condo value in 2022: $573,757
10976:
$573,757
New York:
$400,400
Median resident age:
This zip code:
41.3 years
New York median age:
40.0 years
Average household size:
This zip code:
2.2 people
New York:
2.5 people
Averages for the 2020 tax year for zip code 10976, filed in 2021:
Average Adjusted Gross Income (AGI) in 2020: $88,206 (Individual Income Tax Returns)
Here:
$88,206
State:
$90,930
Salary/wage: $84,756 (reported on 73.8% of returns)
Here:
$84,756
State:
$72,104
(% of AGI for various income ranges: 971.2% for AGIs below $25k, 3680.0% for AGIs $25k-50k, 6821.4% for AGIs $50k-75k, 7632.0% for AGIs $75k-100k, 18538.6% for AGIs $100k-200k, 87050.0% for AGIs over 200k)
Taxable interest for individuals: $1,108 (reported on 44.0% of returns)
This zip code:
$1,108
New York:
$3,075
(% of AGI for various income ranges: 26.2% for AGIs below $25k, 38.9% for AGIs $25k-50k, 91.4% for AGIs $50k-75k, 68.0% for AGIs $75k-100k, 110.0% for AGIs $100k-200k, 526.7% for AGIs over 200k)
Ordinary dividends: $4,781 (reported on 31.0% of returns)
Here:
$4,781
State:
$11,095
(% of AGI for various income ranges: 63.7% for AGIs below $25k, 88.9% for AGIs $25k-50k, 191.4% for AGIs $50k-75k, 414.0% for AGIs $75k-100k, 371.4% for AGIs $100k-200k, 1533.3% for AGIs over 200k)
Net capital gain/loss in AGI: +$8,688 (reported on 28.6% of returns)
Here:
+$8,688
State:
+$44,925
(% of AGI for various income ranges: 35.0% for AGIs below $25k, 66.7% for AGIs $25k-50k, 187.1% for AGIs $50k-75k, 92.0% for AGIs $75k-100k, 728.6% for AGIs $100k-200k, 4273.3% for AGIs over 200k)
Profit/loss from business: +$4,733 (reported on 14.3% of returns)
Here:
+$4,733
State:
+$14,940
(% of AGI for various income ranges: 81.2% for AGIs below $25k, 84.4% for AGIs $25k-50k, 517.1% for AGIs $100k-200k)
Taxable individual retirement arrangement distribution: $16,080 (reported on 11.9% of returns)
10976:
$16,080
New York:
$19,609
(% of AGI for various income ranges: 161.2% for AGIs below $25k, 792.9% for AGIs $50k-75k, 1135.7% for AGIs $100k-200k)
Total itemized deductions: $29,525 (reported on 19.0% of returns)
Here:
$29,525
State:
$39,326
(% of AGI for various income ranges: 368.8% for AGIs below $25k, 1652.9% for AGIs $50k-75k, 1928.6% for AGIs $100k-200k, 5423.3% for AGIs over 200k)
Charity contributions: $9,179 (reported on 16.7% of returns)
Here:
$9,179
State:
$15,420
(% of AGI for various income ranges: 153.1% for AGIs below $25k, 460.0% for AGIs $50k-75k, 384.3% for AGIs $100k-200k, 1496.7% for AGIs over 200k)
Taxes paid: $8,094 (reported on 19.0% of returns)
10976:
$8,094
State:
$9,183
(% of AGI for various income ranges: 95.0% for AGIs below $25k, 358.6% for AGIs $50k-75k, 594.3% for AGIs $100k-200k, 1586.7% for AGIs over 200k)
Earned income credit: $1,533 (reported on 10.7% of returns)
Here:
$1,533
State:
$2,138
(% of AGI for various income ranges: 53.1% for AGIs below $25k, 58.9% for AGIs $25k-50k)
Percentage of individuals using paid preparers for their 2020 taxes: 91.7%
Here:
92%
State:
95%
(% for various income ranges: 89.7% for AGIs below $25k, 92.9% for AGIs $25k-50k, 90.9% for AGIs $50k-75k, 100.0% for AGIs $75k-100k, 92.9% for AGIs $100k-200k, 88.9% for AGIs over 200k)
Averages for the 2012 tax year for zip code 10976, filed in 2013:
Average Adjusted Gross Income (AGI) in 2012: $66,401 (Individual Income Tax Returns)
Here:
$66,401
State:
$77,088
Salary/wage: $66,729 (reported on 72.8% of returns)
Here:
$66,729
State:
$60,593
(% of AGI for various income ranges: 47.1% for AGIs below $25k, 64.4% for AGIs $25k-50k, 72.5% for AGIs $50k-75k, 61.7% for AGIs $75k-100k, 80.8% for AGIs $100k-200k, 78.2% for AGIs over 200k)
Taxable interest for individuals: $1,062 (reported on 49.4% of returns)
This zip code:
$1,062
New York:
$3,125
(% of AGI for various income ranges: 4.8% for AGIs below $25k, 0.7% for AGIs $25k-50k, 0.4% for AGIs $50k-75k, 0.4% for AGIs $75k-100k, 0.8% for AGIs $100k-200k, 0.3% for AGIs over 200k)
Ordinary dividends: $3,112 (reported on 30.9% of returns)
Here:
$3,112
State:
$10,299
(% of AGI for various income ranges: 3.5% for AGIs below $25k, 2.5% for AGIs $25k-50k, 1.5% for AGIs $50k-75k, 1.3% for AGIs $75k-100k, 0.9% for AGIs $100k-200k, 1.3% for AGIs over 200k)
Net capital gain/loss in AGI: +$131 (reported on 19.8% of returns)
Here:
+$131
State:
+$42,474
(% of AGI for various income ranges: 0.6% for AGIs over 200k)
Profit/loss from business: +$11,108 (reported on 14.8% of returns)
Here:
+$11,108
State:
+$16,168
(% of AGI for various income ranges: 9.6% for AGIs below $25k, 4.9% for AGIs $25k-50k, 2.1% for AGIs $50k-75k, 3.8% for AGIs $100k-200k)
Taxable individual retirement arrangement distribution: $14,273 (reported on 13.6% of returns)
10976:
$14,273
New York:
$17,621
(% of AGI for various income ranges: 6.5% for AGIs below $25k, 9.0% for AGIs $25k-50k, 13.8% for AGIs $75k-100k)
Total itemized deductions: $29,324 (25% of AGI, reported on 45.7% of returns)
Here:
$29,324
State:
$34,985
Here:
25.2% of AGI
State:
21.3% of AGI
(% of AGI for various income ranges: 12.7% for AGIs below $25k, 20.8% for AGIs $25k-50k, 19.6% for AGIs $50k-75k, 22.1% for AGIs $75k-100k, 22.9% for AGIs $100k-200k, 18.2% for AGIs over 200k)
Charity contributions: $4,934 (reported on 39.5% of returns)
Here:
$4,934
State:
$5,572
(% of AGI for various income ranges: 2.4% for AGIs below $25k, 4.6% for AGIs $25k-50k, 3.0% for AGIs $50k-75k, 3.4% for AGIs $75k-100k, 3.5% for AGIs $100k-200k, 1.8% for AGIs over 200k)
Taxes paid: $15,046 (reported on 43.2% of returns)
10976:
$15,046
State:
$18,656
(% of AGI for various income ranges: 4.1% for AGIs below $25k, 5.7% for AGIs $25k-50k, 8.1% for AGIs $50k-75k, 10.0% for AGIs $75k-100k, 10.8% for AGIs $100k-200k, 11.6% for AGIs over 200k)
Earned income credit: $1,638 (reported on 9.9% of returns)
Here:
$1,638
State:
$2,230
(% of AGI for various income ranges: 3.9% for AGIs below $25k)
Percentage of individuals using paid preparers for their 2012 taxes: 70.4%
Here:
70%
State:
66%
(% for various income ranges: 61.8% for AGIs below $25k, 71.4% for AGIs $25k-50k, 66.7% for AGIs $50k-75k, 85.7% for AGIs $75k-100k, 75.0% for AGIs $100k-200k, 100.0% for AGIs over 200k)
Averages for the 2004 tax year for zip code 10976, filed in 2005:
Average Adjusted Gross Income (AGI) in 2004: $51,891 (Individual Income Tax Returns)
Here:
$51,891
State:
$59,519
Salary/wage: $49,534 (reported on 72.7% of returns)
Here:
$49,534
State:
$50,673
(% of AGI for various income ranges: 68.3% for AGIs below $10k, 52.5% for AGIs $10k-25k, 68.7% for AGIs $25k-50k, 77.9% for AGIs $50k-75k, 75.3% for AGIs $75k-100k, 68.0% for AGIs over 100k)
Taxable interest for individuals: $1,563 (reported on 62.5% of returns)
This zip code:
$1,563
New York:
$2,377
(% of AGI for various income ranges: 11.8% for AGIs below $10k, 6.4% for AGIs $10k-25k, 2.1% for AGIs $25k-50k, 1.0% for AGIs $50k-75k, 0.7% for AGIs $75k-100k, 1.4% for AGIs over 100k)
Taxable dividends: $2,298 (reported on 35.4% of returns)
Here:
$2,298
State:
$5,394
(% of AGI for various income ranges: 7.7% for AGIs below $10k, 4.7% for AGIs $10k-25k, 2.1% for AGIs $25k-50k, 1.4% for AGIs $50k-75k, 0.4% for AGIs $75k-100k, 1.1% for AGIs over 100k)
Net capital gain/loss: +$3,937 (reported on 23.7% of returns)
Here:
+$3,937
State:
+$23,581
(% of AGI for various income ranges: -5.1% for AGIs below $10k, -0.6% for AGIs $10k-25k, -0.2% for AGIs $25k-50k, 0.9% for AGIs $50k-75k, 0.3% for AGIs $75k-100k, 3.8% for AGIs over 100k)
Profit/loss from business: +$13,953 (reported on 13.2% of returns)
Here:
+$13,953
State:
+$13,809
(% of AGI for various income ranges: 9.5% for AGIs below $10k, 6.5% for AGIs $10k-25k, 3.3% for AGIs $25k-50k, 8.0% for AGIs $75k-100k, 2.5% for AGIs over 100k)
IRA payment deduction: $2,308 (reported on 3.2% of returns)
10976:
$2,308
New York:
$3,115
Total itemized deductions: $24,959 (28% of AGI, reported on 45.7% of returns)
Here:
$24,959
State:
$25,864
Here:
28.0% of AGI
State:
21.9% of AGI
(% of AGI for various income ranges: 22.6% for AGIs $10k-25k, 22.3% for AGIs $25k-50k, 21.0% for AGIs $50k-75k, 26.7% for AGIs $75k-100k, 21.4% for AGIs over 100k)
Charity contributions deductions: $5,194 (6% of AGI, reported on 43.4% of returns)
Here:
$5,194
State:
$4,439
Here:
5.6% of AGI
State:
3.6% of AGI
(% of AGI for various income ranges: 5.9% for AGIs $10k-25k, 6.8% for AGIs $25k-50k, 4.3% for AGIs $50k-75k, 5.1% for AGIs $75k-100k, 3.3% for AGIs over 100k)
Total tax: $8,245 (reported on 76.4% of returns)
10976:
$8,245
State:
$11,730
(% of AGI for various income ranges: 2.7% for AGIs below $10k, 4.4% for AGIs $10k-25k, 7.3% for AGIs $25k-50k, 9.8% for AGIs $50k-75k, 10.2% for AGIs $75k-100k, 16.4% for AGIs over 100k)
Earned income credit: $1,362 (reported on 8.6% of returns)
Here:
$1,362
State:
$1,757
Percentage of individuals using paid preparers for their 2004 taxes: 67.1%
Here:
67%
State:
67%
(% for various income ranges: 60.7% for AGIs below $10k, 68.4% for AGIs $10k-25k, 60.5% for AGIs $25k-50k, 67.4% for AGIs $50k-75k, 73.6% for AGIs $75k-100k, 80.7% for AGIs over 100k)
Household received Food Stamps/SNAP in the past 12 months: 35 Household did not receive Food Stamps/SNAP in the past 12 months: 563
Women who did not have a birth in the past 12 months: 496 (85 now married, 415 unmarried)
Housing units in zip code 10976 with a mortgage: 225 Median monthly owner costs for units with a mortgage: $3,576 Median monthly owner costs for units without a mortgage: $1,487
Residents with income below the poverty level in 2022:
This zip code:
13.0%
Whole state:
14.3%
Residents with income below 50% of the poverty level in 2022:
This zip code:
7.7%
Whole state:
6.8%
Median number of rooms in houses and condos:
Here:
7.4
State:
6.3
Median number of rooms in apartments:
Here:
2.8
State:
3.8
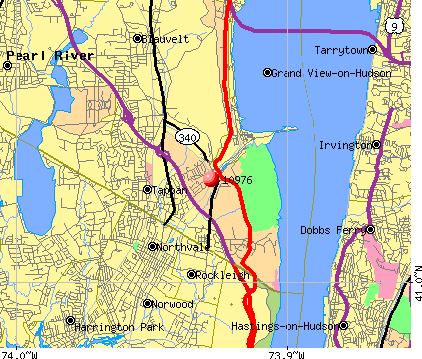
Notable locations in this zip code not listed on our city pages
Notable locations in zip code 10976: Rockland Country Club (A), Birch Brook Camp (B), Sparkill Palisades Fire Department (C). Display/hide their locations on the map
Churches in zip code 10976 include: Saint Charles African Methodist Episcopal Zion Church (A), Saint Agnes Convent (B), Christ Church (C). Display/hide their locations on the map
In group quarters: 697 (-1 institutionalized population)
Size of family households: 130 2-persons, 80 3-persons, 76 4-persons, 44 5-persons, 8 6-persons
Size of nonfamily households: 264 1-person
247 married couples with children.
0 single-parent households ().
75.9% of residents of 10976 zip code speak English at home.
5.8% of residents speak Spanish at home (87% very well, 9% well, 3% not well).
12.8% of residents speak other Indo-European language at home (80% very well, 11% well, 5% not well, 4% not at all).
4.6% of residents speak Asian or Pacific Island language at home (54% very well, 12% well, 34% not well).
0.9% of residents speak other language at home (100% very well).
Foreign born population: 335 (16.6%) (66.8% of them are naturalized citizens)
This zip code:
16.6%
Whole state:
22.7%
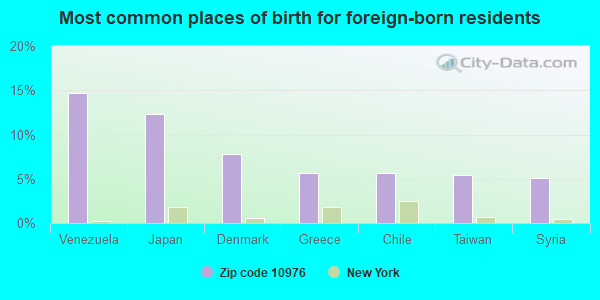
15%Venezuela
12%Japan
8%Denmark
6%Greece
6%Chile
5%Taiwan
5%Syria
26%Irish
17%Italian
8%American
2%Basque
2%Armenian
2%European
1%Romanian
Year of entry for the foreign-born population
872010 or later
562000 to 2009
271990 to 1999
195Before 1990
Facilities with environmental interests located in this zip code:
ALMSTADT JOHN RESIDENCE (641 MAIN ST in SPARKILL, NY)
(Resource Conservation and Recovery Act (tracking hazardous waste))
COUNTY AUTO BODY (RTE 340 & VALENTINE RD in SPARKILL, NY)
(Resource Conservation and Recovery Act (tracking hazardous waste))
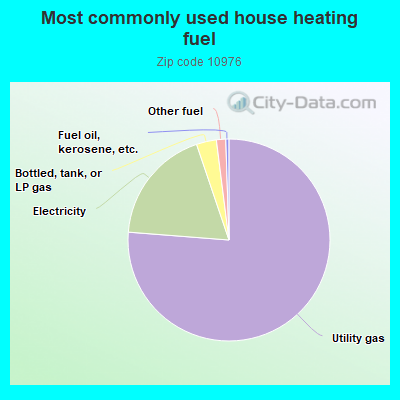
76.4%Utility gas
18.6%Electricity
3.2%Bottled, tank, or LP gas
1.5%Other fuel
0.5%Fuel oil, kerosene, etc.
Population in 1990: 894. Population change in the 1990s: +901 (+100.8%).
Place of birth for U.S.-born residents:
This state: 1,257
Northeast: 259
Midwest: 72
South: 49
West: 16
53% of the 10976 zip code residents lived in the same house 5 years ago. Out of people who lived in different houses, 40% lived in this county. Out of people who lived in different counties, 50% lived in New York.
94% of the 10976 zip code residents lived in the same house 1 year ago. Out of people who lived in different houses, 59% moved from this county. Out of people who lived in different houses, 14% moved from different county within same state. Out of people who lived in different houses, 26% moved from different state.
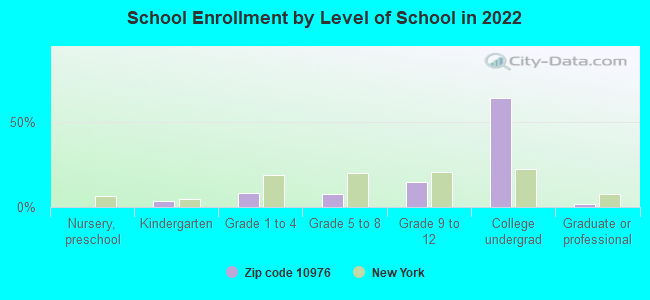
Private vs. public school enrollment:
Students in private schools in grades 1 to 8 (elementary and middle school): 18
Here:
14.6%
New York:
15.6%
Students in private schools in grades 9 to 12 (high school):
Here:
0.0%
New York:
15.0%
Students in private undergraduate colleges: 389
Here:
77.9%
New York:
39.2%
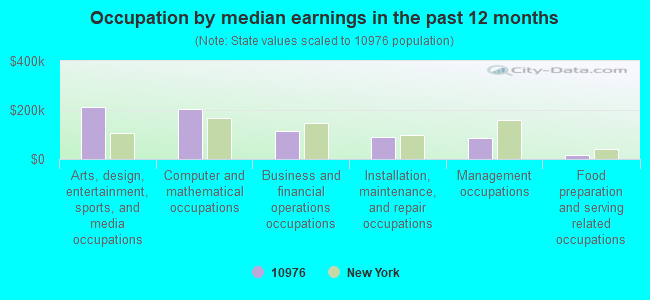
Occupation by median earnings in the past 12 months ($)
212,120Arts, design, entertainment, sports, and media occupations
202,173Computer and mathematical occupations
114,198Business and financial operations occupations
88,369Installation, maintenance, and repair occupations
86,722Management occupations
14,648Food preparation and serving related occupations
Top industries in this zip code by the number of employees in 2005:
Educational Services: Colleges, Universities, and Professional Schools (250-499 employees: 1 establishment)
Other Services (except Public Administration): Religious Organizations (50-99: 1, 20-49: 1, 5-9: 1)
Health Care and Social Assistance: Residential Mental Retardation Facilities (50-99: 1, 10-19: 2, 1-4: 1)
Accommodation and Food Services: Food Service Contractors (20-49: 1, 10-19: 1)
Accommodation and Food Services: Full-Service Restaurants (20-49: 1, 1-4: 2)
Arts, Entertainment, and Recreation: Golf Courses and Country Clubs (20-49: 1, 1-4: 1)
Real Estate and Rental and Leasing: Lessors of Residential Buildings and Dwellings (20-49: 1)
Construction: Other Foundation, Structure, and Building Exterior Contractors (10-19: 1)
Finance and Insurance: Insurance Agencies and Brokerages (10-19: 1)
Other Services (except Public Administration): Industrial Launderers (10-19: 1)
People in group quarters in 2010:
429 people in college/university student housing
235 people in other noninstitutional facilities
118 people in group homes intended for adults
People in group quarters in 2000:
394 people in college dormitories (includes college quarters off campus)
127 people in religious group quarters
24 people in homes for the mentally retarded
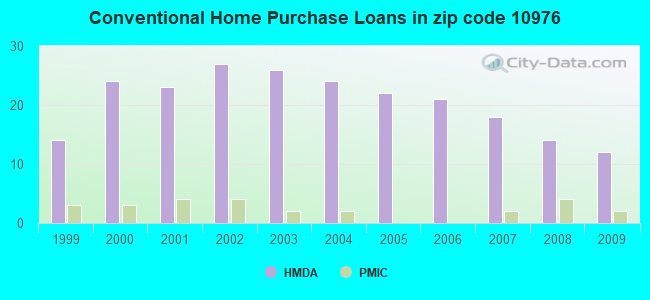
Home Mortgage Disclosure Act Aggregated Statistics For Year 2009 (Based on 2 partial tracts)
A) FHA, FSA/RHS & VA Home Purchase Loans
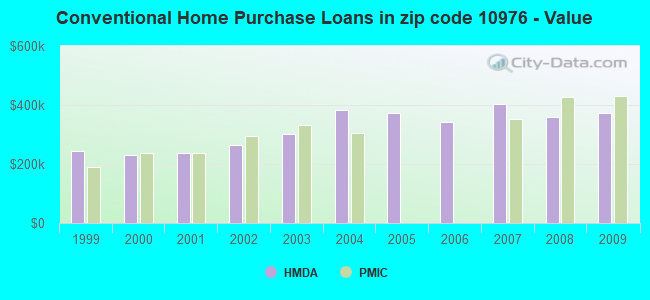
B) Conventional Home Purchase Loans
C) Refinancings
D) Home Improvement Loans
F) Non-occupant Loans on < 5 Family Dwellings (A B C & D)
Number
Average Value
Number
Average Value
Number
Average Value
Number
Average Value
Number
Average Value
LOANS ORIGINATED
2
$407,280
12
$372,880
24
$319,650
1
$250,320
0
$0
APPLICATIONS APPROVED, NOT ACCEPTED
0
$0
1
$274,560
5
$316,608
0
$0
0
$0
APPLICATIONS DENIED
0
$0
3
$399,600
17
$379,694
1
$32,400
1
$335,520
APPLICATIONS WITHDRAWN
1
$424,800
2
$534,600
10
$374,016
0
$0
0
$0
FILES CLOSED FOR INCOMPLETENESS
0
$0
1
$782,400
4
$351,600
0
$0
0
$0
Aggregated Statistics For Year 2008 (Based on 2 partial tracts)
B) Conventional Home Purchase Loans
C) Refinancings
D) Home Improvement Loans
F) Non-occupant Loans on < 5 Family Dwellings (A B C & D)
Number
Average Value
Number
Average Value
Number
Average Value
Number
Average Value
LOANS ORIGINATED
14
$360,343
10
$293,040
4
$124,080
0
$0
APPLICATIONS APPROVED, NOT ACCEPTED
3
$409,520
3
$320,720
0
$0
0
$0
APPLICATIONS DENIED
4
$503,100
7
$353,931
2
$154,200
1
$374,160
APPLICATIONS WITHDRAWN
1
$432,960
3
$297,120
1
$146,400
0
$0
FILES CLOSED FOR INCOMPLETENESS
1
$730,560
3
$191,200
0
$0
0
$0
Aggregated Statistics For Year 2007 (Based on 2 partial tracts)
B) Conventional Home Purchase Loans
C) Refinancings
D) Home Improvement Loans
F) Non-occupant Loans on < 5 Family Dwellings (A B C & D)
Number
Average Value
Number
Average Value
Number
Average Value
Number
Average Value
LOANS ORIGINATED
18
$401,960
20
$329,520
3
$189,680
2
$642,960
APPLICATIONS APPROVED, NOT ACCEPTED
3
$271,120
6
$383,520
1
$289,440
0
$0
APPLICATIONS DENIED
3
$424,320
10
$335,280
1
$80,400
2
$304,680
APPLICATIONS WITHDRAWN
2
$256,800
4
$355,800
0
$0
1
$377,040
FILES CLOSED FOR INCOMPLETENESS
2
$252,240
2
$357,480
1
$44,400
0
$0
Aggregated Statistics For Year 2006 (Based on 2 partial tracts)
B) Conventional Home Purchase Loans
C) Refinancings
D) Home Improvement Loans
F) Non-occupant Loans on < 5 Family Dwellings (A B C & D)
Number
Average Value
Number
Average Value
Number
Average Value
Number
Average Value
LOANS ORIGINATED
21
$341,246
28
$319,474
8
$213,480
1
$193,680
APPLICATIONS APPROVED, NOT ACCEPTED
3
$293,200
7
$394,834
2
$158,760
0
$0
APPLICATIONS DENIED
4
$411,660
15
$356,976
4
$143,160
1
$163,200
APPLICATIONS WITHDRAWN
2
$323,640
14
$355,800
1
$136,800
0
$0
FILES CLOSED FOR INCOMPLETENESS
2
$256,200
5
$330,480
0
$0
0
$0
Aggregated Statistics For Year 2005 (Based on 2 partial tracts)
B) Conventional Home Purchase Loans
C) Refinancings
D) Home Improvement Loans
F) Non-occupant Loans on < 5 Family Dwellings (A B C & D)
Number
Average Value
Number
Average Value
Number
Average Value
Number
Average Value
LOANS ORIGINATED
22
$371,269
32
$316,515
6
$158,040
2
$673,560
APPLICATIONS APPROVED, NOT ACCEPTED
4
$365,940
7
$294,686
0
$0
0
$0
APPLICATIONS DENIED
3
$403,120
12
$334,980
4
$330,000
0
$0
APPLICATIONS WITHDRAWN
3
$304,240
16
$327,345
1
$173,280
0
$0
FILES CLOSED FOR INCOMPLETENESS
1
$472,800
5
$331,344
0
$0
0
$0
Aggregated Statistics For Year 2004 (Based on 2 partial tracts)
B) Conventional Home Purchase Loans
C) Refinancings
D) Home Improvement Loans
F) Non-occupant Loans on < 5 Family Dwellings (A B C & D)
Number
Average Value
Number
Average Value
Number
Average Value
Number
Average Value
LOANS ORIGINATED
24
$381,960
34
$274,165
8
$166,470
3
$255,520
APPLICATIONS APPROVED, NOT ACCEPTED
3
$369,520
7
$296,571
1
$167,760
1
$271,200
APPLICATIONS DENIED
2
$377,400
15
$361,376
3
$100,960
0
$0
APPLICATIONS WITHDRAWN
3
$422,480
14
$271,526
1
$115,440
0
$0
FILES CLOSED FOR INCOMPLETENESS
1
$450,240
3
$355,440
1
$19,680
0
$0
Aggregated Statistics For Year 2003 (Based on 2 partial tracts)
B) Conventional Home Purchase Loans
C) Refinancings
D) Home Improvement Loans
F) Non-occupant Loans on < 5 Family Dwellings (A B C & D)
Number
Average Value
Number
Average Value
Number
Average Value
Number
Average Value
LOANS ORIGINATED
26
$302,289
114
$224,512
5
$90,576
3
$218,320
APPLICATIONS APPROVED, NOT ACCEPTED
2
$414,240
16
$194,160
1
$31,200
0
$0
APPLICATIONS DENIED
2
$336,240
20
$271,632
2
$105,000
0
$0
APPLICATIONS WITHDRAWN
1
$312,480
18
$230,280
0
$0
0
$0
FILES CLOSED FOR INCOMPLETENESS
1
$318,000
5
$255,552
0
$0
0
$0
Aggregated Statistics For Year 2002 (Based on 2 partial tracts)
B) Conventional Home Purchase Loans
C) Refinancings
D) Home Improvement Loans
F) Non-occupant Loans on < 5 Family Dwellings (A B C & D)
Number
Average Value
Number
Average Value
Number
Average Value
Number
Average Value
LOANS ORIGINATED
27
$263,778
67
$220,574
6
$64,800
2
$179,640
APPLICATIONS APPROVED, NOT ACCEPTED
3
$252,720
12
$243,540
2
$70,800
0
$0
APPLICATIONS DENIED
2
$177,840
12
$279,280
2
$71,160
0
$0
APPLICATIONS WITHDRAWN
3
$361,760
17
$240,734
1
$62,400
0
$0
FILES CLOSED FOR INCOMPLETENESS
1
$333,120
5
$198,912
0
$0
0
$0
Aggregated Statistics For Year 2001 (Based on 2 partial tracts)
B) Conventional Home Purchase Loans
C) Refinancings
D) Home Improvement Loans
Number
Average Value
Number
Average Value
Number
Average Value
LOANS ORIGINATED
23
$238,403
39
$212,757
7
$74,331
APPLICATIONS APPROVED, NOT ACCEPTED
3
$280,640
5
$129,072
2
$38,160
APPLICATIONS DENIED
3
$217,280
9
$196,027
4
$74,520
APPLICATIONS WITHDRAWN
2
$209,520
14
$145,577
2
$19,800
FILES CLOSED FOR INCOMPLETENESS
0
$0
3
$142,720
1
$51,600
Aggregated Statistics For Year 2000 (Based on 2 partial tracts)
B) Conventional Home Purchase Loans
C) Refinancings
D) Home Improvement Loans
F) Non-occupant Loans on < 5 Family Dwellings (A B C & D)
Number
Average Value
Number
Average Value
Number
Average Value
Number
Average Value
LOANS ORIGINATED
24
$231,100
11
$164,553
7
$46,834
1
$140,640
APPLICATIONS APPROVED, NOT ACCEPTED
2
$279,600
3
$105,840
2
$42,480
0
$0
APPLICATIONS DENIED
3
$258,480
9
$164,267
5
$50,016
0
$0
APPLICATIONS WITHDRAWN
1
$183,840
9
$114,187
1
$153,360
0
$0
FILES CLOSED FOR INCOMPLETENESS
0
$0
5
$170,400
0
$0
0
$0
Aggregated Statistics For Year 1999 (Based on 1 partial tract)
Detailed PMIC statistics for the following Tracts:0134.00
2002 - 2018 National Fire Incident Reporting System (NFIRS) incidents
Based on the data from the years 2002 - 2018 the average number of fires per year is 19. The highest number of fire incidents - 34 took place in 2018, and the least - 2 in 2002. The data has a rising trend.
When looking into fire subcategories, the most reports belonged to: Structure Fires (87.5%), and Outside Fires (5.3%).
Fire incident types reported to NFIRS in Zip Code 10976


 Nearest zip codes: 10964, 10968, 10983, 07647, 07648, 10962.


 Based on the data from the years 2002 - 2018 the average number of fires per year is 19. The highest number of fire incidents - 34 took place in 2018, and the least - 2 in 2002. The data has a rising trend.
 When looking into fire subcategories, the most reports belonged to: Structure Fires (87.5%), and Outside Fires (5.3%).