Estimated zip code population in 2022: 494 Zip code population in 2010: 238 Zip code population in 2000: 190
Houses and condos: 187 Renter-occupied apartments: 9
% of renters here:
5%
State:
46%
March 2022 cost of living index in zip code 12823: 92.2 (less than average, U.S. average is 100)
Land area: 4.3 sq. mi. Water area: 0.1 sq. mi.
Population density: 116 people per square mile
(very low).
OSM Map
General Map
Google Map
MSN Map
OSM Map
General Map
Google Map
MSN Map
OSM Map
General Map
Google Map
MSN Map
OSM Map
General Map
Google Map
MSN Map
Please wait while loading the map...
Median real estate property taxes paid for housing units with mortgages in 2022: $1,211 (0.6%) Median real estate property taxes paid for housing units with no mortgage in 2022: $5,852 (1.7%)
Business Search- 14 Million verified businesses
Males: 193
(39.3%)
Females: 300
(60.7%)
For population 25 years and over in 12823:
High school or higher: 101.9%
Bachelor's degree or higher: 88.9%
Graduate or professional degree: 21.2%
Mean travel time to work (commute): 22.7 minutes
For population 15 years and over in 12823:
Never married: 13.9%
Now married: 83.7%
Separated: 0.0%
Widowed: 0.0%
Divorced: 2.4%
Zip code 12823 compared to state average:
Median house value below state average.
Unemployed percentage significantly below state average.
Black race population percentage significantly below state average.
Hispanic race population percentage significantly below state average.
Median age above state average.
Foreign-born population percentage significantly below state average.
Renting percentage significantly below state average.
Number of rooms per house above state average.
Percentage of population with a bachelor's degree or higher significantly above state average.
Estimated median house/condo value in 2022: $203,067
12823:
$203,067
New York:
$400,400
Median resident age:
This zip code:
46.3 years
New York median age:
40.0 years
Average household size:
This zip code:
2.9 people
New York:
2.5 people
Averages for the 2020 tax year for zip code 12823, filed in 2021:
Average Adjusted Gross Income (AGI) in 2020: $67,153 (Individual Income Tax Returns)
Here:
$67,153
State:
$90,930
Salary/wage: $52,978 (reported on 60.0% of returns)
Here:
$52,978
State:
$72,104
(% of AGI for various income ranges: 756.7% for AGIs below $25k, 4310.0% for AGIs $25k-50k, 9197.5% for AGIs $50k-75k)
Taxable interest for individuals: $350 (reported on 40.0% of returns)
This zip code:
$350
New York:
$3,075
(% of AGI for various income ranges: 10.0% for AGIs $50k-75k)
Ordinary dividends: $2,025 (reported on 26.7% of returns)
Here:
$2,025
State:
$11,095
(% of AGI for various income ranges: 202.5% for AGIs $50k-75k)
Net capital gain/loss in AGI: +$12,250 (reported on 26.7% of returns)
Here:
+$12,250
State:
+$44,925
(% of AGI for various income ranges: 1225.0% for AGIs $50k-75k)
Profit/loss from business: +$550 (reported on 13.3% of returns)
Here:
+$550
State:
+$14,940
(% of AGI for various income ranges: 55.0% for AGIs $25k-50k)
Taxable individual retirement arrangement distribution: $12,533 (reported on 20.0% of returns)
12823:
$12,533
New York:
$19,609
(% of AGI for various income ranges: 1880.0% for AGIs $25k-50k)
Percentage of individuals using paid preparers for their 2020 taxes: 93.3%
Here:
93%
State:
95%
(% for various income ranges: 75.0% for AGIs below $25k, 100.0% for AGIs $25k-50k, 100.0% for AGIs $50k-75k, 100.0% for AGIs $100k-200k)
Averages for the 2012 tax year for zip code 12823, filed in 2013:
Average Adjusted Gross Income (AGI) in 2012: $45,581 (Individual Income Tax Returns)
Here:
$45,581
State:
$77,088
Salary/wage: $42,427 (reported on 68.8% of returns)
Here:
$42,427
State:
$60,593
(% of AGI for various income ranges: 55.8% for AGIs below $25k, 77.6% for AGIs $25k-50k, 62.7% for AGIs $50k-75k, 59.9% for AGIs $75k-100k)
Taxable interest for individuals: $757 (reported on 43.8% of returns)
This zip code:
$757
New York:
$3,125
(% of AGI for various income ranges: 2.8% for AGIs below $25k, 0.7% for AGIs $50k-75k, 0.7% for AGIs $75k-100k)
Ordinary dividends: $1,575 (reported on 25.0% of returns)
Here:
$1,575
State:
$10,299
Profit/loss from business: +$4,750 (reported on 12.5% of returns)
Here:
+$4,750
State:
+$16,168
Total itemized deductions: $18,440 (27% of AGI, reported on 31.2% of returns)
Here:
$18,440
State:
$34,985
Here:
26.5% of AGI
State:
21.3% of AGI
Charity contributions: $2,000 (reported on 18.8% of returns)
Here:
$2,000
State:
$5,572
Taxes paid: $9,020 (reported on 31.2% of returns)
12823:
$9,020
State:
$18,656
Earned income credit: $1,450 (reported on 12.5% of returns)
Here:
$1,450
State:
$2,230
(% of AGI for various income ranges: 4.8% for AGIs below $25k)
Percentage of individuals using paid preparers for their 2012 taxes: 50.0%
Here:
50%
State:
66%
(% for various income ranges: 40.0% for AGIs below $25k, 50.0% for AGIs $25k-50k, 100.0% for AGIs $50k-75k)
Averages for the 2004 tax year for zip code 12823, filed in 2005:
Average Adjusted Gross Income (AGI) in 2004: $37,521 (Individual Income Tax Returns)
Here:
$37,521
State:
$59,519
Salary/wage: $34,637 (reported on 72.9% of returns)
Here:
$34,637
State:
$50,673
(% of AGI for various income ranges: 58.6% for AGIs below $10k, 50.8% for AGIs $10k-25k, 71.4% for AGIs $25k-50k, 70.7% for AGIs $50k-75k, 63.1% for AGIs $75k-100k)
Taxable interest for individuals: $1,089 (reported on 56.4% of returns)
This zip code:
$1,089
New York:
$2,377
(% of AGI for various income ranges: 13.7% for AGIs $10k-25k, 0.8% for AGIs $25k-50k, 0.8% for AGIs $50k-75k, 0.1% for AGIs $75k-100k)
Taxable dividends: $1,115 (reported on 37.1% of returns)
Here:
$1,115
State:
$5,394
Net capital gain/loss: +$879 (reported on 23.6% of returns)
Here:
+$879
State:
+$23,581
Profit/loss from business: +$1,091 (reported on 7.9% of returns)
Here:
+$1,091
State:
+$13,809
Total itemized deductions: $13,833 (25% of AGI, reported on 30.0% of returns)
Here:
$13,833
State:
$25,864
Here:
25.4% of AGI
State:
21.9% of AGI
Charity contributions deductions: $1,345 (2% of AGI, reported on 20.7% of returns)
Here:
$1,345
State:
$4,439
Here:
2.3% of AGI
State:
3.6% of AGI
Total tax: $3,885 (reported on 80.7% of returns)
12823:
$3,885
State:
$11,730
(% of AGI for various income ranges: 6.1% for AGIs below $10k, 4.6% for AGIs $10k-25k, 6.0% for AGIs $25k-50k, 9.0% for AGIs $50k-75k, 11.7% for AGIs $75k-100k)
Earned income credit: $750 (reported on 8.6% of returns)
Here:
$750
State:
$1,757
Percentage of individuals using paid preparers for their 2004 taxes: 56.4%
Here:
56%
State:
67%
(% for various income ranges: 53.6% for AGIs below $10k, 60.0% for AGIs $10k-25k, 46.5% for AGIs $25k-50k, 93.5% for AGIs $50k-75k)
Household received Food Stamps/SNAP in the past 12 months: 0 Household did not receive Food Stamps/SNAP in the past 12 months: 166
Women who did not have a birth in the past 12 months: 96 (69 now married, 25 unmarried)
Housing units in zip code 12823 with a mortgage: 107 Median monthly owner costs for units with a mortgage: $1,282 Median monthly owner costs for units without a mortgage: $676
Median number of rooms in houses and condos:
Here:
7.4
State:
6.3
Notable locations in this zip code not listed on our city pages
Size of family households: 53 2-persons, 58 3-persons, 6 4-persons
Size of nonfamily households: 49 1-person
126 married couples with children.
5 single-parent households (5 women).
97.2% of residents of 12823 zip code speak English at home.
1.8% of residents speak Asian or Pacific Island language at home (100% very well).
Foreign born population: 9 (1.8%) (100.0% of them are naturalized citizens)
This zip code:
1.8%
Whole state:
22.7%
100%Taiwan
18%European
17%Irish
15%British
13%French
8%Eastern European
6%German
4%French Canadian
Year of entry for the foreign-born population
02010 or later
02000 to 2009
01990 to 1999
8Before 1990
Facilities with environmental interests located in this zip code:
FRONHOFER TOOL (4197 COUNTY RTE 48 in COSSAYUNA, NY)
(Resource Conservation and Recovery Act (tracking hazardous waste))
Housing units lacking complete plumbing facilities: 9.8% Housing units lacking complete kitchen facilities: 9.9%
74.2%Fuel oil, kerosene, etc.
9.1%Wood
7.9%Bottled, tank, or LP gas
5.5%Electricity
4.3%Solar energy
Population in 1990: 241.
Place of birth for U.S.-born residents:
This state: 89
Northeast: 215
Midwest: 29
South: 140
West: 10
79% of the 12823 zip code residents lived in the same house 5 years ago. Out of people who lived in different houses, 100% lived in this county.
82% of the 12823 zip code residents lived in the same house 1 year ago. Out of people who lived in different houses, 102% moved from different county within same state.
Private vs. public school enrollment:
Students in private schools in grades 1 to 8 (elementary and middle school): 133
Here:
100.0%
New York:
15.6%
Students in private schools in grades 9 to 12 (high school):
Here:
0.0%
New York:
15.0%
Students in private undergraduate colleges: 8
Here:
100.0%
New York:
39.2%
Top industries in this zip code by the number of employees in 2005:
Other Services (except Public Administration): Religious Organizations (1-4 employees: 1 establishment)
Other Services (except Public Administration): Civic and Social Organizations (1-4: 1)
Construction: New Single-Family Housing Construction (except Operative Builders) (1-4: 1)
Home Mortgage Disclosure Act Aggregated Statistics For Year 2009 (Based on 2 partial tracts)
A) FHA, FSA/RHS & VA Home Purchase Loans
B) Conventional Home Purchase Loans
C) Refinancings
D) Home Improvement Loans
F) Non-occupant Loans on < 5 Family Dwellings (A B C & D)
Number
Average Value
Number
Average Value
Number
Average Value
Number
Average Value
Number
Average Value
LOANS ORIGINATED
2
$168,050
3
$182,907
19
$143,039
3
$55,507
1
$109,600
APPLICATIONS APPROVED, NOT ACCEPTED
0
$0
0
$0
1
$154,060
0
$0
0
$0
APPLICATIONS DENIED
0
$0
1
$204,150
10
$134,299
2
$67,385
1
$153,590
APPLICATIONS WITHDRAWN
0
$0
0
$0
3
$121,833
0
$0
0
$0
FILES CLOSED FOR INCOMPLETENESS
0
$0
0
$0
1
$212,620
0
$0
0
$0
Aggregated Statistics For Year 2008 (Based on 2 partial tracts)
A) FHA, FSA/RHS & VA Home Purchase Loans
B) Conventional Home Purchase Loans
C) Refinancings
D) Home Improvement Loans
F) Non-occupant Loans on < 5 Family Dwellings (A B C & D)
Number
Average Value
Number
Average Value
Number
Average Value
Number
Average Value
Number
Average Value
LOANS ORIGINATED
4
$160,995
7
$158,089
16
$135,592
4
$29,812
2
$101,605
APPLICATIONS APPROVED, NOT ACCEPTED
1
$127,240
1
$67,270
3
$150,527
0
$0
0
$0
APPLICATIONS DENIED
1
$164,400
1
$106,080
13
$140,125
4
$55,508
1
$89,140
APPLICATIONS WITHDRAWN
1
$133,360
0
$0
4
$111,955
0
$0
0
$0
FILES CLOSED FOR INCOMPLETENESS
0
$0
0
$0
1
$184,400
1
$49,390
0
$0
Aggregated Statistics For Year 2007 (Based on 2 partial tracts)
A) FHA, FSA/RHS & VA Home Purchase Loans
B) Conventional Home Purchase Loans
C) Refinancings
D) Home Improvement Loans
F) Non-occupant Loans on < 5 Family Dwellings (A B C & D)
G) Loans On Manufactured Home Dwelling (A B C & D)
Number
Average Value
Number
Average Value
Number
Average Value
Number
Average Value
Number
Average Value
Number
Average Value
LOANS ORIGINATED
2
$128,655
12
$137,062
18
$138,611
7
$40,690
3
$129,047
2
$54,095
APPLICATIONS APPROVED, NOT ACCEPTED
0
$0
1
$87,490
3
$127,637
1
$50,570
0
$0
0
$0
APPLICATIONS DENIED
0
$0
7
$95,524
18
$129,438
8
$55,478
4
$136,828
2
$58,565
APPLICATIONS WITHDRAWN
0
$0
2
$166,990
10
$123,151
2
$59,625
1
$169,580
1
$59,510
FILES CLOSED FOR INCOMPLETENESS
0
$0
0
$0
1
$205,560
0
$0
0
$0
0
$0
Aggregated Statistics For Year 2006 (Based on 2 partial tracts)
A) FHA, FSA/RHS & VA Home Purchase Loans
B) Conventional Home Purchase Loans
C) Refinancings
D) Home Improvement Loans
F) Non-occupant Loans on < 5 Family Dwellings (A B C & D)
G) Loans On Manufactured Home Dwelling (A B C & D)
Number
Average Value
Number
Average Value
Number
Average Value
Number
Average Value
Number
Average Value
Number
Average Value
LOANS ORIGINATED
1
$100,670
14
$133,325
22
$104,033
11
$40,433
4
$112,072
1
$53,160
APPLICATIONS APPROVED, NOT ACCEPTED
0
$0
2
$135,240
3
$125,360
1
$44,220
0
$0
0
$0
APPLICATIONS DENIED
0
$0
6
$68,992
12
$93,551
6
$33,908
4
$63,092
3
$54,097
APPLICATIONS WITHDRAWN
0
$0
0
$0
10
$137,616
1
$77,380
0
$0
0
$0
FILES CLOSED FOR INCOMPLETENESS
0
$0
0
$0
3
$175,223
0
$0
0
$0
0
$0
Aggregated Statistics For Year 2005 (Based on 2 partial tracts)
A) FHA, FSA/RHS & VA Home Purchase Loans
B) Conventional Home Purchase Loans
C) Refinancings
D) Home Improvement Loans
F) Non-occupant Loans on < 5 Family Dwellings (A B C & D)
G) Loans On Manufactured Home Dwelling (A B C & D)
Number
Average Value
Number
Average Value
Number
Average Value
Number
Average Value
Number
Average Value
Number
Average Value
LOANS ORIGINATED
1
$143,000
12
$121,442
27
$99,707
7
$36,490
1
$116,190
2
$49,625
APPLICATIONS APPROVED, NOT ACCEPTED
0
$0
3
$102,547
3
$70,953
1
$36,930
0
$0
1
$15,760
APPLICATIONS DENIED
0
$0
4
$118,540
18
$102,560
5
$46,240
1
$91,020
3
$52,137
APPLICATIONS WITHDRAWN
0
$0
2
$131,475
16
$123,524
2
$87,610
1
$102,550
0
$0
FILES CLOSED FOR INCOMPLETENESS
0
$0
0
$0
4
$105,545
0
$0
0
$0
0
$0
Aggregated Statistics For Year 2004 (Based on 2 partial tracts)
A) FHA, FSA/RHS & VA Home Purchase Loans
B) Conventional Home Purchase Loans
C) Refinancings
D) Home Improvement Loans
F) Non-occupant Loans on < 5 Family Dwellings (A B C & D)
G) Loans On Manufactured Home Dwelling (A B C & D)
Number
Average Value
Number
Average Value
Number
Average Value
Number
Average Value
Number
Average Value
Number
Average Value
LOANS ORIGINATED
1
$117,360
14
$104,714
21
$95,222
10
$38,573
2
$91,375
1
$77,150
APPLICATIONS APPROVED, NOT ACCEPTED
0
$0
1
$85,140
3
$87,650
2
$49,625
0
$0
0
$0
APPLICATIONS DENIED
0
$0
3
$94,550
16
$83,438
4
$17,462
0
$0
2
$63,740
APPLICATIONS WITHDRAWN
0
$0
1
$129,600
10
$91,305
3
$50,960
0
$0
0
$0
FILES CLOSED FOR INCOMPLETENESS
0
$0
0
$0
1
$110,540
0
$0
0
$0
0
$0
Aggregated Statistics For Year 2003 (Based on 2 partial tracts)
A) FHA, FSA/RHS & VA Home Purchase Loans
B) Conventional Home Purchase Loans
C) Refinancings
D) Home Improvement Loans
F) Non-occupant Loans on < 5 Family Dwellings (A B C & D)
Number
Average Value
Number
Average Value
Number
Average Value
Number
Average Value
Number
Average Value
LOANS ORIGINATED
2
$104,900
16
$124,568
35
$90,928
6
$15,915
2
$61,860
APPLICATIONS APPROVED, NOT ACCEPTED
0
$0
1
$108,900
6
$98,432
0
$0
1
$70,560
APPLICATIONS DENIED
0
$0
2
$106,310
17
$80,839
2
$22,110
1
$74,090
APPLICATIONS WITHDRAWN
0
$0
1
$116,660
11
$86,895
0
$0
0
$0
FILES CLOSED FOR INCOMPLETENESS
0
$0
0
$0
1
$111,720
0
$0
0
$0
Aggregated Statistics For Year 2002 (Based on 2 partial tracts)
A) FHA, FSA/RHS & VA Home Purchase Loans
B) Conventional Home Purchase Loans
C) Refinancings
D) Home Improvement Loans
F) Non-occupant Loans on < 5 Family Dwellings (A B C & D)
Number
Average Value
Number
Average Value
Number
Average Value
Number
Average Value
Number
Average Value
LOANS ORIGINATED
3
$61,780
9
$84,541
20
$81,756
6
$18,228
2
$74,090
APPLICATIONS APPROVED, NOT ACCEPTED
0
$0
2
$60,800
4
$61,388
1
$18,350
0
$0
APPLICATIONS DENIED
0
$0
3
$118,227
10
$76,464
2
$14,345
1
$25,400
APPLICATIONS WITHDRAWN
0
$0
1
$59,270
8
$88,141
2
$31,400
0
$0
FILES CLOSED FOR INCOMPLETENESS
0
$0
0
$0
1
$166,990
0
$0
0
$0
Aggregated Statistics For Year 2001 (Based on 2 partial tracts)
A) FHA, FSA/RHS & VA Home Purchase Loans
B) Conventional Home Purchase Loans
C) Refinancings
D) Home Improvement Loans
F) Non-occupant Loans on < 5 Family Dwellings (A B C & D)
Number
Average Value
Number
Average Value
Number
Average Value
Number
Average Value
Number
Average Value
LOANS ORIGINATED
5
$82,462
11
$83,111
17
$84,312
4
$29,105
3
$77,223
APPLICATIONS APPROVED, NOT ACCEPTED
0
$0
2
$32,695
4
$60,858
1
$40,920
0
$0
APPLICATIONS DENIED
0
$0
4
$45,335
11
$81,444
2
$15,055
0
$0
APPLICATIONS WITHDRAWN
0
$0
1
$56,680
7
$50,971
1
$10,820
0
$0
FILES CLOSED FOR INCOMPLETENESS
0
$0
1
$32,220
1
$157,350
0
$0
0
$0
Aggregated Statistics For Year 2000 (Based on 2 partial tracts)
A) FHA, FSA/RHS & VA Home Purchase Loans
B) Conventional Home Purchase Loans
C) Refinancings
D) Home Improvement Loans
F) Non-occupant Loans on < 5 Family Dwellings (A B C & D)
Number
Average Value
Number
Average Value
Number
Average Value
Number
Average Value
Number
Average Value
LOANS ORIGINATED
4
$74,205
12
$82,222
8
$71,325
3
$11,603
1
$62,330
APPLICATIONS APPROVED, NOT ACCEPTED
0
$0
2
$86,670
3
$63,583
1
$30,580
0
$0
APPLICATIONS DENIED
0
$0
3
$63,033
9
$54,122
4
$15,992
0
$0
APPLICATIONS WITHDRAWN
0
$0
2
$53,625
6
$47,628
1
$32,220
0
$0
FILES CLOSED FOR INCOMPLETENESS
0
$0
1
$139,940
1
$90,790
0
$0
0
$0
Aggregated Statistics For Year 1999 (Based on 1 partial tract)

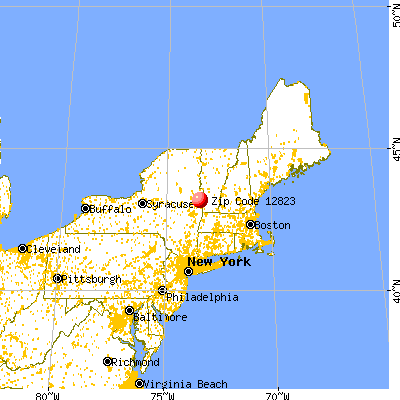


 Nearest zip codes: 12865, 12809, 12873, 12834, 12816, 12838.


