Averages for the 2020 tax year for zip code 13042, filed in 2021:
Average Adjusted Gross Income (AGI) in 2020: $57,612 (Individual Income Tax Returns)
Here:
$57,612
State:
$90,930
Salary/wage: $49,913 (reported on 79.2% of returns)
Here:
$49,913
State:
$72,104
(% of AGI for various income ranges: 1085.7% for AGIs below $25k, 3241.2% for AGIs $25k-50k, 5762.1% for AGIs $50k-75k, 9811.4% for AGIs $75k-100k, 16933.0% for AGIs $100k-200k)
Taxable interest for individuals: $346 (reported on 33.0% of returns)
This zip code:
$346
New York:
$3,075
(% of AGI for various income ranges: 5.2% for AGIs below $25k, 5.0% for AGIs $25k-50k, 19.3% for AGIs $50k-75k, 64.3% for AGIs $75k-100k, 26.0% for AGIs $100k-200k)
Ordinary dividends: $1,681 (reported on 15.1% of returns)
Here:
$1,681
State:
$11,095
(% of AGI for various income ranges: 25.0% for AGIs $25k-50k, 28.6% for AGIs $50k-75k, 102.9% for AGIs $75k-100k, 97.0% for AGIs $100k-200k)
Net capital gain/loss in AGI: +$8,443 (reported on 13.2% of returns)
Here:
+$8,443
State:
+$44,925
(% of AGI for various income ranges: 2.4% for AGIs below $25k, 45.4% for AGIs $25k-50k, 168.6% for AGIs $75k-100k, 950.0% for AGIs $100k-200k)
Profit/loss from business: +$7,480 (reported on 9.4% of returns)
Here:
+$7,480
State:
+$14,940
(% of AGI for various income ranges: 195.7% for AGIs below $25k, 103.6% for AGIs $50k-75k, 192.0% for AGIs $100k-200k)
Taxable individual retirement arrangement distribution: $13,717 (reported on 11.3% of returns)
13042:
$13,717
New York:
$19,609
(% of AGI for various income ranges: 155.2% for AGIs below $25k, 186.4% for AGIs $50k-75k, 677.1% for AGIs $75k-100k, 585.0% for AGIs $100k-200k)
Total itemized deductions: $20,975 (reported on 3.8% of returns)
Here:
$20,975
State:
$39,326
(% of AGI for various income ranges: 1198.6% for AGIs $75k-100k)
Charity contributions: $3,800 (reported on 1.9% of returns)
Here:
$3,800
State:
$15,420
(% of AGI for various income ranges: 108.6% for AGIs $75k-100k)
Taxes paid: $8,275 (reported on 3.8% of returns)
13042:
$8,275
State:
$9,183
(% of AGI for various income ranges: 472.9% for AGIs $75k-100k)
Earned income credit: $2,193 (reported on 14.2% of returns)
Here:
$2,193
State:
$2,138
(% of AGI for various income ranges: 87.1% for AGIs below $25k, 60.8% for AGIs $25k-50k)
Percentage of individuals using paid preparers for their 2020 taxes: 95.3%
Here:
95%
State:
95%
(% for various income ranges: 93.3% for AGIs below $25k, 96.4% for AGIs $25k-50k, 94.7% for AGIs $50k-75k, 100.0% for AGIs $75k-100k, 94.1% for AGIs $100k-200k)
Averages for the 2012 tax year for zip code 13042, filed in 2013:
Average Adjusted Gross Income (AGI) in 2012: $43,578 (Individual Income Tax Returns)
Here:
$43,578
State:
$77,088
Salary/wage: $39,198 (reported on 83.3% of returns)
Here:
$39,198
State:
$60,593
(% of AGI for various income ranges: 71.0% for AGIs below $25k, 79.6% for AGIs $25k-50k, 74.6% for AGIs $50k-75k, 73.5% for AGIs $75k-100k, 74.4% for AGIs $100k-200k)
Taxable interest for individuals: $330 (reported on 32.4% of returns)
This zip code:
$330
New York:
$3,125
(% of AGI for various income ranges: 0.3% for AGIs below $25k, 0.2% for AGIs $25k-50k, 0.4% for AGIs $50k-75k, 0.2% for AGIs $75k-100k)
Ordinary dividends: $976 (reported on 16.7% of returns)
Here:
$976
State:
$10,299
(% of AGI for various income ranges: 0.1% for AGIs below $25k, 0.5% for AGIs $25k-50k, 0.2% for AGIs $50k-75k, 0.8% for AGIs $75k-100k, 0.2% for AGIs $100k-200k)
Profit/loss from business: +$3,455 (reported on 10.8% of returns)
Here:
+$3,455
State:
+$16,168
(% of AGI for various income ranges: 4.9% for AGIs below $25k, 1.3% for AGIs $50k-75k)
Taxable individual retirement arrangement distribution: $15,264 (reported on 10.8% of returns)
13042:
$15,264
New York:
$17,621
(% of AGI for various income ranges: 4.2% for AGIs below $25k, 1.8% for AGIs $25k-50k, 3.1% for AGIs $50k-75k, 11.0% for AGIs $75k-100k)
Total itemized deductions: $18,908 (23% of AGI, reported on 24.5% of returns)
Here:
$18,908
State:
$34,985
Here:
23.1% of AGI
State:
21.3% of AGI
(% of AGI for various income ranges: 8.6% for AGIs below $25k, 5.8% for AGIs $25k-50k, 9.3% for AGIs $50k-75k, 13.9% for AGIs $75k-100k, 14.1% for AGIs $100k-200k)
Charity contributions: $2,147 (reported on 18.6% of returns)
Here:
$2,147
State:
$5,572
(% of AGI for various income ranges: 0.6% for AGIs $25k-50k, 0.7% for AGIs $50k-75k, 1.7% for AGIs $75k-100k, 1.2% for AGIs $100k-200k)
Taxes paid: $8,176 (reported on 24.5% of returns)
13042:
$8,176
State:
$18,656
(% of AGI for various income ranges: 3.1% for AGIs below $25k, 1.8% for AGIs $25k-50k, 3.8% for AGIs $50k-75k, 5.4% for AGIs $75k-100k, 7.6% for AGIs $100k-200k)
Earned income credit: $1,910 (reported on 19.6% of returns)
Here:
$1,910
State:
$2,230
(% of AGI for various income ranges: 5.1% for AGIs below $25k, 1.4% for AGIs $25k-50k)
Percentage of individuals using paid preparers for their 2012 taxes: 51.0%
Here:
51%
State:
66%
(% for various income ranges: 48.8% for AGIs below $25k, 50.0% for AGIs $25k-50k, 52.9% for AGIs $50k-75k, 50.0% for AGIs $75k-100k, 62.5% for AGIs $100k-200k)
Averages for the 2004 tax year for zip code 13042, filed in 2005:
Average Adjusted Gross Income (AGI) in 2004: $35,718 (Individual Income Tax Returns)
Here:
$35,718
State:
$59,519
Salary/wage: $33,128 (reported on 86.8% of returns)
Here:
$33,128
State:
$50,673
(% of AGI for various income ranges: 93.3% for AGIs below $10k, 78.5% for AGIs $10k-25k, 81.5% for AGIs $25k-50k, 80.7% for AGIs $50k-75k, 79.2% for AGIs $75k-100k, 79.7% for AGIs over 100k)
Taxable interest for individuals: $656 (reported on 41.0% of returns)
This zip code:
$656
New York:
$2,377
(% of AGI for various income ranges: 1.3% for AGIs below $10k, 1.4% for AGIs $10k-25k, 0.8% for AGIs $25k-50k, 0.8% for AGIs $50k-75k, 0.4% for AGIs $75k-100k, 0.2% for AGIs over 100k)
Taxable dividends: $1,053 (reported on 18.2% of returns)
Here:
$1,053
State:
$5,394
(% of AGI for various income ranges: 1.2% for AGIs below $10k, 0.9% for AGIs $10k-25k, 0.7% for AGIs $25k-50k, 0.5% for AGIs $50k-75k, 0.3% for AGIs $75k-100k, 0.1% for AGIs over 100k)
Net capital gain/loss: +$1,217 (reported on 13.5% of returns)
Here:
+$1,217
State:
+$23,581
(% of AGI for various income ranges: -2.5% for AGIs below $10k, 0.7% for AGIs $10k-25k, 0.6% for AGIs $25k-50k, 0.8% for AGIs $50k-75k, 0.5% for AGIs $75k-100k, -0.4% for AGIs over 100k)
Profit/loss from business: +$3,612 (reported on 11.3% of returns)
Here:
+$3,612
State:
+$13,809
(% of AGI for various income ranges: 5.6% for AGIs below $10k, 1.2% for AGIs $10k-25k, 2.4% for AGIs $25k-50k, 0.0% for AGIs $50k-75k, 0.8% for AGIs $75k-100k)
IRA payment deduction: $3,333 (reported on 1.5% of returns)
13042:
$3,333
New York:
$3,115
Total itemized deductions: $14,588 (23% of AGI, reported on 27.0% of returns)
Here:
$14,588
State:
$25,864
Here:
23.1% of AGI
State:
21.9% of AGI
(% of AGI for various income ranges: 11.4% for AGIs below $10k, 4.9% for AGIs $10k-25k, 9.3% for AGIs $25k-50k, 10.9% for AGIs $50k-75k, 14.5% for AGIs $75k-100k, 16.7% for AGIs over 100k)
Charity contributions deductions: $1,918 (3% of AGI, reported on 22.6% of returns)
Here:
$1,918
State:
$4,439
Here:
2.9% of AGI
State:
3.6% of AGI
(% of AGI for various income ranges: 0.3% for AGIs $10k-25k, 0.9% for AGIs $25k-50k, 1.5% for AGIs $50k-75k, 1.5% for AGIs $75k-100k, 2.2% for AGIs over 100k)
Total tax: $4,130 (reported on 72.5% of returns)
13042:
$4,130
State:
$11,730
(% of AGI for various income ranges: 2.4% for AGIs below $10k, 3.4% for AGIs $10k-25k, 6.3% for AGIs $25k-50k, 9.1% for AGIs $50k-75k, 10.5% for AGIs $75k-100k, 15.7% for AGIs over 100k)
Earned income credit: $1,572 (reported on 18.2% of returns)
Here:
$1,572
State:
$1,757
Percentage of individuals using paid preparers for their 2004 taxes: 58.8%
Here:
59%
State:
67%
(% for various income ranges: 48.0% for AGIs below $10k, 57.4% for AGIs $10k-25k, 62.5% for AGIs $25k-50k, 63.3% for AGIs $50k-75k, 66.3% for AGIs $75k-100k, 63.0% for AGIs over 100k)
Household received Food Stamps/SNAP in the past 12 months: 76 Household did not receive Food Stamps/SNAP in the past 12 months: 787
Women who had a birth in the past 12 months: 15 (15 now married, 0 unmarried) Women who did not have a birth in the past 12 months: 400 (205 now married, 191 unmarried)
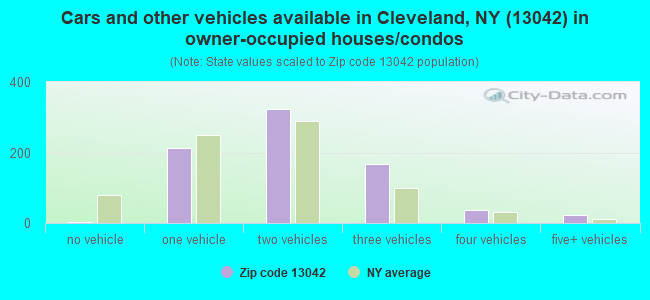
Housing units in zip code 13042 with a mortgage: 392 (8 second mortgage, 8 both second mortgage and home equity loan) Houses without a mortgage: 65
Median monthly owner costs for units with a mortgage: $1,328 Median monthly owner costs for units without a mortgage: $499
Residents with income below the poverty level in 2022:
This zip code:
6.9%
Whole state:
14.3%
Residents with income below 50% of the poverty level in 2022:
This zip code:
3.4%
Whole state:
6.8%
Median number of rooms in houses and condos:
Here:
6.7
State:
6.3
Median number of rooms in apartments:
Here:
5.1
State:
3.8
Notable locations in this zip code not listed on our city pages
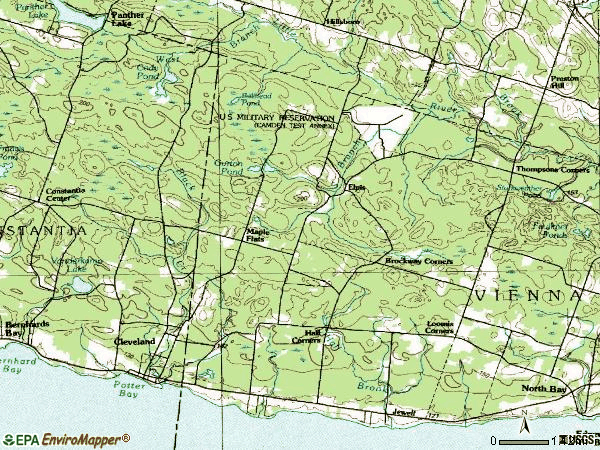
Notable locations in zip code 13042: Hall Corners (A), Loomis Corners (B), Cleveland Village Wastewater Treatment Plant (C), Brockway Corners (D), Cleveland Volunteer Fire Department (E). Display/hide their locations on the map
Churches in zip code 13042 include: Amazing Grace Christian Fellowship (A), Cleveland Bible Chapel (B), Methodist Church of Cleveland (C), Saint Mary's Church (D). Display/hide their locations on the map
Lakes and reservoirs: Vanderkamp Lake (A), Bullhead Pond (B), Cody Pond (C), Gorton Pond (D), Cleveland Reservoir (E). Display/hide their locations on the map
Streams, rivers, and creeks: Gorton Brook (A), Sulphur Spring Brook (B), Brockway Brook (C), Black Creek (D), Cold Spring Brook (E). Display/hide their locations on the map
In group quarters: 1 (-1 institutionalized population)
Size of family households: 268 2-persons, 119 3-persons, 40 4-persons, 77 5-persons, 23 6-persons, 9 7-or-more-persons
Size of nonfamily households: 248 1-person, 88 2-persons
294 married couples with children.
93 single-parent households (52 men, 41 women).
97.4% of residents of 13042 zip code speak English at home.
1.2% of residents speak Spanish at home (83% very well, 17% well).
1.1% of residents speak other Indo-European language at home (77% very well, 23% well).
0.1% of residents speak Asian or Pacific Island language at home (100% very well).
Foreign born population: 11 (0.6%) (82.6% of them are naturalized citizens)
This zip code:
0.6%
Whole state:
22.7%
50%Chile
30%Belgium
10%Japan
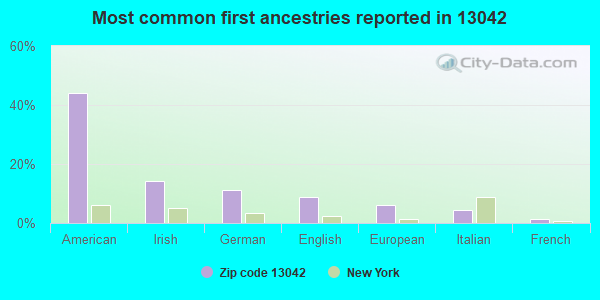
44%American
14%Irish
11%German
9%English
6%European
4%Italian
1%French
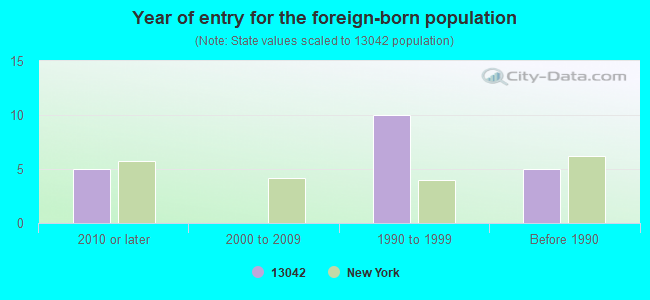
Year of entry for the foreign-born population
52010 or later
02000 to 2009
101990 to 1999
5Before 1990
Facilities with environmental interests located in this zip code:
CLEVELAND ES ( in CLEVELAND, NY)
(National Center for Education Statistics) - STATE ID-460801060004 Organizations: CENTRAL SQUARE CSD (SCHOOL DISTRICT)
CLEVELAND (V) WWTP (PO BOX A in CLEVELAND, NY)
National Pollutant Discharge Elimination System NON-MAJOR (Tracking pollutant discharge elimination systems) - permit Business SIC classification: SEWERAGE SYSTEMS
CLEVELAND SUBSTATION (WEST ST in CLEVELAND, NY)
(Resource Conservation and Recovery Act (tracking hazardous waste))
CLEVELAND ELEMENTARY SCHOOL (COR OF BRIDGE ST & RTE 49 in CLEVELAND, NY)
Conditionally Exempt Small Quantity Generators, less than 100 kg/month of hazardous waste (Resource Conservation and Recovery Act (tracking hazardous waste)) - notification Organizations: CENTRAL SQUARE (CONTACT/OWNER)
Housing units lacking complete plumbing facilities: 0.5%
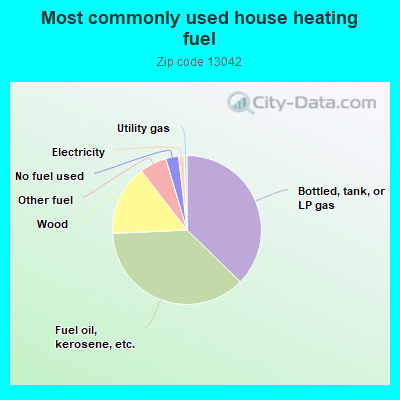
37.4%Bottled, tank, or LP gas
37.1%Fuel oil, kerosene, etc.
15.3%Wood
5.9%Other fuel
2.8%No fuel used
1.2%Electricity
0.6%Utility gas
Population in 1990: 2,428. Population change in the 1990s: +51 (+2.1%).
Place of birth for U.S.-born residents:
This state: 1,653
Northeast: 167
Midwest: 71
South: 22
West: 40
69% of the 13042 zip code residents lived in the same house 5 years ago. Out of people who lived in different houses, 47% lived in this county. Out of people who lived in different counties, 50% lived in New York.
91% of the 13042 zip code residents lived in the same house 1 year ago. Out of people who lived in different houses, 65% moved from this county. Out of people who lived in different houses, 28% moved from different county within same state. Out of people who lived in different houses, 3% moved from different state. Out of people who lived in different houses, 1% moved from abroad.
Private vs. public school enrollment:
Students in private schools in grades 1 to 8 (elementary and middle school): 16
Here:
10.7%
New York:
15.6%
Students in private schools in grades 9 to 12 (high school): 12
Here:
7.4%
New York:
15.0%
Students in private undergraduate colleges: 43
Here:
57.1%
New York:
39.2%
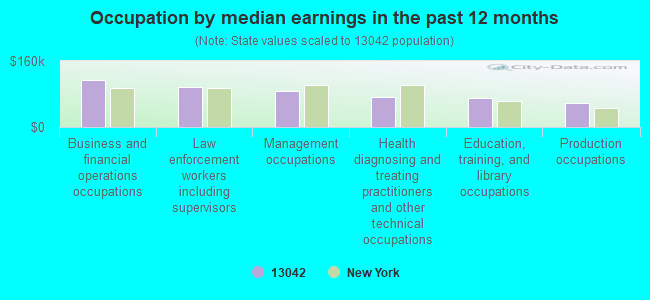
Occupation by median earnings in the past 12 months ($)
115,097Business and financial operations occupations
97,408Law enforcement workers including supervisors
87,148Management occupations
73,688Health diagnosing and treating practitioners and other technical occupations
70,718Education, training, and library occupations
58,425Production occupations
Top industries in this zip code by the number of employees in 2005:
Other Services (except Public Administration): Religious Organizations (10-19 employees: 1 establishment)
Health Care and Social Assistance: Ambulance Services (10-19: 1)
Accommodation and Food Services: Recreational and Vacation Camps (except Campgrounds) (5-9: 1)
Health Care and Social Assistance: Offices of Physicians (except Mental Health Specialists) (5-9: 1)
Construction: New Single-Family Housing Construction (except Operative Builders) (1-4: 2)
Construction: Electrical Contractors (1-4: 1)
Construction: Framing Contractors (1-4: 1)
Home Mortgage Disclosure Act Aggregated Statistics For Year 2009 (Based on 2 partial tracts)
A) FHA, FSA/RHS & VA Home Purchase Loans
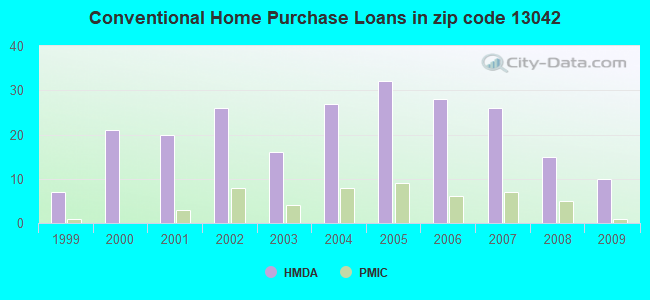
B) Conventional Home Purchase Loans
C) Refinancings
D) Home Improvement Loans
F) Non-occupant Loans on < 5 Family Dwellings (A B C & D)
G) Loans On Manufactured Home Dwelling (A B C & D)
Number
Average Value
Number
Average Value
Number
Average Value
Number
Average Value
Number
Average Value
Number
Average Value
LOANS ORIGINATED
9
$99,004
10
$120,098
35
$105,524
12
$15,391
4
$132,992
2
$65,575
APPLICATIONS APPROVED, NOT ACCEPTED
0
$0
1
$68,280
3
$94,637
1
$49,610
0
$0
1
$96,280
APPLICATIONS DENIED
3
$103,153
2
$89,400
14
$98,696
5
$11,396
4
$104,502
4
$63,980
APPLICATIONS WITHDRAWN
0
$0
1
$171,920
9
$104,298
0
$0
1
$70,240
0
$0
FILES CLOSED FOR INCOMPLETENESS
0
$0
0
$0
1
$160,620
1
$41,260
0
$0
0
$0
Aggregated Statistics For Year 2008 (Based on 2 partial tracts)
A) FHA, FSA/RHS & VA Home Purchase Loans
B) Conventional Home Purchase Loans
C) Refinancings
D) Home Improvement Loans
F) Non-occupant Loans on < 5 Family Dwellings (A B C & D)
G) Loans On Manufactured Home Dwelling (A B C & D)
Number
Average Value
Number
Average Value
Number
Average Value
Number
Average Value
Number
Average Value
Number
Average Value
LOANS ORIGINATED
12
$105,526
15
$93,001
29
$80,337
17
$26,207
7
$106,380
6
$71,223
APPLICATIONS APPROVED, NOT ACCEPTED
0
$0
2
$143,430
3
$110,520
1
$18,670
1
$164,550
1
$70,730
APPLICATIONS DENIED
3
$76,627
7
$118,940
33
$109,895
21
$31,180
5
$110,226
11
$86,541
APPLICATIONS WITHDRAWN
1
$83,500
1
$68,280
10
$123,439
3
$46,337
1
$293,740
1
$82,520
FILES CLOSED FOR INCOMPLETENESS
1
$91,360
0
$0
0
$0
1
$56,000
0
$0
0
$0
Aggregated Statistics For Year 2007 (Based on 2 partial tracts)
A) FHA, FSA/RHS & VA Home Purchase Loans
B) Conventional Home Purchase Loans
C) Refinancings
D) Home Improvement Loans
F) Non-occupant Loans on < 5 Family Dwellings (A B C & D)
G) Loans On Manufactured Home Dwelling (A B C & D)
Number
Average Value
Number
Average Value
Number
Average Value
Number
Average Value
Number
Average Value
Number
Average Value
LOANS ORIGINATED
2
$103,150
26
$96,256
35
$92,205
24
$34,445
10
$89,742
6
$59,108
APPLICATIONS APPROVED, NOT ACCEPTED
0
$0
5
$102,562
7
$116,063
2
$56,490
2
$223,740
2
$57,225
APPLICATIONS DENIED
0
$0
10
$85,174
41
$81,671
22
$36,885
4
$112,975
11
$61,132
APPLICATIONS WITHDRAWN
0
$0
2
$109,290
16
$84,179
0
$0
1
$122,310
0
$0
FILES CLOSED FOR INCOMPLETENESS
1
$75,640
0
$0
4
$88,415
0
$0
1
$100,700
0
$0
Aggregated Statistics For Year 2006 (Based on 2 partial tracts)
A) FHA, FSA/RHS & VA Home Purchase Loans
B) Conventional Home Purchase Loans
C) Refinancings
D) Home Improvement Loans
F) Non-occupant Loans on < 5 Family Dwellings (A B C & D)
G) Loans On Manufactured Home Dwelling (A B C & D)
Number
Average Value
Number
Average Value
Number
Average Value
Number
Average Value
Number
Average Value
Number
Average Value
LOANS ORIGINATED
6
$91,690
28
$97,258
37
$81,831
25
$23,145
9
$99,713
5
$71,126
APPLICATIONS APPROVED, NOT ACCEPTED
0
$0
5
$44,994
5
$104,528
3
$39,623
1
$66,800
2
$59,190
APPLICATIONS DENIED
2
$97,505
9
$96,930
40
$78,236
28
$29,577
4
$87,558
14
$54,664
APPLICATIONS WITHDRAWN
1
$95,290
5
$83,012
22
$93,931
3
$74,663
2
$67,295
0
$0
FILES CLOSED FOR INCOMPLETENESS
0
$0
1
$71,220
9
$122,146
0
$0
1
$71,220
1
$85,470
Aggregated Statistics For Year 2005 (Based on 2 partial tracts)
A) FHA, FSA/RHS & VA Home Purchase Loans
B) Conventional Home Purchase Loans
C) Refinancings
D) Home Improvement Loans
F) Non-occupant Loans on < 5 Family Dwellings (A B C & D)
G) Loans On Manufactured Home Dwelling (A B C & D)
Number
Average Value
Number
Average Value
Number
Average Value
Number
Average Value
Number
Average Value
Number
Average Value
LOANS ORIGINATED
9
$89,017
32
$99,821
43
$87,513
29
$37,230
11
$120,255
7
$49,120
APPLICATIONS APPROVED, NOT ACCEPTED
0
$0
3
$48,467
7
$74,943
1
$36,840
0
$0
2
$46,175
APPLICATIONS DENIED
0
$0
17
$64,954
53
$80,205
24
$32,870
3
$105,117
16
$56,181
APPLICATIONS WITHDRAWN
0
$0
2
$113,960
42
$95,527
4
$133,482
2
$82,520
2
$78,345
FILES CLOSED FOR INCOMPLETENESS
0
$0
0
$0
7
$112,484
2
$38,315
1
$139,990
0
$0
Aggregated Statistics For Year 2004 (Based on 2 partial tracts)
A) FHA, FSA/RHS & VA Home Purchase Loans
B) Conventional Home Purchase Loans
C) Refinancings
D) Home Improvement Loans
F) Non-occupant Loans on < 5 Family Dwellings (A B C & D)
G) Loans On Manufactured Home Dwelling (A B C & D)
Number
Average Value
Number
Average Value
Number
Average Value
Number
Average Value
Number
Average Value
Number
Average Value
LOANS ORIGINATED
8
$79,759
27
$90,271
51
$78,746
20
$29,177
14
$76,803
5
$54,032
APPLICATIONS APPROVED, NOT ACCEPTED
0
$0
4
$73,312
6
$75,645
4
$24,560
1
$101,680
3
$57,960
APPLICATIONS DENIED
2
$77,120
10
$50,446
53
$68,870
17
$18,781
2
$127,465
13
$52,634
APPLICATIONS WITHDRAWN
1
$80,070
2
$109,290
37
$75,313
4
$64,838
1
$48,140
2
$31,435
FILES CLOSED FOR INCOMPLETENESS
0
$0
1
$55,010
4
$107,818
0
$0
0
$0
0
$0
Aggregated Statistics For Year 2003 (Based on 2 partial tracts)
A) FHA, FSA/RHS & VA Home Purchase Loans
B) Conventional Home Purchase Loans
C) Refinancings
D) Home Improvement Loans
F) Non-occupant Loans on < 5 Family Dwellings (A B C & D)
Number
Average Value
Number
Average Value
Number
Average Value
Number
Average Value
Number
Average Value
LOANS ORIGINATED
7
$84,486
16
$62,567
76
$75,483
9
$22,704
5
$79,968
APPLICATIONS APPROVED, NOT ACCEPTED
0
$0
3
$60,417
10
$83,553
1
$9,330
2
$49,855
APPLICATIONS DENIED
0
$0
6
$58,043
40
$62,542
15
$14,834
1
$27,510
APPLICATIONS WITHDRAWN
1
$46,660
3
$74,990
32
$79,359
1
$19,650
0
$0
FILES CLOSED FOR INCOMPLETENESS
0
$0
0
$0
3
$71,387
1
$17,190
0
$0
Aggregated Statistics For Year 2002 (Based on 2 partial tracts)
A) FHA, FSA/RHS & VA Home Purchase Loans
B) Conventional Home Purchase Loans
C) Refinancings
D) Home Improvement Loans
F) Non-occupant Loans on < 5 Family Dwellings (A B C & D)
Number
Average Value
Number
Average Value
Number
Average Value
Number
Average Value
Number
Average Value
LOANS ORIGINATED
7
$64,067
26
$68,957
58
$76,280
24
$12,177
7
$62,874
APPLICATIONS APPROVED, NOT ACCEPTED
0
$0
3
$75,317
13
$58,037
3
$15,063
1
$50,100
APPLICATIONS DENIED
0
$0
8
$44,331
43
$61,788
10
$19,697
0
$0
APPLICATIONS WITHDRAWN
0
$0
2
$65,575
46
$67,839
3
$16,047
1
$84,980
FILES CLOSED FOR INCOMPLETENESS
0
$0
1
$15,230
4
$80,558
0
$0
0
$0
Aggregated Statistics For Year 2001 (Based on 2 partial tracts)
A) FHA, FSA/RHS & VA Home Purchase Loans
B) Conventional Home Purchase Loans
C) Refinancings
D) Home Improvement Loans
F) Non-occupant Loans on < 5 Family Dwellings (A B C & D)
Number
Average Value
Number
Average Value
Number
Average Value
Number
Average Value
Number
Average Value
LOANS ORIGINATED
10
$71,912
20
$52,755
53
$65,580
23
$17,512
5
$40,770
APPLICATIONS APPROVED, NOT ACCEPTED
0
$0
4
$57,225
10
$71,568
2
$21,860
0
$0
APPLICATIONS DENIED
0
$0
10
$48,874
44
$62,327
10
$19,697
0
$0
APPLICATIONS WITHDRAWN
0
$0
0
$0
28
$68,242
3
$13,917
0
$0
FILES CLOSED FOR INCOMPLETENESS
0
$0
0
$0
2
$54,770
0
$0
0
$0
Aggregated Statistics For Year 2000 (Based on 2 partial tracts)
A) FHA, FSA/RHS & VA Home Purchase Loans
B) Conventional Home Purchase Loans
C) Refinancings
D) Home Improvement Loans
F) Non-occupant Loans on < 5 Family Dwellings (A B C & D)
Number
Average Value
Number
Average Value
Number
Average Value
Number
Average Value
Number
Average Value
LOANS ORIGINATED
5
$71,322
21
$57,026
20
$47,327
14
$15,051
3
$46,990
APPLICATIONS APPROVED, NOT ACCEPTED
0
$0
9
$52,613
7
$44,699
5
$32,812
3
$41,097
APPLICATIONS DENIED
1
$82,030
27
$45,681
21
$44,770
13
$21,424
3
$44,207
APPLICATIONS WITHDRAWN
0
$0
0
$0
16
$53,510
1
$69,260
1
$84,490
FILES CLOSED FOR INCOMPLETENESS
0
$0
0
$0
1
$246,090
0
$0
0
$0
Aggregated Statistics For Year 1999 (Based on 1 partial tract)
A) FHA, FSA/RHS & VA Home Purchase Loans
B) Conventional Home Purchase Loans
C) Refinancings
D) Home Improvement Loans
F) Non-occupant Loans on < 5 Family Dwellings (A B C & D)
Detailed PMIC statistics for the following Tracts:0246.00
2002 - 2018 National Fire Incident Reporting System (NFIRS) incidents
According to the data from the years 2002 - 2018 the average number of fires per year is 17. The highest number of reported fires - 35 took place in 2012, and the least - 2 in 2011. The data has a declining trend.
When looking into fire subcategories, the most incidents belonged to: Structure Fires (58.0%), and Outside Fires (23.8%).
Fire incident types reported to NFIRS in Zip Code 13042


 Nearest zip codes: 13028, 13123, 13483, 13157, 13044, 13030.


 According to the data from the years 2002 - 2018 the average number of fires per year is 17. The highest number of reported fires - 35 took place in 2012, and the least - 2 in 2011. The data has a declining trend.
 When looking into fire subcategories, the most incidents belonged to: Structure Fires (58.0%), and Outside Fires (23.8%).